如何用Python制作3D动态航线图
Posted python6359
tags:
篇首语:本文由小常识网(cha138.com)小编为大家整理,主要介绍了如何用Python制作3D动态航线图相关的知识,希望对你有一定的参考价值。
GeoLines(地理坐标系线图)
用于带有起点和终点信息的线数据的绘制,主要用于地图上的航线,路线的可视化。
GeoLines.add() 方法签名
 1 add(name, data,
 2     maptype=‘china‘,
 3     symbol=None,
 4     symbol_size=12,
 5     border_color="#111",
 6     geo_normal_color="#323c48",
 7     geo_emphasis_color="#2a333d",
 8     geo_cities_coords=None,
 9     geo_effect_period=6,
10     geo_effect_traillength=0,
11     geo_effect_color=‘#fff‘,
12     geo_effect_symbol=‘circle‘,
13     geo_effect_symbolsize=5,
14     is_geo_effect_show=True,
15     is_roam=True, **kwargs)
- name -> str
图例名称 - data -> [list], 包含列表的列表
数据项,数据中,每一行是一个『数据项』,每一列属于一个『维度』。每一行包含两个或三个数据,如 ["广州", "北京"] 或 ["广州", "北京",100],则指定从广州到北京。第三个值用于表示该 line 的数值,该值可省略。 - maptype -> str
地图类型。 从 v0.3.2+ 起,地图已经变为扩展包,支持全国省份,全国城市,全国区县,全球国家等地图 - symbol -> str
线两端的标记类型,可以是一个数组分别指定两端,也可以是单个统一指定。 - symbol_size -> int
线两端的标记大小,可以是一个数组分别指定两端,也可以是单个统一指定。 - border_color -> str
地图边界颜色。默认为 ‘#111‘ - geo_normal_color -> str
正常状态下地图区域的颜色。默认为 ‘#323c48‘ - geo_emphasis_color -> str
高亮状态下地图区域的颜色。默认为 ‘#2a333d‘ - geo_cities_coords -> dict
用户自定义地区经纬度,类似如 {‘阿城‘: [126.58, 45.32],} 这样的字典,当用于提供了该参数时,将会覆盖原有预存的区域坐标信息。 - geo_effect_period -> int/float
特效动画的时间,单位为 s,默认为 6s - geo_effect_traillength -> float
特效尾迹的长度。取从 0 到 1 的值,数值越大尾迹越长。默认为 0 - geo_effect_color -> str
特效标记的颜色。默认为 ‘#fff‘ - geo_effect_symbol -> str
特效图形的标记。有 ‘circle‘, ‘rect‘, ‘roundRect‘, ‘triangle‘, ‘diamond‘, ‘pin‘, ‘arrow‘, ‘plane‘ 可选。 - geo_effect_symbolsize -> int/list
特效标记的大小,可以设置成诸如 10 这样单一的数字,也可以用数组分开表示高和宽,例如 [20, 10] 表示标记宽为 20,高为 10。 - is_geo_effect_show -> bool
是否显示特效。 - is_roam -> bool
是否开启鼠标缩放和平移漫游。默认为 True
如果只想要开启缩放或者平移,可以设置成‘scale‘或者‘move‘。设置成 True 为都开启
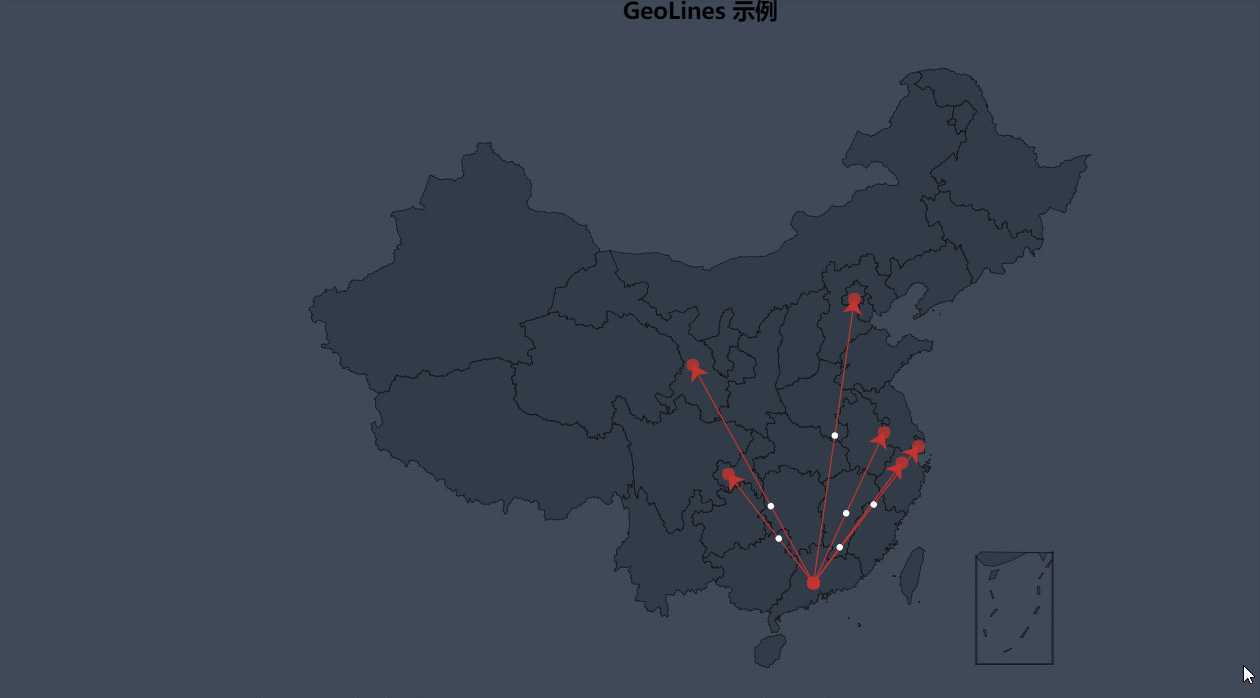
默认效果
 1 from pyecharts import GeoLines, Style
 2
 3 style = Style(
 4     title_top="#fff",
 5     title_pos = "center",
 6     width=1200,
 7     height=600,
 8     background_color="#404a59"
 9 )
10
11 data_guangzhou = [
12     ["广州", "上海"],
13     ["广州", "北京"],
14     ["广州", "南京"],
15     ["广州", "重庆"],
16     ["广州", "兰州"],
17     ["广州", "杭州"]
18 ]
19 geolines = GeoLines("GeoLines 示例", **style.init_style)
20 geolines.add("从广州出发", data_guangzhou, is_legend_show=False)
21 geolines.render()

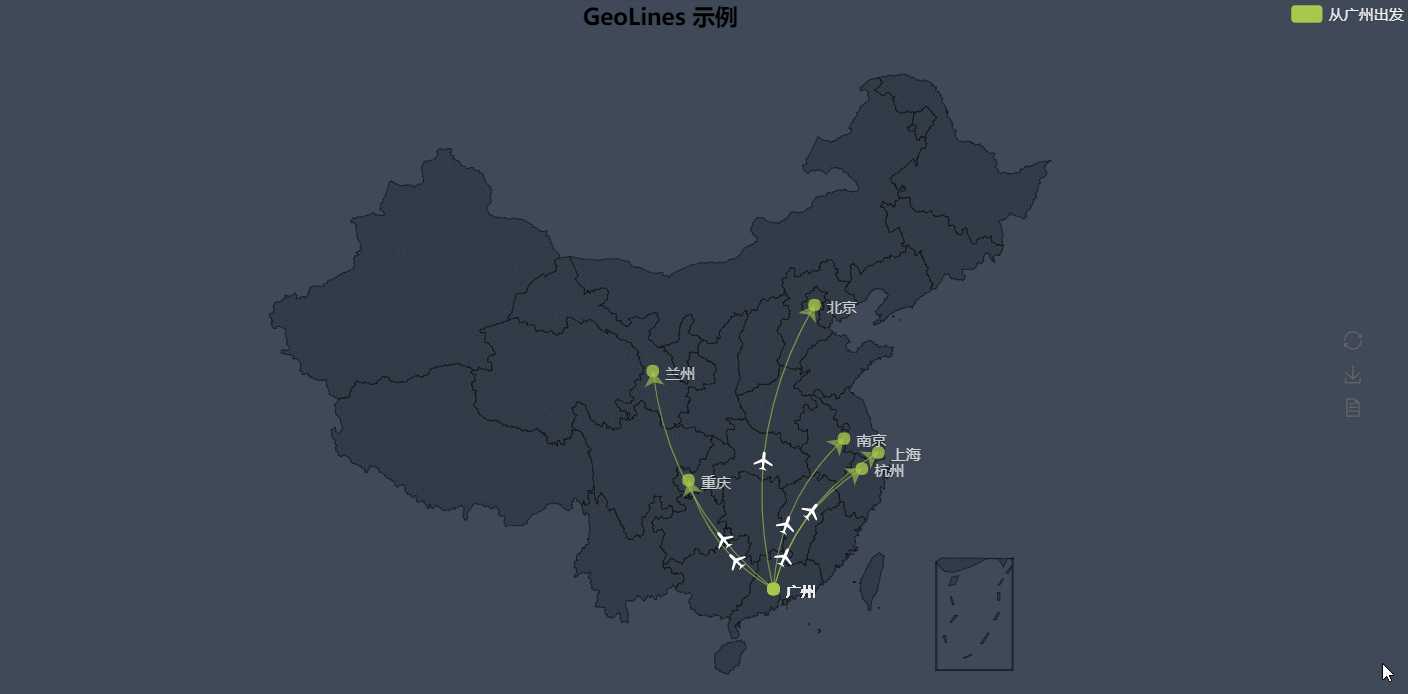
稍加配置
 1 from pyecharts import GeoLines, Style
 2
 3 style_geo = style.add(
 4     is_label_show=True,
 5     line_curve=0.2,
 6     line_opacity=0.6,
 7     legend_text_color="#eee",
 8     legend_pos="right",
 9     geo_effect_symbol="plane",
10     geo_effect_symbolsize=15,
11     label_color=[‘#a6c84c‘, ‘#ffa022‘, ‘#46bee9‘],
12     label_pos="right",
13     label_formatter="{b}",
14     label_text_color="#eee",
15 )
16 geolines = GeoLines("GeoLines 示例", **style.init_style)
17 geolines.add("从广州出发", data_guangzhou, **style_geo)
18 geolines.render()

指定数值
 1 from pyecharts import GeoLines, Style
 2
 3 data_guangzhou = [
 4     ["广州", "上海", 10],
 5     ["广州", "北京", 20],
 6     ["广州", "南京", 30],
 7     ["广州", "重庆", 40],
 8     ["广州", "兰州", 50],
 9     ["广州", "杭州", 60],
10 ]
11 lines = GeoLines("GeoLines 示例", **style.init_style)
12 lines.add(
13     "从广州出发", data_guangzhou, tooltip_formatter="{a} : {c}", **style_geo
14 )
15 lines.render()
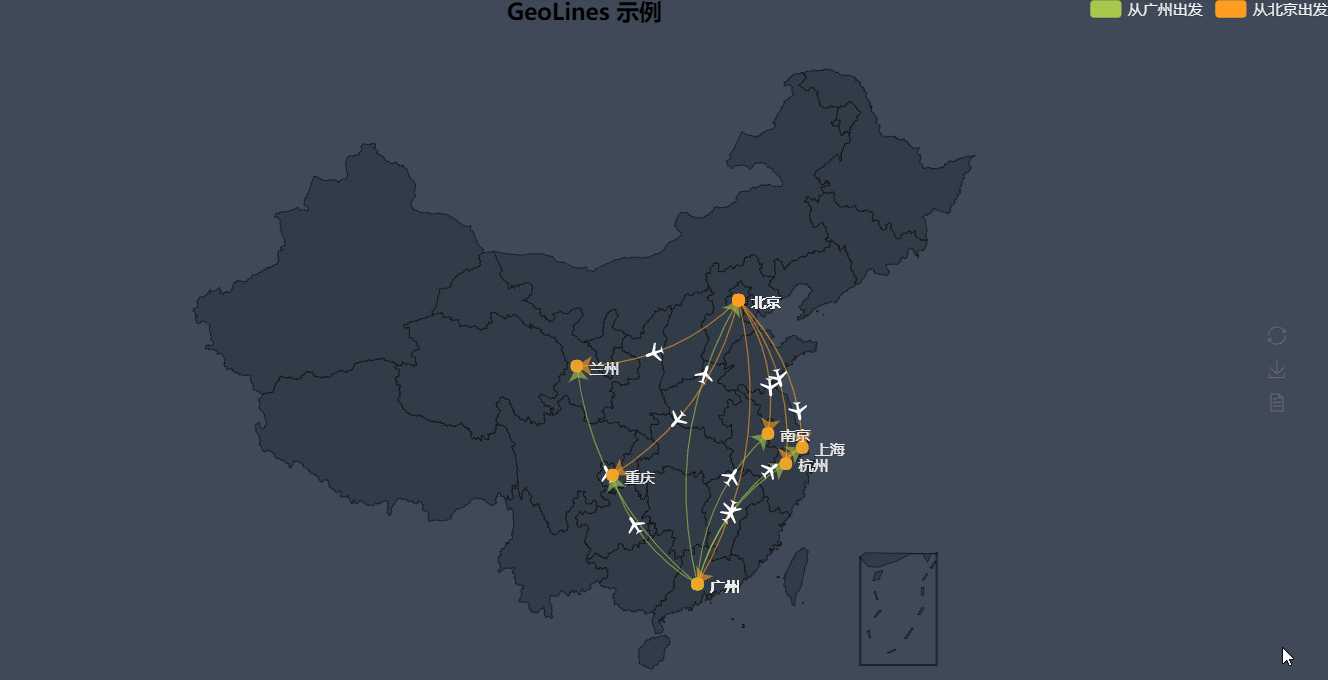
多例模式
 1 from pyecharts import GeoLines, Style
 2
 3 data_beijing = [
 4     ["北京", "上海"],
 5     ["北京", "广州"],
 6     ["北京", "南京"],
 7     ["北京", "重庆"],
 8     ["北京", "兰州"],
 9     ["北京", "杭州"]
10 ]
11 geolines = GeoLines("GeoLines 示例", **style.init_style)
12 geolines.add("从广州出发", data_guangzhou, **style_geo)
13 geolines.add("从北京出发", data_beijing, **style_geo)
14 geolines.render()

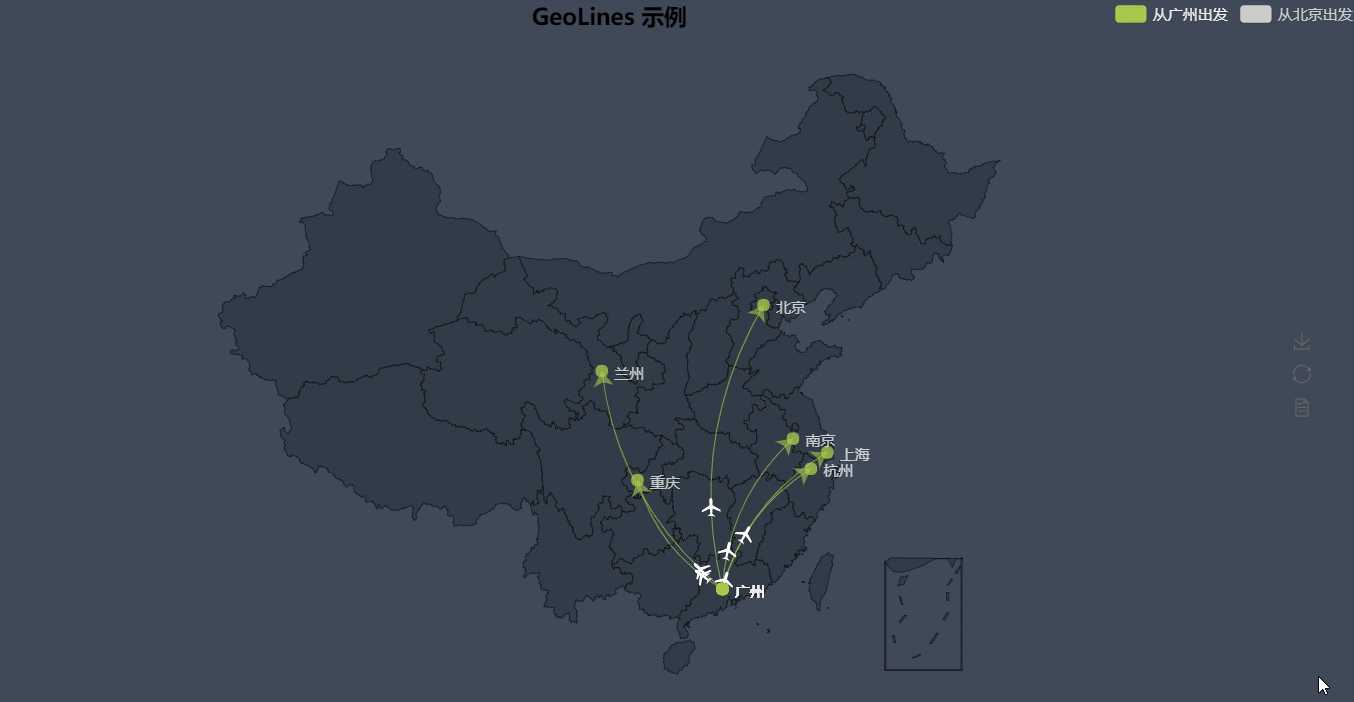
单例模式,指定 legend_selectedmode="single"
 1 from pyecharts import GeoLines, Style
 2
 3 style_geo = style.add(
 4     is_label_show=True,
 5     line_curve=0.2,
 6     line_opacity=0.6,
 7     legend_text_color="#eee",
 8     legend_pos="right",
 9     geo_effect_symbol="plane",
10     geo_effect_symbolsize=15,
11     label_color=[‘#a6c84c‘, ‘#ffa022‘, ‘#46bee9‘],
12     label_pos="right",
13     label_formatter="{b}",
14     label_text_color="#eee",
15     legend_selectedmode="single", #指定单例模式
16 )
17 geolines = GeoLines("GeoLines 示例", **style.init_style)
18 geolines.add("从广州出发", data_guangzhou, **style_geo)
19 geolines.add("从北京出发", data_beijing, **style_geo)
20 geolines.render()

GeoLines(地理坐标系线图)
用于带有起点和终点信息的线数据的绘制,主要用于地图上的航线,路线的可视化。
以上是关于如何用Python制作3D动态航线图的主要内容,如果未能解决你的问题,请参考以下文章