Python数据处理——绘制函数图形以及数据拟合
Posted 何爱平
tags:
篇首语:本文由小常识网(cha138.com)小编为大家整理,主要介绍了Python数据处理——绘制函数图形以及数据拟合相关的知识,希望对你有一定的参考价值。
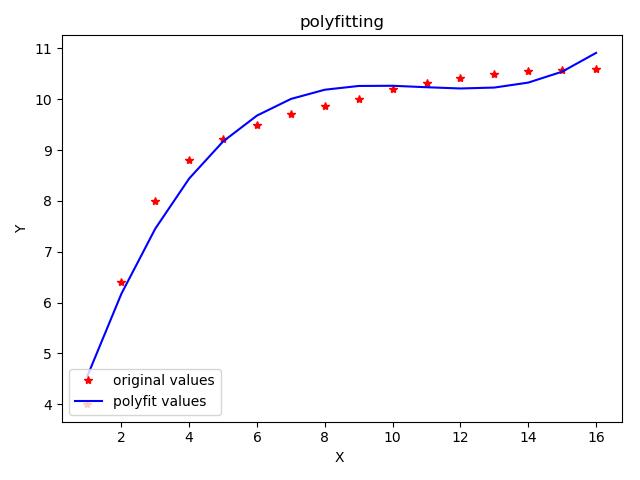
1.多项式拟合
对散点进行多项式拟合并打印出拟合函数以及拟合后的图形
import matplotlib.pyplot as plt
import numpy as np
x=np.arange(1,17,1) #生成散点列表作为x的值
y=np.array([4.00, 6.40, 8.00, 8.80, 9.22, 9.50, 9.70, 9.86, 10.00, 10.20, 10.32, 10.42, 10.50, 10.55, 10.58, 10.60]) #给定y的散点值
#用3次多项式拟合
z1=np.polyfit(x,y,3)
p1=np.poly1d(z1)
print(p1) #打印拟合的多项式
yvals=p1(x) #拟合后的y值
plot1=plt.plot(x,y,\'r*\',label=\'original values\')
plot2=plt.plot(x,yvals,\'b\',label=\'polyfit values\')
plt.xlabel(\'X \')
plt.ylabel(\'Y\')
# \'best\'         : 0, (only implemented for axes legends)(自适应方式)
# \'upper right\'  : 1,
# \'upper left\'   : 2,
# \'lower left\'   : 3,
# \'lower right\'  : 4,
# \'right\'        : 5,
# \'center left\'  : 6,
# \'center right\' : 7,
# \'lower center\' : 8,
# \'upper center\' : 9,
# \'center\'       : 10,
plt.legend(loc=3) #设置图示的位置
plt.title(\'polyfitting\') #设置标题
plt.show() #显示图片
plt.savefig(\'p1.png\')
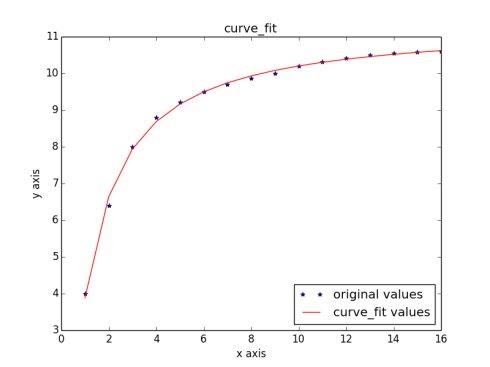
2.指定函数拟合
#使用非线性最小二乘法拟合
import matplotlib.pyplot as plt
from scipy.optimize import curve_fit
import numpy as np
#用指数形式来拟合
x = np.arange(1, 17, 1)
y = np.array([4.00, 6.40, 8.00, 8.80, 9.22, 9.50, 9.70, 9.86, 10.00, 10.20, 10.32, 10.42, 10.50, 10.55, 10.58, 10.60])
def func(x,a,b):
return a*np.exp(b/x)
popt, pcov = curve_fit(func, x, y)
a=popt[0]#popt里面是拟合系数,读者可以自己help其用法
b=popt[1]
yvals=func(x,a,b)
plot1=plt.plot(x, y, \'*\',label=\'original values\')
plot2=plt.plot(x, yvals, \'r\',label=\'curve_fit values\')
plt.xlabel(\'x axis\')
plt.ylabel(\'y axis\')
plt.legend(loc=4)#指定legend的位置,读者可以自己help它的用法
plt.title(\'curve_fit\')
plt.show()
plt.savefig(\'p2.png\')
以上是关于Python数据处理——绘制函数图形以及数据拟合的主要内容,如果未能解决你的问题,请参考以下文章