NetworkX
Posted Chuck Lu
tags:
篇首语:本文由小常识网(cha138.com)小编为大家整理,主要介绍了NetworkX相关的知识,希望对你有一定的参考价值。
find_cycle vs simple_cycles in networkx
find_cycle and simple_cycles are two functions provided by the networkx library in Python for finding cycles in a graph.
find_cycle is a function that finds a cycle in a directed graph. It returns a list of nodes that form a cycle. If no cycle is found, it returns None. The function uses a depth-first search algorithm to find a cycle. If there are multiple cycles in the graph, it returns one of them.
simple_cycles is a function that finds all simple cycles in a directed graph. It returns a list of lists of nodes, where each inner list represents a simple cycle. If no cycle is found, it returns an empty list. The function uses an algorithm based on Johnson\'s algorithm to find all simple cycles.
The main difference between the two functions is that find_cycle returns only one cycle, while simple_cycles returns all simple cycles in the graph. Additionally, find_cycle is faster than simple_cycles for finding a single cycle, while simple_cycles is better suited for finding all cycles in a graph.
python3 networkx
一.networkx
1.用于图论和复杂网络
2.官网:http://networkx.github.io/
3.networkx常常结合numpy等数据处理相关的库一起使用,通过matplot来可视化图
二.绘制图
1.创建图

 1 import networkx as nx
 2 import matplotlib.pyplot as plt
 3
 4 G=nx.Graph()#创建空图,无向图
 5 # G1=nx.DiGraph(e)#创建空图,有向图
 6 # G = nx.Graph(name=\'my graph\')#指定图的属性(name) 的值(my graph)
 7 G.add_edges_from(([1,2],[2,3],[3,1]))
 8
 9 e = [(1, 2), (2, 3), (3, 4)]  # 边的列表
10 G2 = nx.Graph(e)#根据e来创建图
11
12 F=G.to_directed()#把无向图转换为有向图
13
14 #创建多图,类MultiGraph和类MultiDiGraph允许添加相同的边两次,这两条边可能附带不同的权值
15 # H=nx.MultiGraph(e)
16 H=nx.MultiDiGraph(e)
17
18 plt.subplot(2,2,1)
19 nx.draw(G,with_labels=True)
20 plt.subplot(2,2,2)
21 nx.draw(G2,with_labels=True)
22 plt.subplot(2,2,3)
23 nx.draw(F,with_labels=True)
24 plt.subplot(2,2,4)
25 nx.draw(H,with_labels=True)
26
27 plt.show()
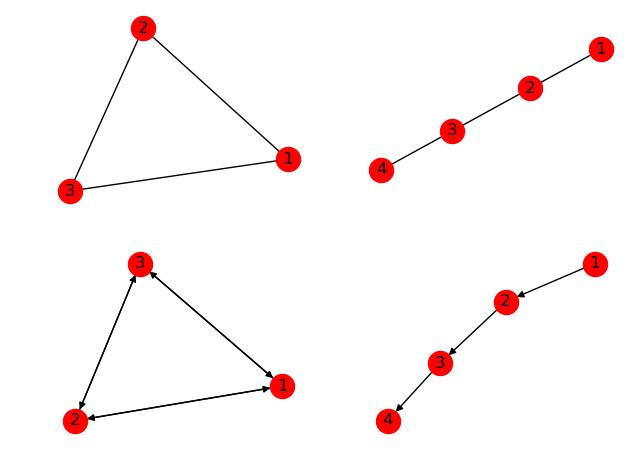

2.无向图

 1 import networkx as nx
 2 import matplotlib.pyplot as plt
 3
 4 G=nx.Graph()#创建空图
 5
 6 #添加节点
 7 G.add_node(\'a\')
 8 G.add_node(1)                  #添加单个节点
 9 G.add_nodes_from([2,3,4])      #添加一些节点,容器,(可以是list, dict, set,)
10
11 #添加边,如果点不在图中,会自动创建点
12 G.add_edge(1,\'a\',weight=1.2)   #添加单条边,连接1,‘a’的边,可以赋予边属性以及他的值
13 G.add_edges_from([(2,3),(3,4)])#添加一些边(列表)
14 G.add_weighted_edges_from([(1,\'a\',0.1),(4,2,0.5)])#给边赋予权重
15
16 #移除边
17 G.remove_edge(2,4)             #移除一条边
18 G.remove_edges_from([(3,4),])  #移除一些边
19
20 #移除节点,同时移除他对应的边
21 G.remove_node(1)               #移除单个节点
22 G.remove_nodes_from([4,])      #移除一些节点
23
24 #绘图
25 nx.draw(G,                          # 图
26         pos=nx.circular_layout(G),  # 图的布局
27         alpha=0.5,                  # 图的透明度(默认1.0不透明,0完全透明)
28
29         with_labels=True,           # 节点是否带标签
30         font_size=18,               # 节点标签字体大小
31         node_size=400,              # 指定节点的尺寸大小
32         node_color=\'blue\',          # 指定节点的颜色
33         node_shape=\'o\',             # 节点的形状
34
35         edge_color=\'r\',             # 边的颜色
36         width=0.8,                  # 边的宽度
37         style=\'solid\',              # 边的样式
38
39         ax=None,                    # Matplotlib Axes对象,可选在指定的Matplotlib轴中绘制图形。
40         )
41
42 plt.show()

绘图布局

3.有向图和无向图的最大差别在于:有向图中的边是有顺序的,前一个表示开始节点,后一个表示结束节点。
三.图
数据结构


1.图的属性

 1 #像color,label,weight或者其他Python对象的属性都可以被设置为graph,node,edge的属性
 2 # 每个graph,node,edge都能够包含key/value这样的字典数据
 3 import networkx as nx
 4 import matplotlib.pyplot as plt
 5
 6 G=nx.DiGraph([(1,2),(2,3),(3,4),(1,4),(4,2)],name=\'my digraph\',a=\'b\')
 7 #创建一个有向图,赋予边,点,权重,以及有向图的属性name的值my digraph
 8
 9 #属性都可以在定义时赋予,或者通过直接赋值来添加修改
10 #图属性
11 print(G)#图的名称
12 print(G.graph)#图的属性,字典
13 G.graph[\'b\']=19#赋予属性
14 print(G.graph)
15 print(\'#\'*60)
16
17 #节点属性
18 print(\'图的节点:\',G.nodes)#列表
19 print(\'节点个数:\',G.number_of_nodes())
20 G.add_node(\'b\',time=\'0.2\')
21 print(G.node[\'b\'])#显示单个节点的信息
22 G.node[\'b\'][\'time\']=0.3#修改属性
23 print(G.node[\'b\'])
24 print(\'#\'*60)
25
26 #边属性
27 print(\'图的边:\',G.edges)#列表
28 print (\'边的个数:\',G.number_of_edges())
29 G.add_edge(\'a\',\'b\',weight=0.6)
30 G.add_edges_from( [ (2,3),(3,4) ], color="red")
31 G.add_edges_from( [(1,2,{"color":"blue"}),(4,5,{"weight":8})])
32 G[1][2]["width"]=4.7#添加或修改属性
33 print(G.get_edge_data(1, 2))#获取某条边的属性
34 print(\'#\'*60)
35
36 nx.draw(G,pos = nx.circular_layout(G),with_labels=True)
37
38 plt.show
39 --------------------------------------------------------------------------
40 my digraph
41 {\'name\': \'my digraph\', \'a\': \'b\'}
42 {\'name\': \'my digraph\', \'a\': \'b\', \'b\': 19}
43 ############################################################
44 图的节点: [1, 2, 3, 4]
45 节点个数: 4
46 {\'time\': \'0.2\'}
47 {\'time\': 0.3}
48 {2: {}, 4: {}}
49 ############################################################
50 图的边: [(1, 2), (1, 4), (2, 3), (3, 4), (4, 2)]
51 边的个数: 5
52 {\'color\': \'blue\', \'width\': 4.7}
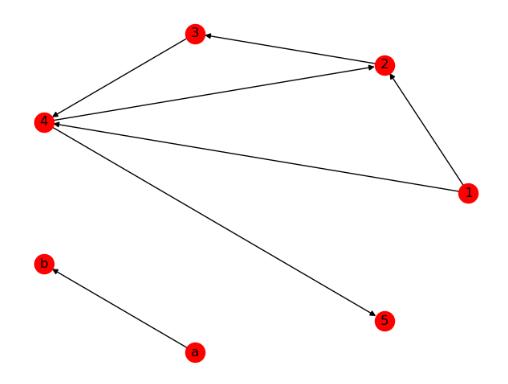
2.边和节点

 1 import networkx as nx
 2 import matplotlib.pyplot as plt
 3
 4 G=nx.DiGraph([(1,2,{\'weight\':10}),(2,3),(3,4),(1,4),(4,2)])
 5
 6 nx.add_path(G, [0, 4,3])#在图中添加路径
 7
 8 # 对1节点进行分析
 9 print(G.node[1])#节点1的信息
10 G.node[1][\'time\']=1#赋予节点属性
11 print(G.node[1])
12 print(G[1])  # 1相关的节点的信息,他的邻居和对应的边的属性
13 print(G.degree(1))  # 1节点的度
14 print(\'#\'*60)
15
16 # 对【1】【2】边进行分析
17 print(G[1][2])  # 查看某条边的属性
18 G[1][2][\'weight\'] = 0.4  # 重新设置边的权重
19 print(G[1][2][\'weight\'])  # 查看边的权重
20 G[1][2][\'color\'] = \'blue\'  # 添加属性
21 print(G[1][2])
22
23 nx.draw(G,pos = nx.circular_layout(G),with_labels=True)
24
25 plt.show()
26 ------------------------------------------------------------------
27 {}
28 {\'time\': 1}
29 {2: {\'weight\': 10}, 4: {}}
30 2
31 ############################################################
32 {\'weight\': 10}
33 0.4
34 {\'weight\': 0.4, \'color\': \'blue\'}
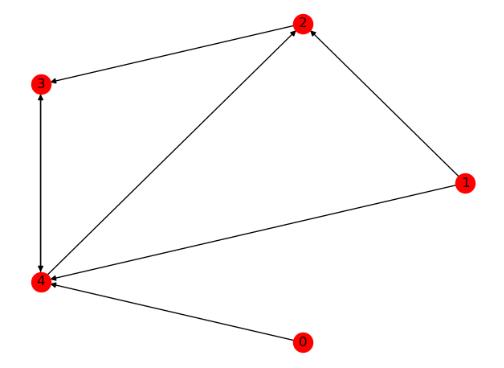
3.有向图

 1 import networkx as nx
 2 import matplotlib.pyplot as plt
 3
 4 G=nx.DiGraph([(1,2,{\'weight\':10}),(2,3),(3,4),(1,4),(4,2)])
 5 print(\'#\'*60)
 6 print(G.edges)#An OutEdgeView of the DiGraph as G.edges or G.edges().
 7 print(G.out_edges)#An OutEdgeView of the DiGraph as G.edges or G.edges().
 8 print(G.in_edges)#An InEdgeView of the Graph as G.in_edges or G.in_edges()
 9 print(\'#\'*60)
10
11 print(G.degree)#图的度
12 print(G.out_degree)#图的出度
13 print(G.in_degree)#图的入度
14 print(\'#\'*60)
15
16 print(G.adj)#Graph adjacency object holding the neighbors of each node
17 print(G.neighbors(2))#节点2的邻居
18 print(G.succ)#Graph adjacency object holding the successors of each node
19 print(G.successors(2))#节点2的后继节点
20 print(G.pred)#Graph adjacency object holding the predecessors of each node
21 print(G.predecessors(2))#节点2的前继节点
22 #以列表形式打印
23 print([n for n in G.neighbors(2)])
24 print([n for n in G.successors(2)])
25 print([n for n in G.predecessors(2)])
26
27 nx.draw(G,pos = nx.circular_layout(G),with_labels=True)
28
29 plt.show()
30 --------------------------------------------------------
31 ############################################################
32 [(1, 2), (1, 4), (2, 3), (3, 4), (4, 2)]
33 [(1, 2), (1, 4), (2, 3), (3, 4), (4, 2)]
34 [(1, 2), (4, 2), (2, 3), (3, 4), (1, 4)]
35 ############################################################
36 [(1, 2), (2, 3), (3, 2), (4, 3)]
37 [(1, 2), (2, 1), (3, 1), (4, 1)]
38 [(1, 0), (2, 2), (3, 1), (4, 2)]
39 ############################################################
40 {1: {2: {\'weight\': 10}, 4: {}}, 2: {3: {}}, 3: {4: {}}, 4: {2: {}}}
41 <dict_keyiterator object at 0x0DA2BF00>
42 {1: {2: {\'weight\': 10}, 4: {}}, 2: {3: {}}, 3: {4: {}}, 4: {2: {}}}
43 <dict_keyiterator object at 0x0DA2BF00>
44 {1: {}, 2: {1: {\'weight\': 10}, 4: {}}, 3: {2: {}}, 4: {3: {}, 1: {}}}
45 <dict_keyiterator object at 0x0DA2BF00>
46 [3]
47 [3]
48 [1, 4]
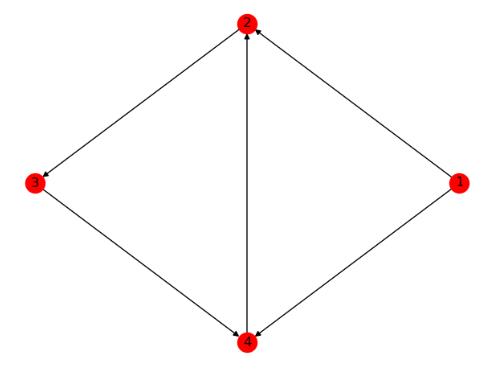
4.图的操作
Applying classic graph operations


 1 import networkx as nx
 2 import matplotlib.pyplot as plt
 3
 4 G=nx.DiGraph([(1,2,{\'weight\':10}),(2,1,{\'weight\':1}),(2,3),(3,4),(1,4),(4,2)])
 5 G2=nx.DiGraph([(1,\'a\'),(\'a\',\'b\'),(1,4)])
 6
 7 H=G.subgraph([1,2,4])#产生关于节点的子图
 8
 9 G3=nx.compose(H,G2)#结合两个图并表示两者共同的节点
10
11 plt.subplot(221)
12 nx.draw(G,pos = nx.circular_layout(G),with_labels=True,name=\'G\')
13
14 plt.subplot(222)
15 nx.draw(H,pos = nx.circular_layout(G),with_labels=True)
16
17 plt.subplot(223)
18 nx.draw(G2,with_labels=True)
19
20 plt.subplot(224)
21 nx.draw(G3,with_labels=True)
22
23 plt.show()

4.算法
...
四.简单根据数据画图

1 import networkx as nx 2 import matplotlib.pyplot as plt 3 4 #1.导入数据: 5 # networkx支持的直接处理的数据文件格式adjlist/edgelist/gexf/gml/pickle/graphml/json/lead/yaml/graph6/sparse6/pajek/shp/ 6 #根据实际情况,把文件变为gml文件 7 G1 = nx.DiGraph() 8 with open(\'file.txt\') as f: 9 for line in f: 10 cell = line.strip().split(\',\') 11 G1.add_weighted_edges_from([(cell[0],cell[1],cell[2])]) 12 nx.write_gml(G1,\'file.gml\')#写网络G进GML文件 13 14 G=nx.read_gml("file.gml") #读取gml文件 15 # parse_gml(lines[,relael]) 从字符串中解析GML图 16 # generate_gml(G) 以gml格式生成一个简单条目的网络G 17 18 print(G.nodes) 19 print(G.edges) 20 21 #2.在figure上先设置坐标 22 plt.title("图G") 23 plt.ylabel("y") 24 plt.xlabel("x") 25 plt.xlim(-1,1) 26 plt.ylim(-1,1) 27 28 #再在坐标轴里面调节图形大小 29 #整个figure按照X与Y轴横竖来平均切分,以0到1之间的数值来表示 30 #axes([x,y,xs,ys]),如果不设置 31 #其中x代表在X轴的位置,y代表在Y轴的位置,xs代表在X轴上向右延展的范围大小,yx代表在Y轴中向上延展的范围大小 32 plt.axes([0.1, 0.1, 0.8, 0.8]) 33 34 #3.在axes中绘图 35 nx.draw(G,pos = nx.circular_layout(G),with_labels=True,) 36 37 #4.保存图形 38 plt.savefig("file.png")#将图像保存到一个文件 39 40 plt.show() 41 ----------------------------------------------------- 42 [\'6\', \'2\', \'5\', \'1\', \'15\', \'4\', \'3\', \'13\', \'16\', \'10\', \'7\', \'21\', \'20\', \'8\', \'17\', \'23\', \'25\', \'26\', \'28\', \'29\', \'31\', \'32\', \'34\', \'35\', \'36\', \'37\', \'44\', \'39\', \'45\', \'19\', \'46\', \'47\', \'51\', \'52\', \'53\', \'54\', \'41\', \'55\', \'57\', \'61\', \'65\', \'56\', \'66\', \'69\', \'70\', \'71\', \'72\', \'74\', \'75\', \'68\', \'64\', \'76\', \'77\', \'78\', \'60\', \'79\', \'80\', \'81\', \'62\', \'83\',
