python数据分析之:时间序列一
Posted 一张红枫叶
tags:
篇首语:本文由小常识网(cha138.com)小编为大家整理,主要介绍了python数据分析之:时间序列一相关的知识,希望对你有一定的参考价值。
在处理很多数据的时候,我们都要用到时间的概念。比如时间戳,固定时期或者时间间隔。pandas提供了一组标准的时间序列处理工具和数据算法。
在python中datetime.datetime模块是用的最多的模块。比如使用datetime.datetime.now()就得到了当前的时间2018-04-14 14:12:31.888964。这个时间包含了年,月,日,小时,分钟,秒,毫秒。
通过datetime模块还可以得到两个时间的时间差
t1=datetime(2018,4,11)
t2=datetime(2018,3,3)
print(t1-t2)
39 days, 0:00:00
也可以通过timedelta进行日期的运算
t1=datetime(2018,4,11)
delta=timedelta(12)
print(t1+delta)
结果:
2018-04-23 00:00:00
但是实际在代码开发过程中,我们经常会遇到用字符串来表示时间,如何转换成datetime模块呢。这里需要用打算哦strptime函数。
value=\'2018-4-12\'
datetime.strptime(value,\'%Y-%m-%d\')
但是每次都需要用strptime来转换时间太过于麻烦。而且很多时候有不同的时间表达式。比如‘Apri 12,2018’这种格式就无法通过strptime来转换。这里及需要用到dateutil中的parser方法
from dateutil.parser import parse
parse(\'April 12,2018 12:00 PM\')
运行结果:
2018-04-12 12:00:00
还有下面的这种格式,如果设置dayfirst为True.那么表示第一个表示日,而不是月
parse(\'12/4/2018\',dayfirst=True)
2018-04-12 00:00:00
如果不设置,则表示第一个参数为月,
parse(\'12/4/2018\')
2018-12-04 00:00:00
下面介绍pandas中如何处理日期
datestr=[\'4/12/2018\',\'3/12/2018\']
pd.to_datetime(datestr)
运行结果,得到的是一个datetime对象。
DatetimeIndex([\'2018-04-12\', \'2018-03-12\'], dtype=\'datetime64[ns]\', freq=None)
时间序列:
pandas最基本的时间序列类型就是时间戳为索引的series
datestr=[datetime(2018,4,12),datetime(2018,4,11),datetime(2018,4,10),datetime(2018,4,9)]
ts=Series(np.random.randn(4),index=datestr)
2018-04-12 0.282997
2018-04-11 0.775905
2018-04-10 -1.039524
2018-04-09 1.946392
dtype: float64
索引,选取,子集
既然通过时间形成了时间序列。那么也可以通过时间索引来的到对应的值。
stamp=ts.index[2]
ts[stamp]
对于时间较长的序列,比如持续100天或者跨度年,月。那么index就可以通过pd.date_range的方法设置起始时间以及时间跨度。在这里periods这里就表示的是持续时间。
ts=Series(np.random.randn(100),index=pd.date_range(\'4/12/2018\',periods=100))
得到从4月12号往后一白天的时间。
2018-04-12 -0.148937
2018-04-13 0.937058
2018-04-14 -2.096196
2018-04-15 0.916470
2018-04-16 -0.697598
2018-04-17 0.643925
2018-04-18 -0.307314
2018-04-19 -0.141321
2018-04-20 -0.175498
2018-04-21 -0.829793
2018-04-22 -0.024155
2018-04-23 -1.051386
2018-04-24 0.540014
2018-04-25 0.154808
2018-04-26 1.358971
2018-04-27 0.525493
2018-04-28 -0.669124
2018-04-29 -0.207421
2018-04-30 -0.228202
2018-05-01 0.816570
2018-05-02 -0.877241
2018-05-03 0.772659
2018-05-04 0.554481
2018-05-05 -0.714872
2018-05-06 1.773668
2018-05-07 0.326872
2018-05-08 -1.079632
2018-05-09 1.024192
2018-05-10 -0.646678
2018-05-11 -1.515030
...
2018-06-21 -0.053543
2018-06-22 2.118719
2018-06-23 0.106124
2018-06-24 0.659720
2018-06-25 -0.991692
2018-06-26 -0.556483
2018-06-27 -0.819689
2018-06-28 0.031711
2018-06-29 0.543342
2018-06-30 0.009368
2018-07-01 1.141678
2018-07-02 0.222943
2018-07-03 0.303460
2018-07-04 -0.815658
2018-07-05 1.291347
2018-07-06 -0.681728
2018-07-07 -0.327148
2018-07-08 1.385592
2018-07-09 1.302346
2018-07-10 1.179094
2018-07-11 -0.465722
2018-07-12 -0.351399
2018-07-13 0.059268
2018-07-14 -0.235086
2018-07-15 0.983399
2018-07-16 -1.767474
2018-07-17 0.596053
2018-07-18 -2.022643
2018-07-19 0.539513
2018-07-20 0.421791
Freq: D, Length: 100, dtype: float64
在上面生成的这个序列中,可以通过设置索引的到某一年或者某一月的数据。ts[\'2018-4\']就可以得到4月份的数据。格式也可以是ts[\'2018/4\']
通过下面的方式得到一段时间内的数据
ts[\'2018/4/12\':\'2018/4/23\']
运行结果:
2018-04-12 -1.080229
2018-04-13 1.231485
2018-04-14 0.725456
2018-04-15 0.029311
2018-04-16 0.331900
2018-04-17 0.921682
2018-04-18 -0.822750
2018-04-19 -0.569305
2018-04-20 0.589461
2018-04-21 1.405626
2018-04-22 -0.049872
2018-04-23 -0.144766
Freq: D, dtype: float64
还可以通过truncate的方式得到某段时间前或者后的数据
ts.truncate(after=\'2018/4/15\') #得到2018/4/15之前的数据
ts.truncate(before=\'2018/4/15\') #得到2018/4/15之后的数据
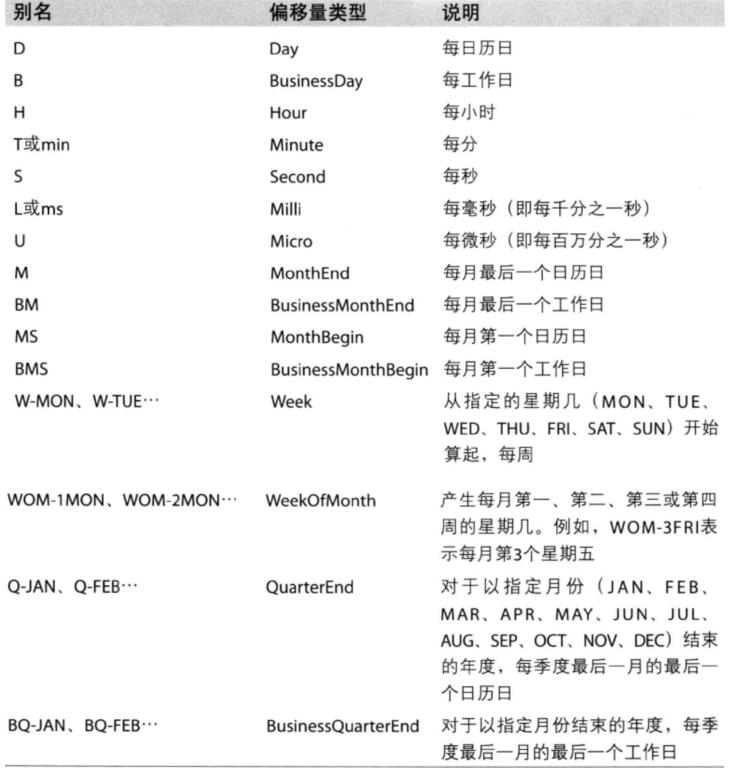
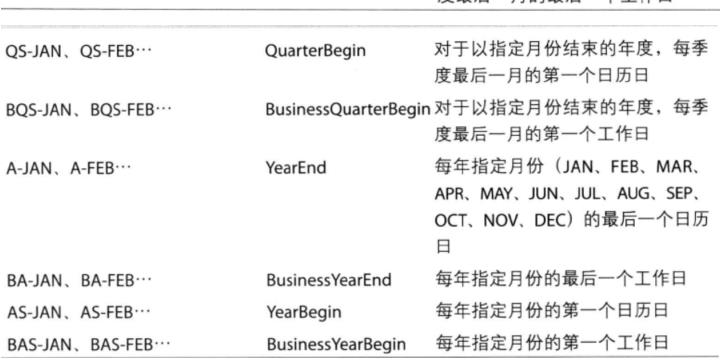
前面设置的时间序列的间隔是天级的。如要设置间隔是月度或者是年度的间隔,就需要设置freq的值,D,M,Y反别代表日为间隔,月为间隔,年为间隔。
pd.date_range(\'4/12/2018\',periods=100,freq=\'D\')
pd.date_range(\'4/12/2018\',periods=100,freq=\'M\')
pd.date_range(\'4/12/2018\',periods=100,freq=\'Y\')
还有其他很多的参数设置。具体的参数设置如下:


带有重复序列的时间序列
在有些应用场景中,可能会存在多个观测数据落在同一个时间点的情况
dup_ts=Series(np.arange(4),index=dates)
2018-04-12 0
2018-04-13 1
2018-04-14 2
2018-04-14 3
dtype: int64
通过is_unique就可以得到是否是重复序列
dup_ts.index.is_unique
日期的范围,频率以及移动
pd.date_range(\'4/12/2018\',\'5/12/2018\')
得到4月12日到5月12日的日期。同样的也可以设置freq来设置间隔
DatetimeIndex([\'2018-04-12\', \'2018-04-13\', \'2018-04-14\', \'2018-04-15\',
\'2018-04-16\', \'2018-04-17\', \'2018-04-18\', \'2018-04-19\',
\'2018-04-20\', \'2018-04-21\', \'2018-04-22\', \'2018-04-23\',
\'2018-04-24\', \'2018-04-25\', \'2018-04-26\', \'2018-04-27\',
\'2018-04-28\', \'2018-04-29\', \'2018-04-30\', \'2018-05-01\',
\'2018-05-02\', \'2018-05-03\', \'2018-05-04\', \'2018-05-05\',
\'2018-05-06\', \'2018-05-07\', \'2018-05-08\', \'2018-05-09\',
\'2018-05-10\', \'2018-05-11\', \'2018-05-12\'],
dtype=\'datetime64[ns]\', freq=\'D\')
如果想对生成的时间序列进行移位获取。就要用到shift函数
ts=Series(np.random.randn(4),index=pd.date_range(\'4/12/2018\',periods=4,freq=\'M\'))
print(ts)
print(ts.shift(2))
结果如下,时间被移位,对应的数据也移位
2018-04-30 -0.065679
2018-05-31 -0.163013
2018-06-30 0.501377
2018-07-31 0.856595
Freq: M, dtype: float64
2018-04-30 NaN
2018-05-31 NaN
2018-06-30 -0.065679
2018-07-31 -0.163013
Freq: M, dtype: float64
由于单纯的移位操作不会修改索引。所以部分数据会被丢弃。因此,如果频率已知,则可以将其传给shift可以实现时间戳进行位移而不是对数据进行简单位移
ts.shift(2,freq=\'M\')
2018-06-30 -0.235855
2018-07-31 1.189707
2018-08-31 0.005851
2018-09-30 -0.134599
Freq: M, dtype: float64
以上是关于python数据分析之:时间序列一的主要内容,如果未能解决你的问题,请参考以下文章