决策树可视化Graphviz中文乱码
Posted cup_leo
tags:
篇首语:本文由小常识网(cha138.com)小编为大家整理,主要介绍了决策树可视化Graphviz中文乱码相关的知识,希望对你有一定的参考价值。
输出svg时中文显示正常!!!
from six import StringIO
#可视化
dot_data = StringIO()
tree.export_graphviz(clf,out_file = dot_data,feature_names=feature_name,
                     class_names=target_name,filled=True,rounded=True,
                     special_characters=True)
graph = pydotplus.graph_from_dot_data(dot_data.getvalue())
graph.write_svg("Tree.svg")
参考:(67条消息) 亲测!决策树可视化Graphviz中文乱码问题~_graphviz可视化改为字_数据社的博客-CSDN博客
决策树随机森林结果可视化
决策树、随机森林结果可视化
【 本文测试环境为 python3 】
一、 决策树可视化环境搭建
scikit-learn中决策树的可视化一般需要安装graphviz。主要包括graphviz的安装和python的graphviz插件的安装。
- 第一步是安装graphviz。
下载地址在:http://www.graphviz.org/。如果你是linux,可以用apt-get或者yum的方法安装。如果是windows,就在官网下载msi文件安装。无论是linux还是windows,装完后都要设置环境变量,将graphviz的bin目录加到PATH,比如我是windows,将 G:/program_files/graphviz/bin/ 加入了PATH - 第二步是安装python插件graphviz:
pip install graphviz- 第三步是安装python插件pydotplus。这个没有什么好说的:
pip install pydotplus这样环境就搭好了,有时候python会很笨,仍然找不到graphviz,这时,可以在代码里面加入这一行:
import os
os.environ["PATH"] += os.pathsep + 'G:/program_files/graphviz/bin'
注意后面的路径是你自己的graphviz的bin目录。
二、 决策树可视化的三种方法
可视化需要在模型训练好后,即执行clf.fit(x, y)函数之后:
第一种
with open("iris.dot", 'w') as f:
f = tree.export_graphviz(clf, out_file=f)然后打开命令行,执行:
#注意,这个命令在命令行执行
dot -Tpdf iris.dot -o iris.pdf
第二种
使用pydotplus库:
import pydotplus
dot_data = tree.export_graphviz(clf, out_file=None)
graph = pydotplus.graph_from_dot_data(dot_data)
graph.write_pdf("iris.pdf")
第三种
使用IPython的display。需要安装jupyter notebook。
from IPython.display import Image
## 添加graphviz的环境变量
import os
os.environ["PATH"] += os.pathsep + 'G:/program_files/graphviz/bin'

dot_data = tree.export_graphviz(clf, out_file=None,
                         feature_names=iris.feature_names,
                         class_names=iris.target_names,
                         filled=True, rounded=True,
                         special_characters=True)
graph = pydotplus.graph_from_dot_data(dot_data)
Image(graph.create_png())
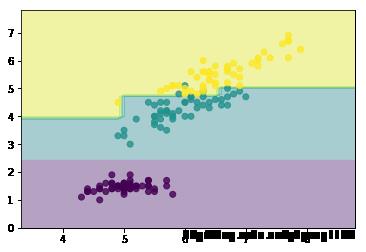
三、 决策树可视化实例
#-*- coding: utf-8 -*-
from itertools import product

import numpy as np
import matplotlib.pyplot as plt

from sklearn import datasets
from sklearn.tree import DecisionTreeClassifier


# 仍然使用自带的iris数据
iris = datasets.load_iris()
X = iris.data[:, [0, 2]]
y = iris.target

# 训练模型,限制树的最大深度4
clf = DecisionTreeClassifier(max_depth=4)
#拟合模型
clf.fit(X, y)

# 画图
x_min, x_max = X[:, 0].min() - 1, X[:, 0].max() + 1
y_min, y_max = X[:, 1].min() - 1, X[:, 1].max() + 1
xx, yy = np.meshgrid(np.arange(x_min, x_max, 0.1),
                     np.arange(y_min, y_max, 0.1))

Z = clf.predict(np.c_[xx.ravel(), yy.ravel()])
Z = Z.reshape(xx.shape)

plt.contourf(xx, yy, Z, alpha=0.4)
plt.scatter(X[:, 0], X[:, 1], c=y, alpha=0.8)
plt.show()
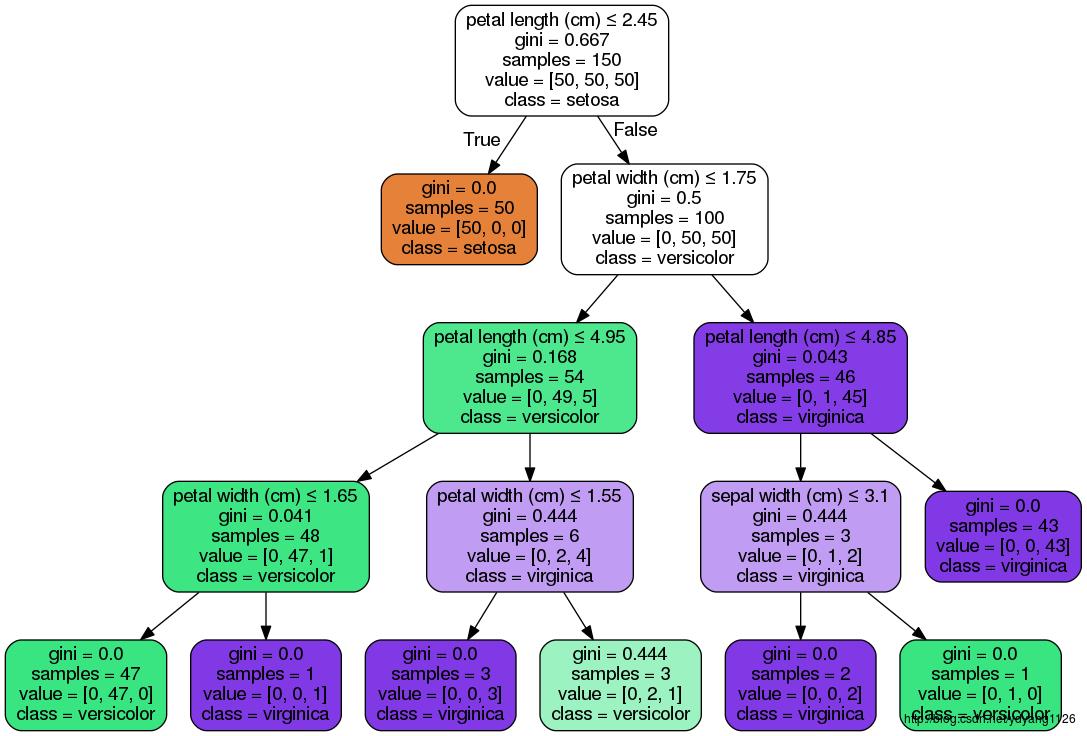
#-*- coding: utf-8 -*-
from itertools import product

import numpy as np
import matplotlib.pyplot as plt

from sklearn import datasets
from sklearn.tree import DecisionTreeClassifier

from IPython.display import Image
from sklearn import tree
import pydotplus
import os
os.environ["PATH"] += os.pathsep + 'G:/program_files/graphviz/bin'

# 仍然使用自带的iris数据
iris = datasets.load_iris()
X = iris.data
y = iris.target

# 训练模型,限制树的最大深度4
clf = DecisionTreeClassifier(max_depth=4)
#拟合模型
clf.fit(X, y)

dot_data = tree.export_graphviz(clf, out_file=None,
                         feature_names=iris.feature_names,
                         class_names=iris.target_names,
                         filled=True, rounded=True,
                         special_characters=True)
graph = pydotplus.graph_from_dot_data(dot_data)
# 使用ipython的终端jupyter notebook显示。
Image(graph.create_png())
# 如果没有ipython的jupyter notebook,可以把此图写到pdf文件里,在pdf文件里查看。
graph.write_pdf("iris.pdf") 
四、 随机森林可视化实例
随机森林是多棵决策树的组合,使用scikit-learn时没有直接的方法显示随机森林,只能拆解成单棵树来显示。
使用随机森林的属性clf.estimators_获取随机森林的决策树列表( 注意,estimators后边有一个下划线 ’ _’ )
#-*- coding: utf-8 -*-
from sklearn import datasets
from sklearn.ensemble import RandomForestClassifier
from IPython.display import Image
from sklearn import tree
import pydotplus
import os
os.environ["PATH"] += os.pathsep + 'G:/program_files/graphviz/bin'

# 仍然使用自带的iris数据
iris = datasets.load_iris()
X = iris.data
y = iris.target

# 训练模型,限制树的最大深度4
clf = RandomForestClassifier(max_depth=4)
#拟合模型
clf.fit(X, y)

Estimators = classifier.estimators_
for index, model in enumerate(Estimators):
    filename = 'iris_' + str(index) + '.pdf'
    dot_data = tree.export_graphviz(model , out_file=None,
                         feature_names=iris.feature_names,
                         class_names=iris.target_names,
                         filled=True, rounded=True,
                         special_characters=True)
    graph = pydotplus.graph_from_dot_data(dot_data)
    # 使用ipython的终端jupyter notebook显示。
    Image(graph.create_png())
    graph.write_pdf(filename)
五、 决策树各特征权重可视化
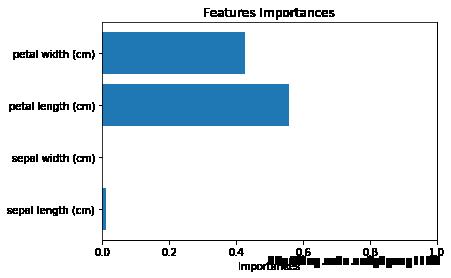
决策树特征权重:即决策树中每个特征单独的分类能力。
#-*- coding: utf-8 -*-
from itertools import product

import numpy as np
import matplotlib.pyplot as plt

from sklearn import datasets
from sklearn.tree import DecisionTreeClassifier

from IPython.display import Image
from sklearn import tree
import pydotplus
import os
os.environ["PATH"] += os.pathsep + 'G:/program_files/graphviz/bin'

# 仍然使用自带的iris数据
iris = datasets.load_iris()
X = iris.data
y = iris.target

# 训练模型,限制树的最大深度4
clf = DecisionTreeClassifier(max_depth=4)
#拟合模型
clf.fit(X, y)

y_importances = clf.feature_importances_
x_importances = iris.feature_names
y_pos = np.arange(len(x_importances))
# 横向柱状图
plt.barh(y_pos, y_importances, align='center')
plt.yticks(y_pos, x_importances)
plt.xlabel('Importances')
plt.xlim(0,1)
plt.title('Features Importances')
plt.show()

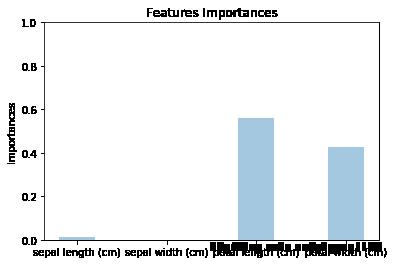
# 竖向柱状图
plt.bar(y_pos, y_importances, width=0.4, align='center', alpha=0.4)
plt.xticks(y_pos, x_importances)
plt.ylabel('Importances')
plt.ylim(0,1)
plt.title('Features Importances')
plt.show()


以上是关于决策树可视化Graphviz中文乱码的主要内容,如果未能解决你的问题,请参考以下文章