Ubuntu Python 安装numpy SciPyMatPlotLib环境
Posted
tags:
篇首语:本文由小常识网(cha138.com)小编为大家整理,主要介绍了Ubuntu Python 安装numpy SciPyMatPlotLib环境相关的知识,希望对你有一定的参考价值。
安装
sudo apt-get install python-scipy
sudo apt-get install python-numpy
sudo apt-get install python-matplotlib
测试
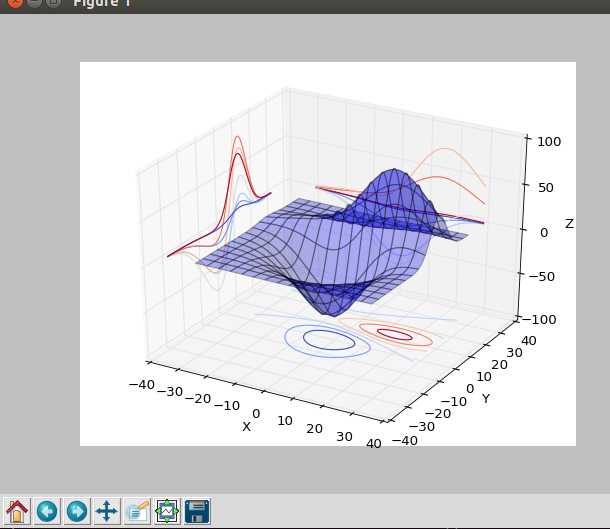
#test plot
from mpl_toolkits.mplot3d import axes3d
import matplotlib.pyplot as plt
from matplotlib import cm

fig = plt.figure()
ax = fig.gca(projection=‘3d‘)
X, Y, Z = axes3d.get_test_data(0.05)
ax.plot_surface(X, Y, Z, rstride=8, cstride=8, alpha=0.3)
cset = ax.contour(X, Y, Z, zdir=‘z‘, offset=-100, cmap=cm.coolwarm)
cset = ax.contour(X, Y, Z, zdir=‘x‘, offset=-40, cmap=cm.coolwarm)
cset = ax.contour(X, Y, Z, zdir=‘y‘, offset=40, cmap=cm.coolwarm)

ax.set_xlabel(‘X‘)
ax.set_xlim(-40, 40)
ax.set_ylabel(‘Y‘)
ax.set_ylim(-40, 40)
ax.set_zlabel(‘Z‘)
ax.set_zlim(-100, 100)

plt.show()


#test numpy
from numpy import *
print random.rand(4,4)


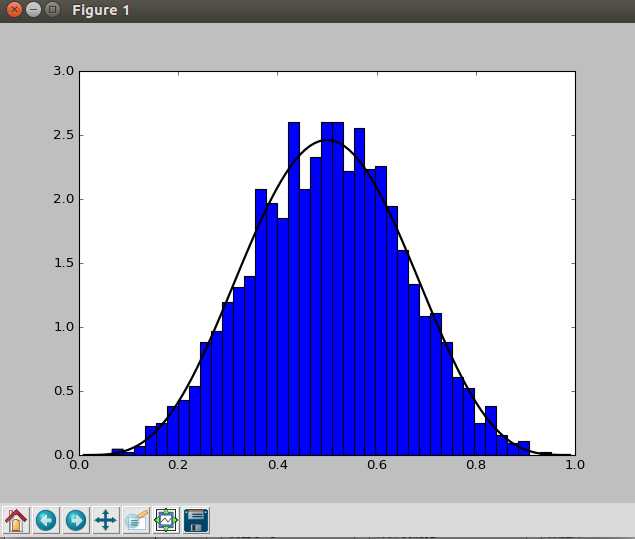
#test scipy
import numpy as np
from scipy.stats import beta
from matplotlib.pyplot import hist, plot, show

obs = beta.rvs(5, 5, size=2000)  # 2000 observations
hist(obs, bins=40, normed=True)
grid = np.linspace(0.01, 0.99, 100)
plot(grid, beta.pdf(grid, 5, 5), ‘k-‘, linewidth=2)
show()

[[ 0.65980666 0.55674039 0.15432447 0.63885279]
[ 0.77583865 0.78290332 0.31575893 0.12678885]
[ 0.67791378 0.86333224 0.97039675 0.95323786]
[ 0.31306339 0.54107452 0.79611926 0.05306962]]

以上是关于Ubuntu Python 安装numpy SciPyMatPlotLib环境的主要内容,如果未能解决你的问题,请参考以下文章
无法在 Python3、Ubuntu14.04 中使用 pip 安装 NumPy
Ubuntu-Python2.7安装 scipy,numpy,matplotlib (转)
Ubuntu-Python2.7安装 scipy,numpy,matplotlib