Phpstorm-Xdebug配置
Posted Ame启风
tags:
篇首语:本文由小常识网(cha138.com)小编为大家整理,主要介绍了Phpstorm-Xdebug配置相关的知识,希望对你有一定的参考价值。
用的是phpstudy集成开发环境
1 xdebug关于Php.ini配置最后写上
php5的
[XDebug]
xdebug.profiler_append = 0
xdebug.profiler_enable = 1
xdebug.profiler_enable_trigger = 0
xdebug.profiler_output_dir="D:\\phpStudy\\tmp\\xdebug"
xdebug.profiler_output_name = "cachegrind.out.%t-%s"
xdebug.remote_enable = 1
xdebug.remote_handler = dbgp
xdebug.remote_host= localhost
xdebug.remote_port = 9000
xdebug.trace_output_dir="D:\\phpStudy\\tmp\\xdebug"
zend_extension="D:\\phpStudy\\php\\php-5.5.38\\ext\\php_xdebug.dll"
xdebug.idekey= PHPSTROM
===============
php7
[XDebug]
xdebug.profiler_append = 0
xdebug.profiler_enable = 1
xdebug.profiler_enable_trigger = 0
xdebug.profiler_output_dir="D:\\phpStudy\\tmp\\xdebug"
xdebug.profiler_output_name = "cachegrind.out.%t-%s"
xdebug.remote_enable = 1
xdebug.remote_handler = dbgp
xdebug.remote_host= localhost
xdebug.remote_port = 9000
xdebug.trace_output_dir="D:\\phpStudy\\tmp\\xdebug"
zend_extension="D:\\phpStudy\\php\\php-7.0.12-nts\\ext\\php_xdebug.dll"
xdebug.idekey= PHPSTROM
记得开启扩展

2 xdebug的配置和php.ini一致

3 xdebug的DBGp配置默认的这些

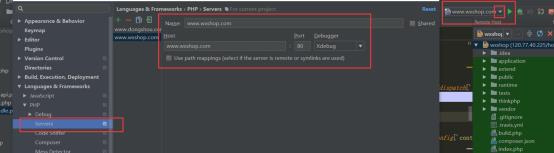
3. xdebug的配置服务2钟方式
一种是在右上角按 配置

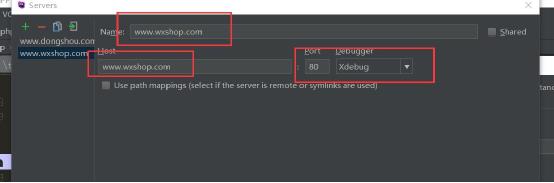

一种是直接在配置里面设置
配置chrom的debug(参考)
http://download.csdn.net/detail/erisern2/9470496
4 xdebug最后
选好右上角的配置,然后设置断点,断点记得一定要选好位置,不要选在空白处,不然无法启动,选在类,函数开头,或者变量位置!!!!!!!!!!!!!!!!!!!启动小蜘蛛就可以了
多个配置则添加多个PHP web Application即可,配置完毕!!
以上是关于Phpstorm-Xdebug配置的主要内容,如果未能解决你的问题,请参考以下文章