pyqtgraph scatter 记录散点图上点的绘制样式
Posted 十橙
tags:
篇首语:本文由小常识网(cha138.com)小编为大家整理,主要介绍了pyqtgraph scatter 记录散点图上点的绘制样式相关的知识,希望对你有一定的参考价值。
date: 2022-08-22 14:23
pyqtgraph scatter 散点图上点的样式
简略总结,symbol 表示形状,pen 画的是边框颜色(鼠标放上去会消失),brush 填充内部颜色。
官方文档ScatterPlotItem — pyqtgraph 0.12.4.dev0 documentation 中对相关参数的一些说明:
| symbol | can be one (or a list) of symbols. For a list of supported symbols, see setSymbol(). QPainterPath is also supported to specify custom symbol shapes. To properly obey the position and size, custom symbols should be centered at (0,0) and width and height of 1.0. Note that it is also possible to ‘install’ custom shapes by setting ScatterPlotItem.Symbols[key] = shape. |
|---|---|
| pen | The pen (or list of pens) to use for drawing spot outlines. |
| brush | The brush (or list of brushes) to use for filling spots. |
我们来尝试修改代码看下效果:
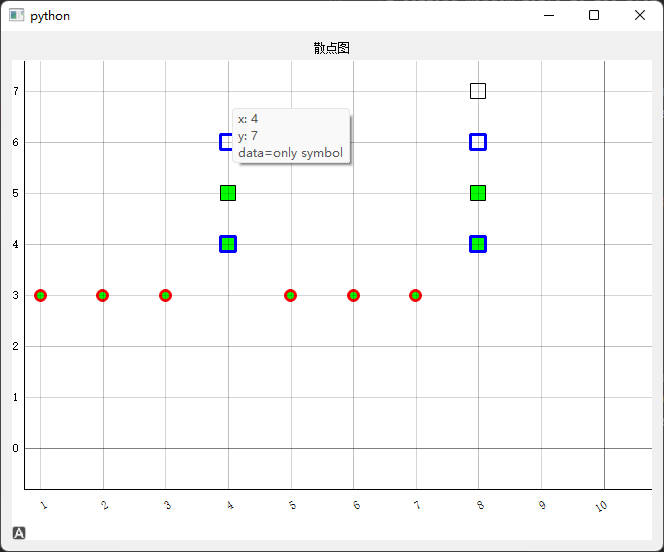
只设置 symbol
‘s’ 是square 的意思,也就是方块,方形。
                spots3.append(
                    'pos': (x0, y0 + 4),
                    'size': 15,
                    # 'pen': pg.mkPen(color=(0, 0, 255), width=3),
                    # 'brush': pg.mkBrush(color=(0, 255, 0)),
                    'symbol': 's',
                    'data': 'only symbol'
                )
下图第一行,只有轮廓,鼠标放上去之后消失了(第一列是鼠标放上去的效果,第二列是原始效果)
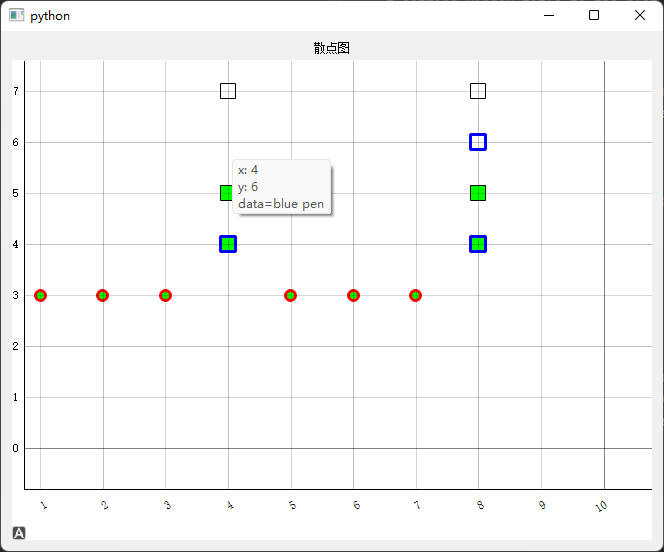
设置 symbol + pen
               spots3.append(
                    'pos': (x0, y0 + 3),
                    'size': 15,
                    'pen': pg.mkPen(color='b', width=3),
                    # 'brush': pg.mkBrush(color=(0, 255, 0)),
                    'symbol': 's',
                    'data': 'blue pen'
                )
下图第二行,pen 画的是边框,鼠标放上去边框还是消失了。
The pen (or list of pens) to use for drawing spot outlines.
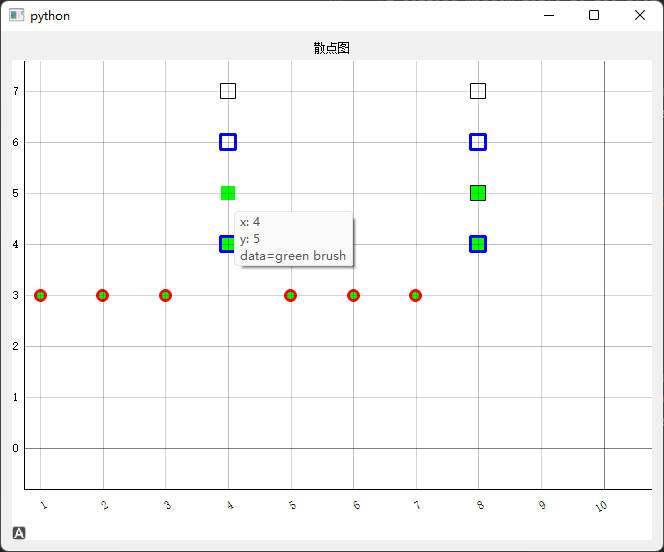
设置 symbol + brush
                spots3.append(
                    'pos': (x0, y0 + 2),
                    'size': 15,
                    # 'pen': pg.mkPen(color=(0, 0, 255), width=3),
                    'brush': pg.mkBrush(color='g'),
                    'symbol': 's',
                    'data': 'green brush'
                )
下图第三行,brush 是用来填充点内部的,鼠标放上去后边框不见了。
The brush (or list of brushes) to use for filling spots.
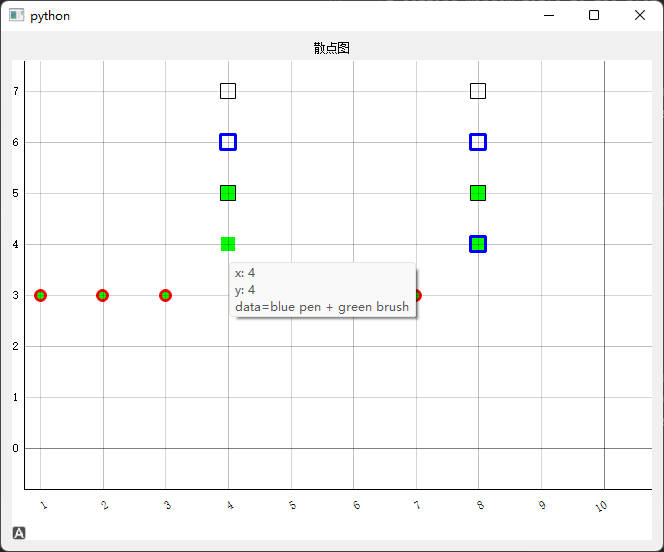
设置 symbol + pen + brush
                spots3.append(
                    'pos': (x0, y0 + 1),
                    'size': 15,
                    'pen': pg.mkPen(color=(0, 0, 255), width=3),
                    'brush': pg.mkBrush(color=(0, 255, 0)),
                    'symbol': 's',
                    'data': 'blue pen + green brush'
                )
下图第四行,边框和内部分别上了不同颜色,鼠标放上去,边框依旧消失。
折线图
如果是折线图的画,会有点和点之间的连线。此时pen 表示的是连线的颜色,而点的样式用symbolpen 表示。
摘取部分[官方文档](PlotDataItem — pyqtgraph 0.12.4.dev0 documentation)上的信息
Line style keyword arguments(线的样式):
| pen | Pen to use for drawing the lines between points. Default is solid grey, 1px width. Use None to disable line drawing. May be a QPen or any single argument accepted by mkPen() |
| fillOutline | (bool) If True, an outline surrounding the fillLevel area is drawn. |
| fillBrush | Fill to use in the fillLevel area. May be any single argument accepted by mkBrush() |
Point style keyword arguments(点的样式):
| symbol | Symbol to use for drawing points, or a list of symbols for each. The default is no symbol. |
| symbolPen | Outline pen for drawing points, or a list of pens, one per point. May be any single argument accepted by mkPen(). |
| symbolBrush | Brush for filling points, or a list of brushes, one per point. May be any single argument accepted by mkBrush(). |
代码:
plot.plot(y=np.random.normal(size=10), pen='g', symbol='s', symbolPen='r', symbolBrush='b', symbolSize=10)
效果
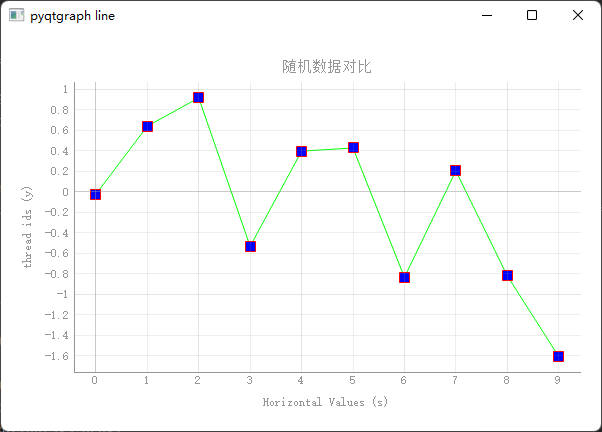
pen 定义线的颜色为g 也就是green(这里其实是pen=pg.mkPen(‘g’)简写了),symbolPen 定义点的边框为红色,symbolBrush 定义点的内部为 蓝色。
以上是关于pyqtgraph scatter 记录散点图上点的绘制样式的主要内容,如果未能解决你的问题,请参考以下文章