MATLAB | 全网最全边际图绘制模板(直方图小提琴图箱线图雨云图散点图... ...)
Posted slandarer
tags:
篇首语:本文由小常识网(cha138.com)小编为大家整理,主要介绍了MATLAB | 全网最全边际图绘制模板(直方图小提琴图箱线图雨云图散点图... ...)相关的知识,希望对你有一定的参考价值。
如标题所言,这应该是全网最全的边际图绘制模板,中心图有8种格式,边际图有11种格式,共计88种组合,另外模板中给了8款配色,我愿称其为888组合,只需要更换一下数据就能绘制出各种类型的边际图:
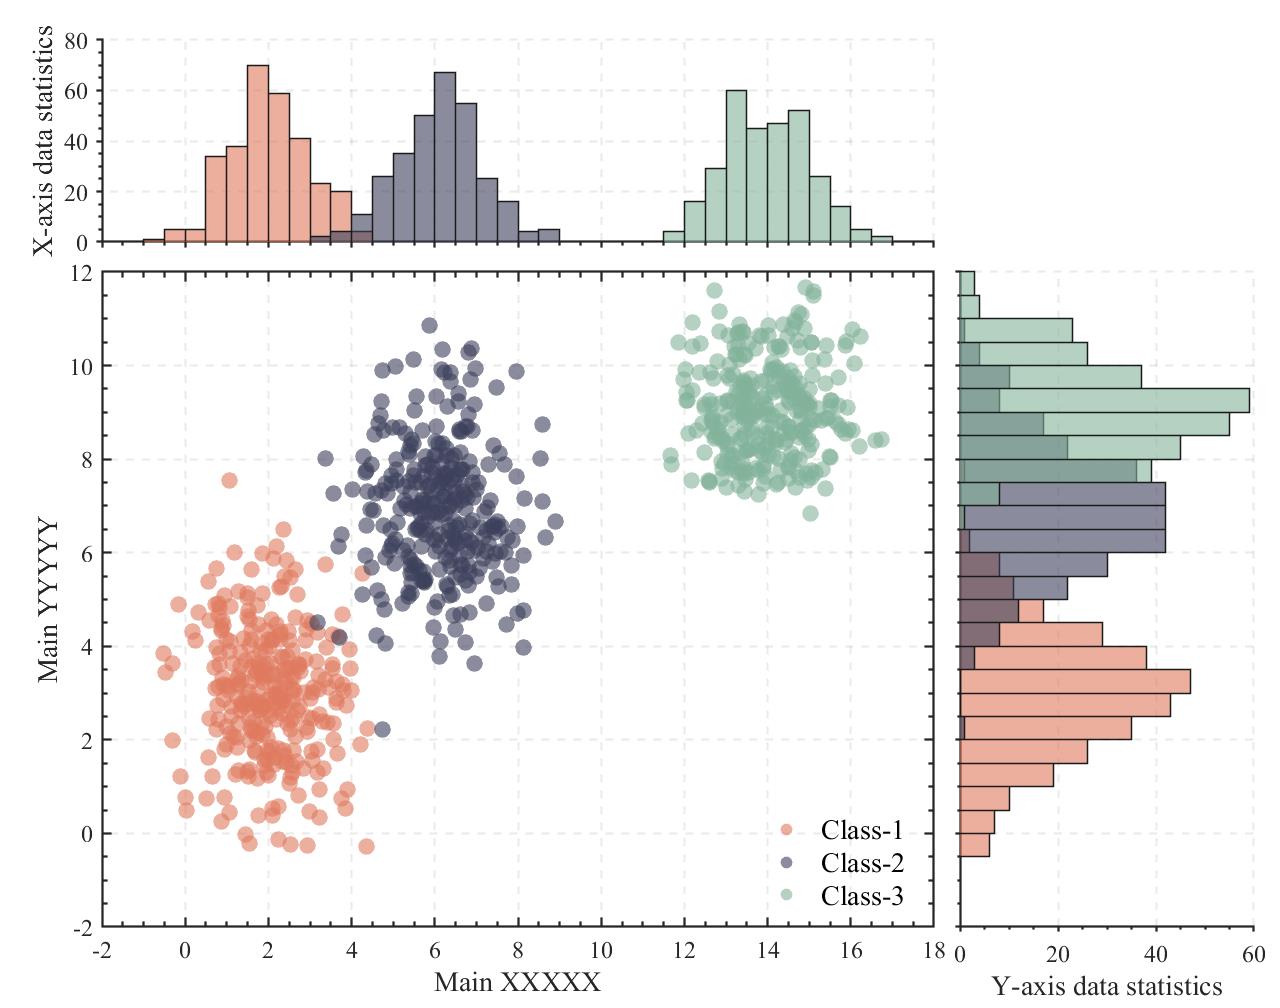
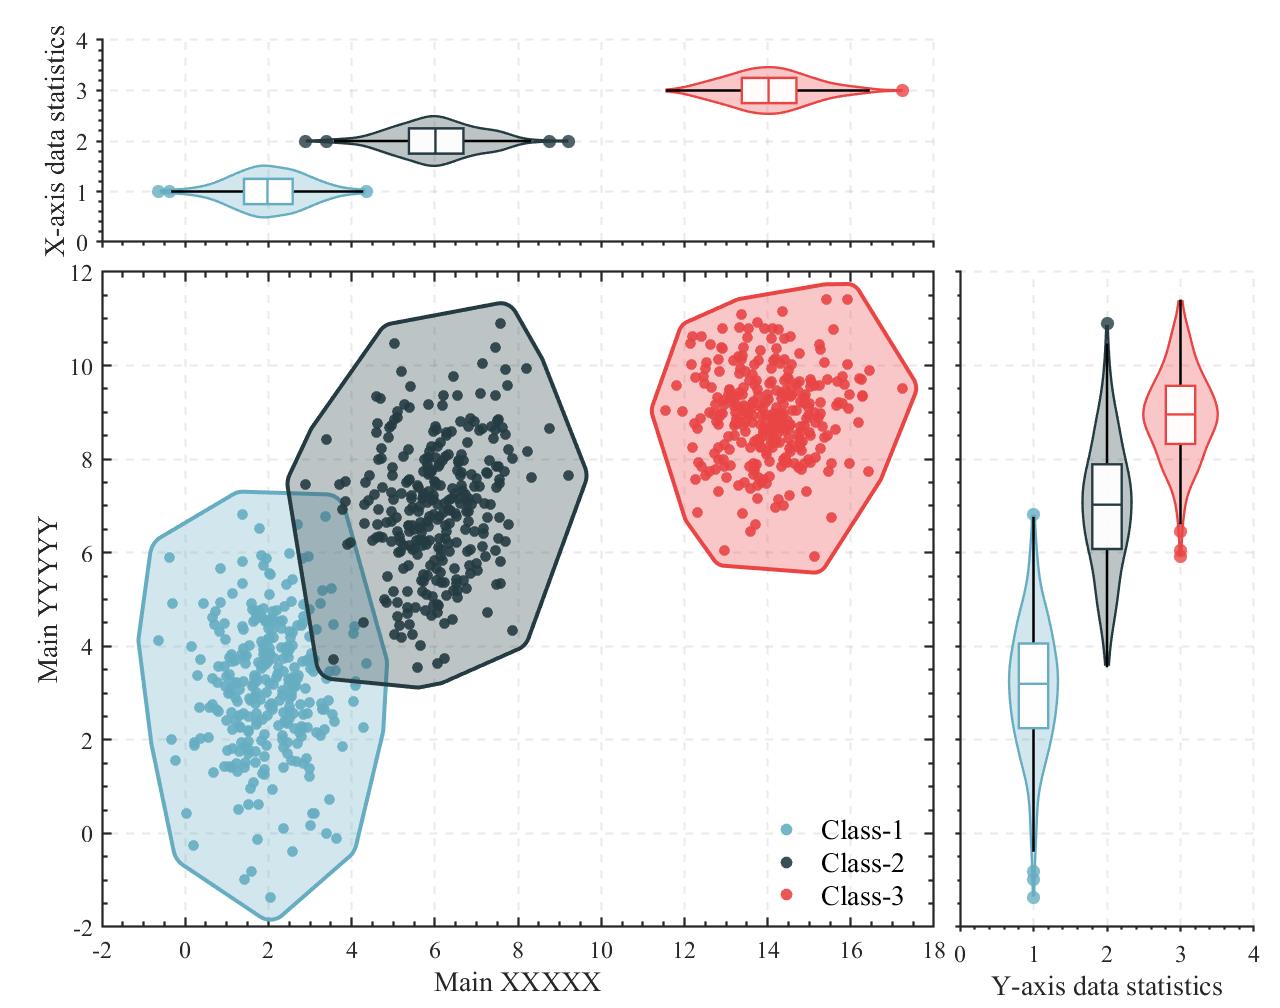
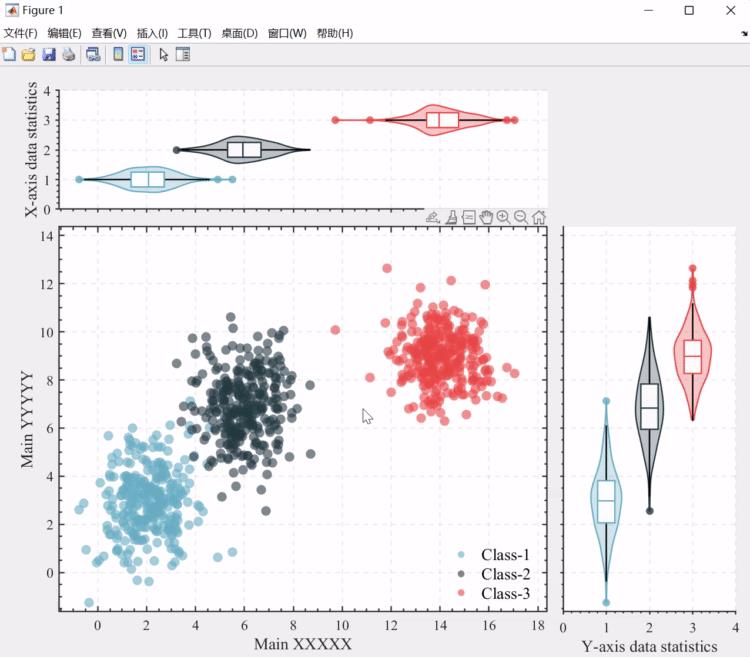
甚至可以随意拖动改变X,Y轴范围:
教程部分
以下代码展示顺序仅为讲解方便,实际顺序请见完整代码部分。
0 数据准备
就每组数据都是两列的数值矩阵,之后放在元胞数组中即可,如下例:
% 构造三个符合高斯分布的点集
PntSet1=mvnrnd([2 3],[1 0;0 2],300);
PntSet2=mvnrnd([6 7],[1 0;0 2],300);
PntSet3=mvnrnd([14 9],[1 0;0 1],300);
% 将数据放进元胞数组
PntSet=PntSet1,PntSet2,PntSet3;
1 坐标区域绘制
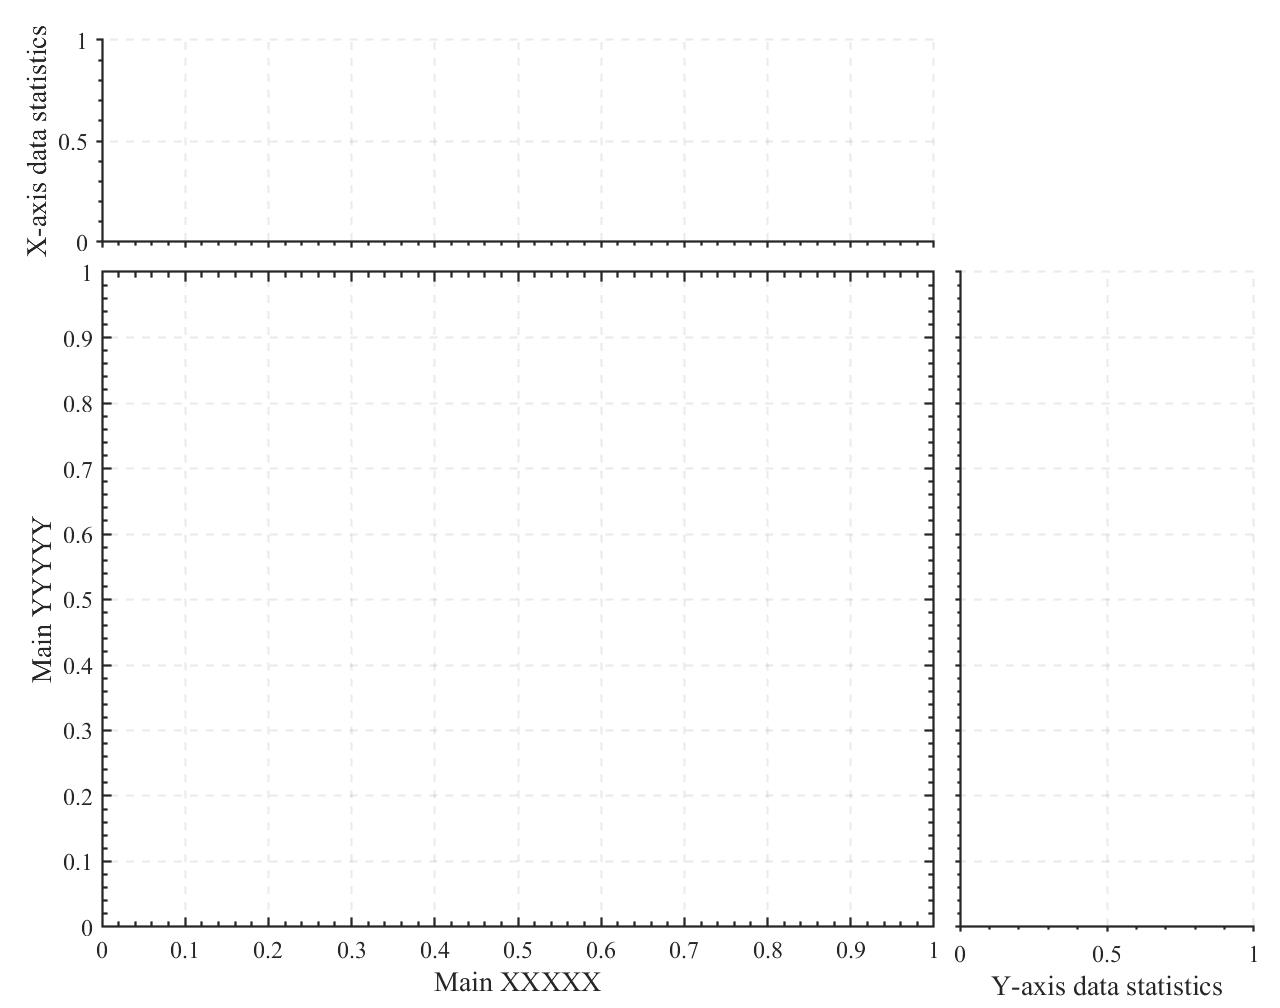
就简单的构造了三个坐标区域,X,Y轴标签啥的都可自行修改:
% figure图床及主要区域axes坐标区域创建及基础修饰
fig=figure('Units','normalized','Position',[.3,.2,.5,.63]);
axM=axes('Parent',fig);hold on;
set(axM,'Position',[.08,.08,.65,.65],'LineWidth',1.1,'Box','on','TickDir','in',...
    'XMinorTick','on','YMinorTick','on','XGrid','on','YGrid','on','GridLineStyle','--',...
    'FontName','Times New Roman','FontSize',12,'GridAlpha',.09)
axM.XLabel.String='Main XXXXX';
axM.YLabel.String='Main YYYYY';
axM.XLabel.FontSize=14;
axM.YLabel.FontSize=14;
% -------------------------------------------------------------------------
% 右侧axes坐标区域创建及基础修饰
axR=axes('Parent',fig);hold on;
set(axR,'Position',[.75,.08,.23,.65],'LineWidth',1.1,'Box','off','TickDir','out',...
    'XMinorTick','on','YMinorTick','on','XGrid','on','YGrid','on','GridLineStyle','--',...
    'FontName','Times New Roman','FontSize',12,'GridAlpha',.09,'TickLength',[.006 .015],'YTickLabel','')
axR.XLabel.String='Y-axis data statistics';
axR.XLabel.FontSize=14;
% -------------------------------------------------------------------------
% 上方axes坐标区域创建及基础修饰
axU=axes('Parent',fig);hold on;
set(axU,'Position',[.08,.76,.65,.2],'LineWidth',1.1,'Box','off','TickDir','out',...
    'XMinorTick','on','YMinorTick','on','XGrid','on','YGrid','on','GridLineStyle','--',...
    'FontName','Times New Roman','FontSize',12,'GridAlpha',.09,'TickLength',[.006 .015],'XTickLabel','')
axU.YLabel.String='X-axis data statistics';
axU.YLabel.FontSize=14;
2 配色
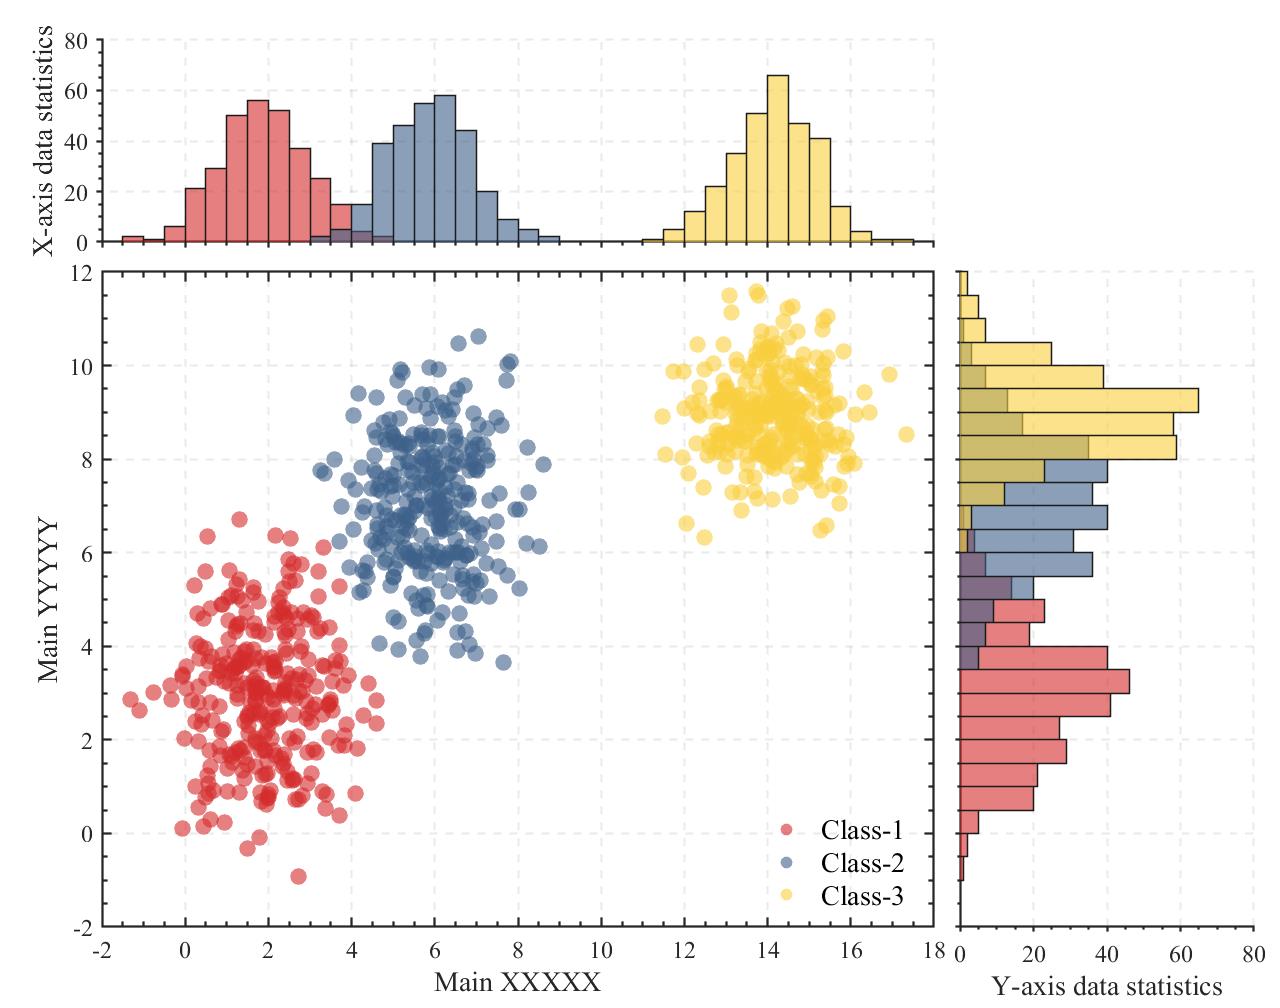
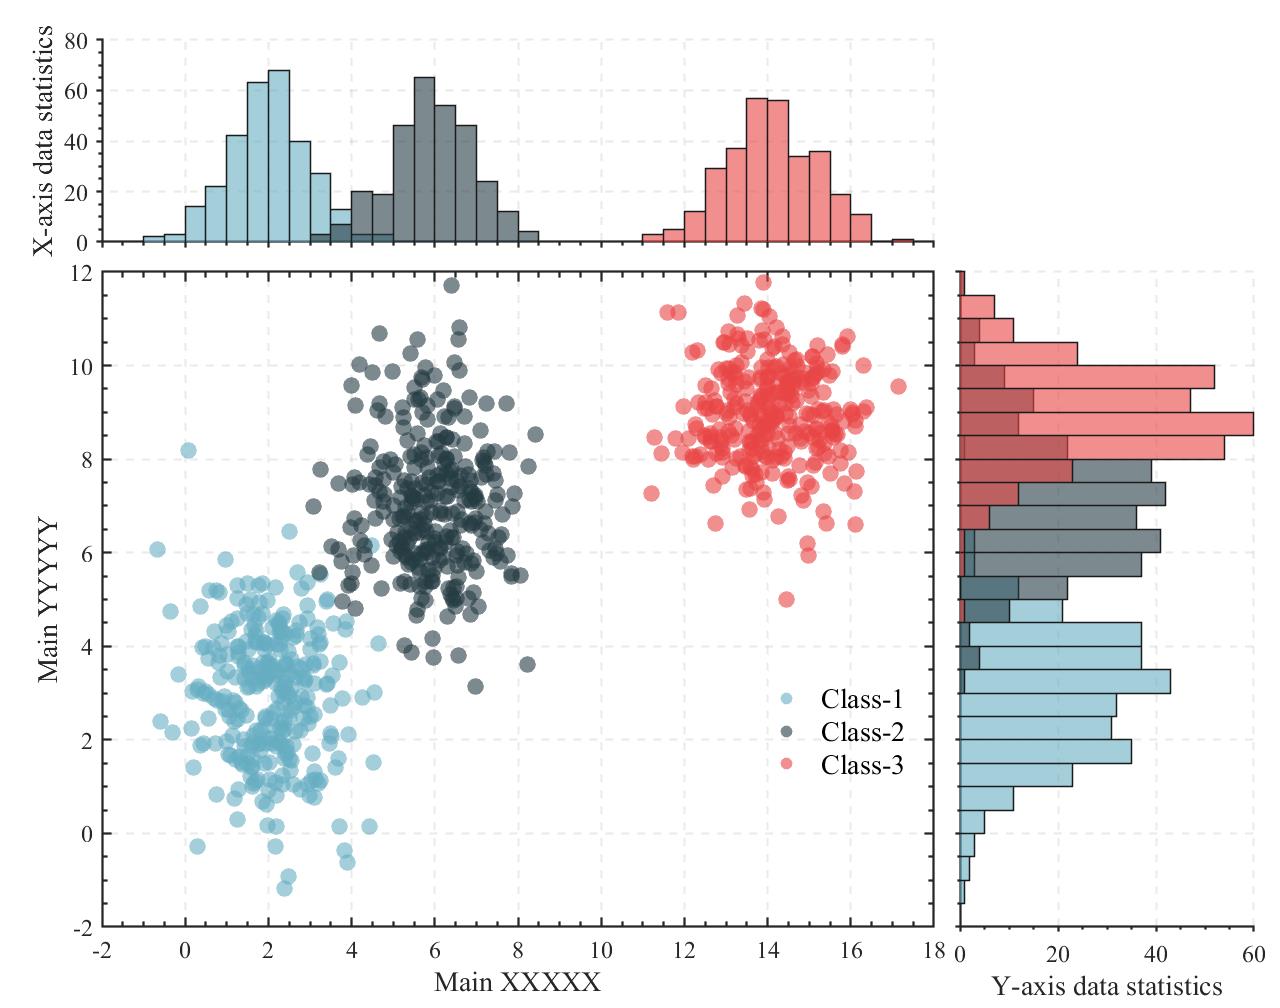
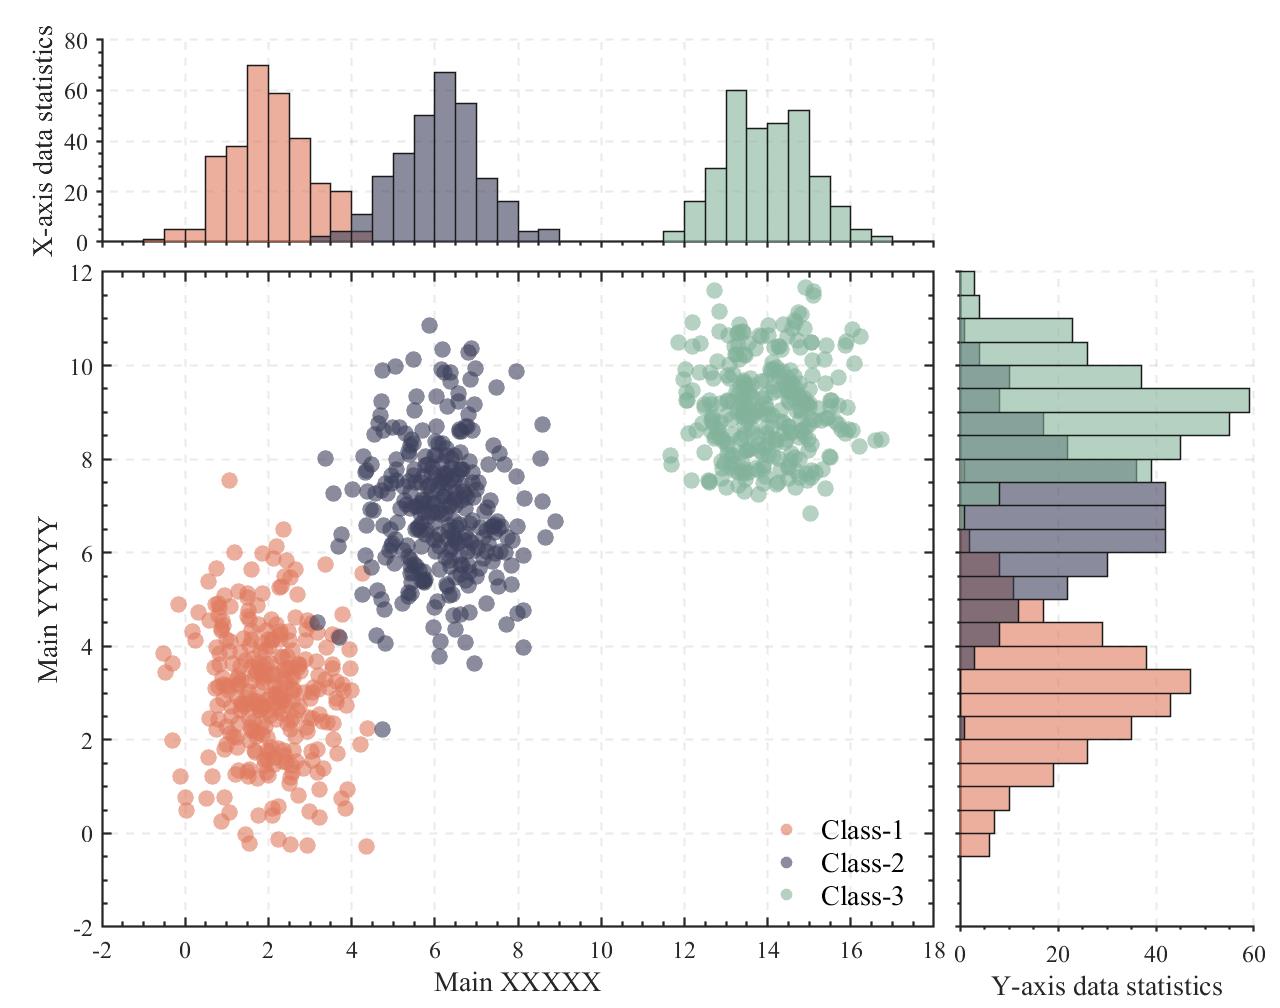
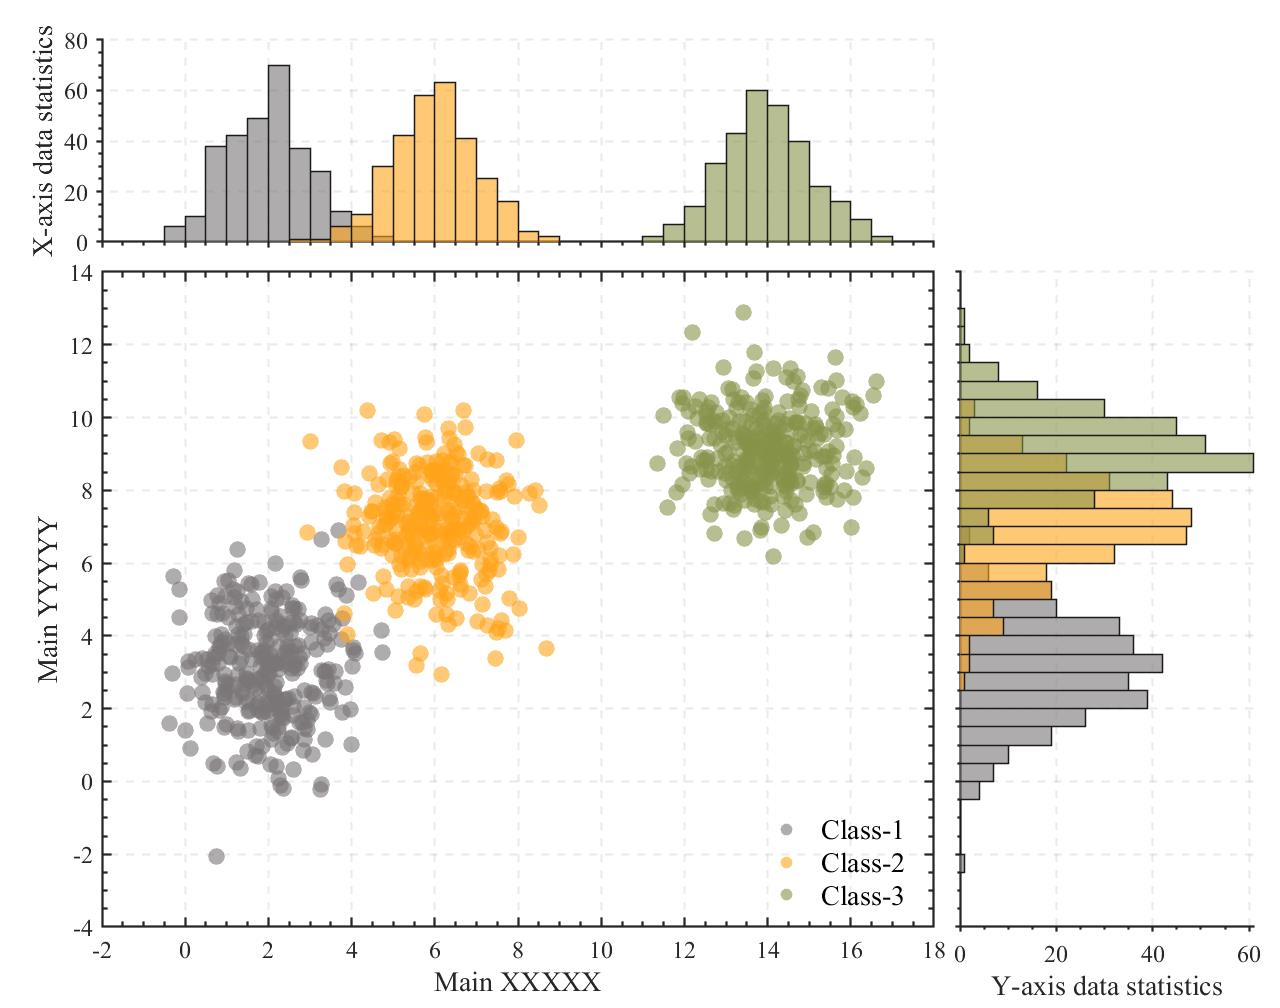
可以自行替换RGB三元组,同时本模板也贴心的提供了八款配色,只需修改:
- colorList=Cn
中n的数值即可:
% 配色预设(here to change the default color list)
C1=[211 43 43;61 96 137;249 206 61;76 103 86;80 80 80]./255;
C2=[102,173,194;36,59,66;232,69,69;194,148,102;54,43,33]./255;
C3=[223,122,94;60 64 91;130 178 154;244,241,222;240 201 134]./255;
C4=[122,117,119;255,163,25;135,146,73;126,15,4;30,93,134]./255;
C5=[198,199,201;38,74,96;209,80,51;241,174,44;12,13,15]./255;
C6=[235,75,55;77,186,216;58,84,141;2,162,136;245,155,122]./255;
C7=[23,23,23;121,17,36;31,80,91;44,9,75;61,36,42]./255;
C8=[47,62,66;203,129,70;0 64 115;152,58,58;20 72 83]./255;
colorList=C2;
以下是配色展示:
C1
C2
C3
C4
C5
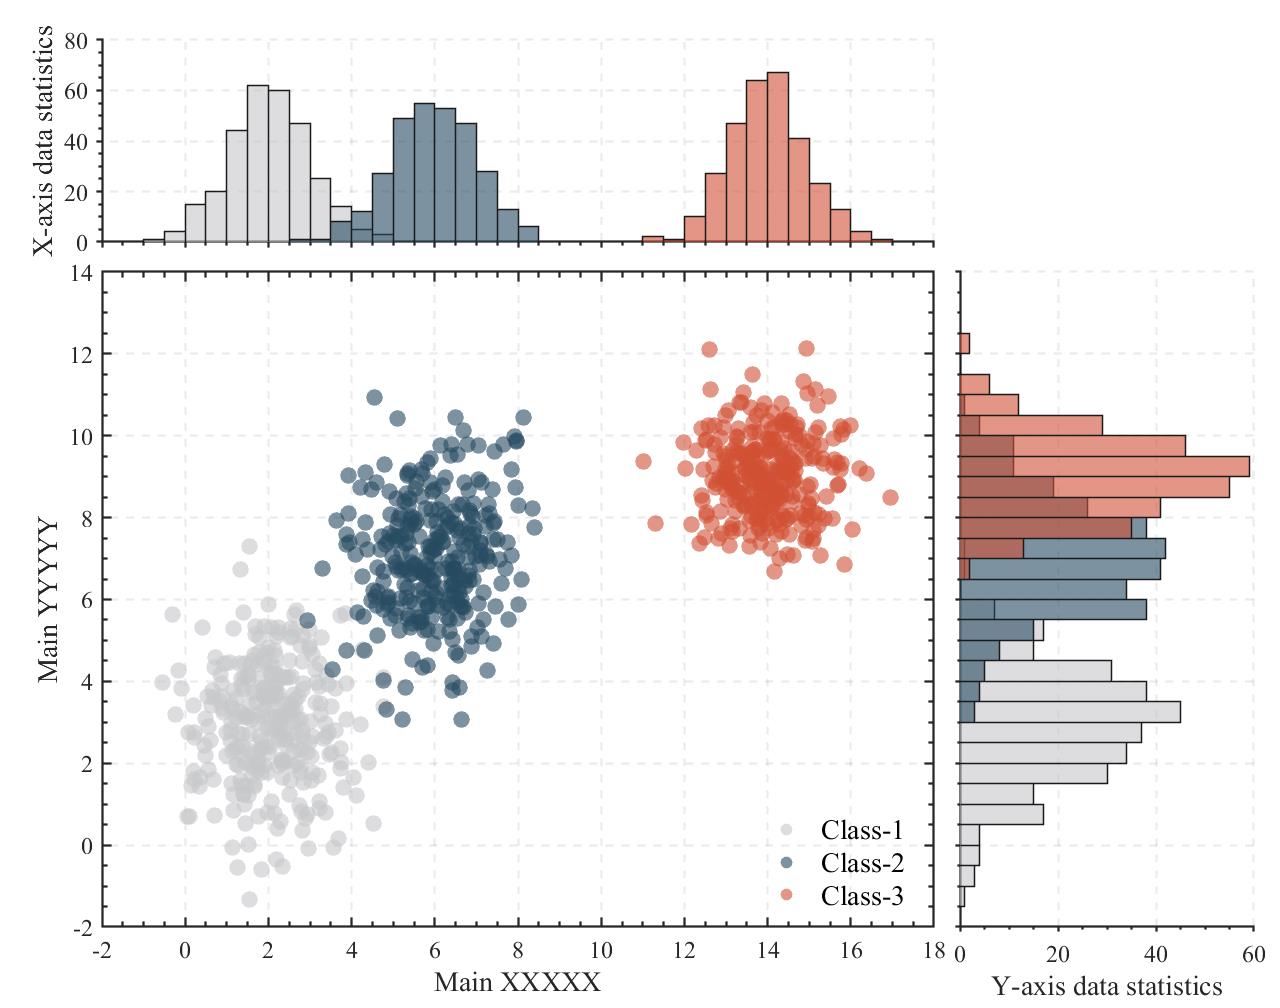
C6
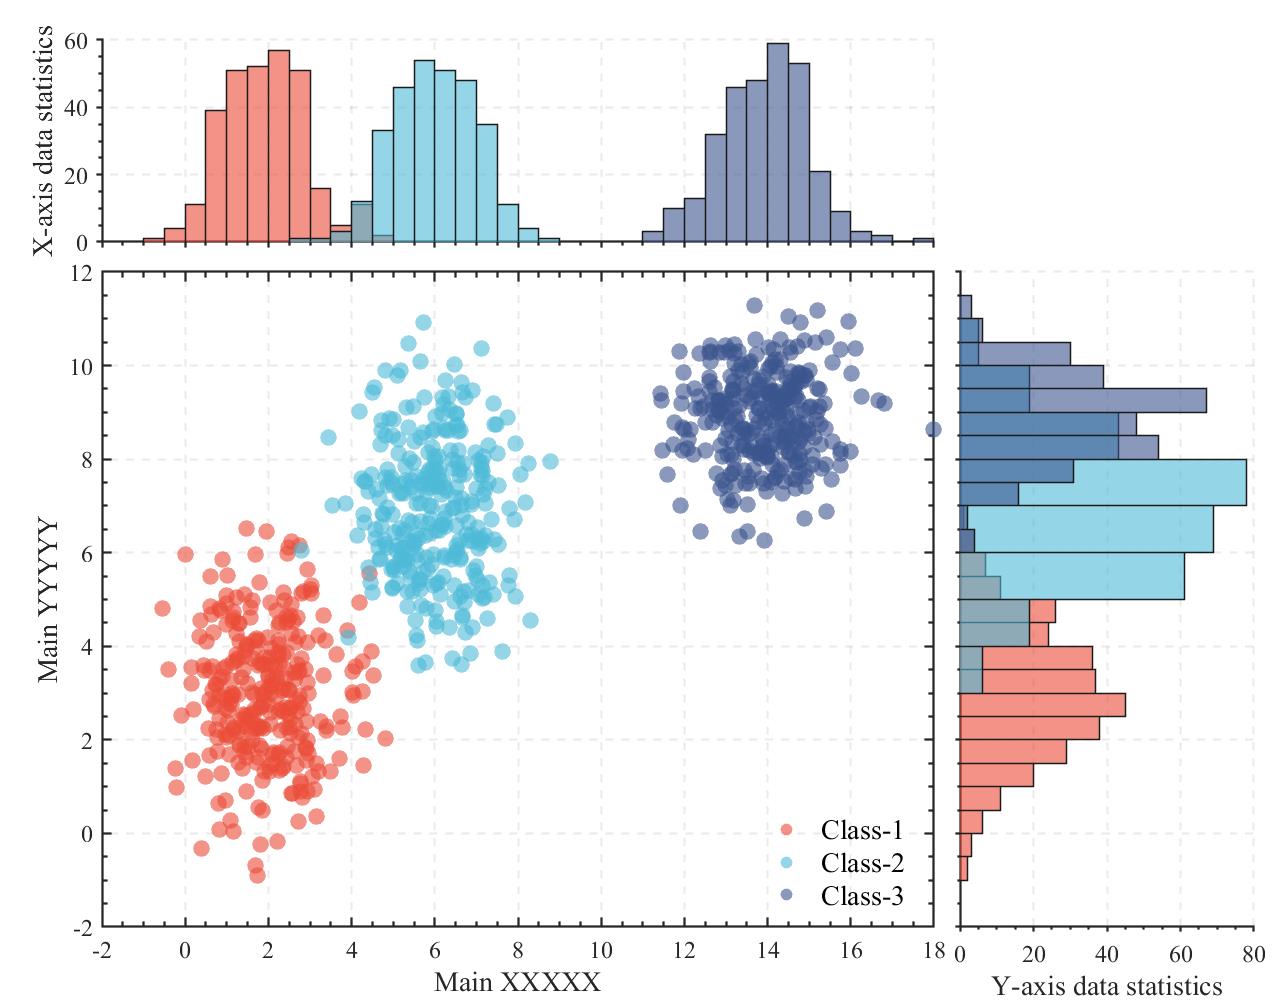
C7
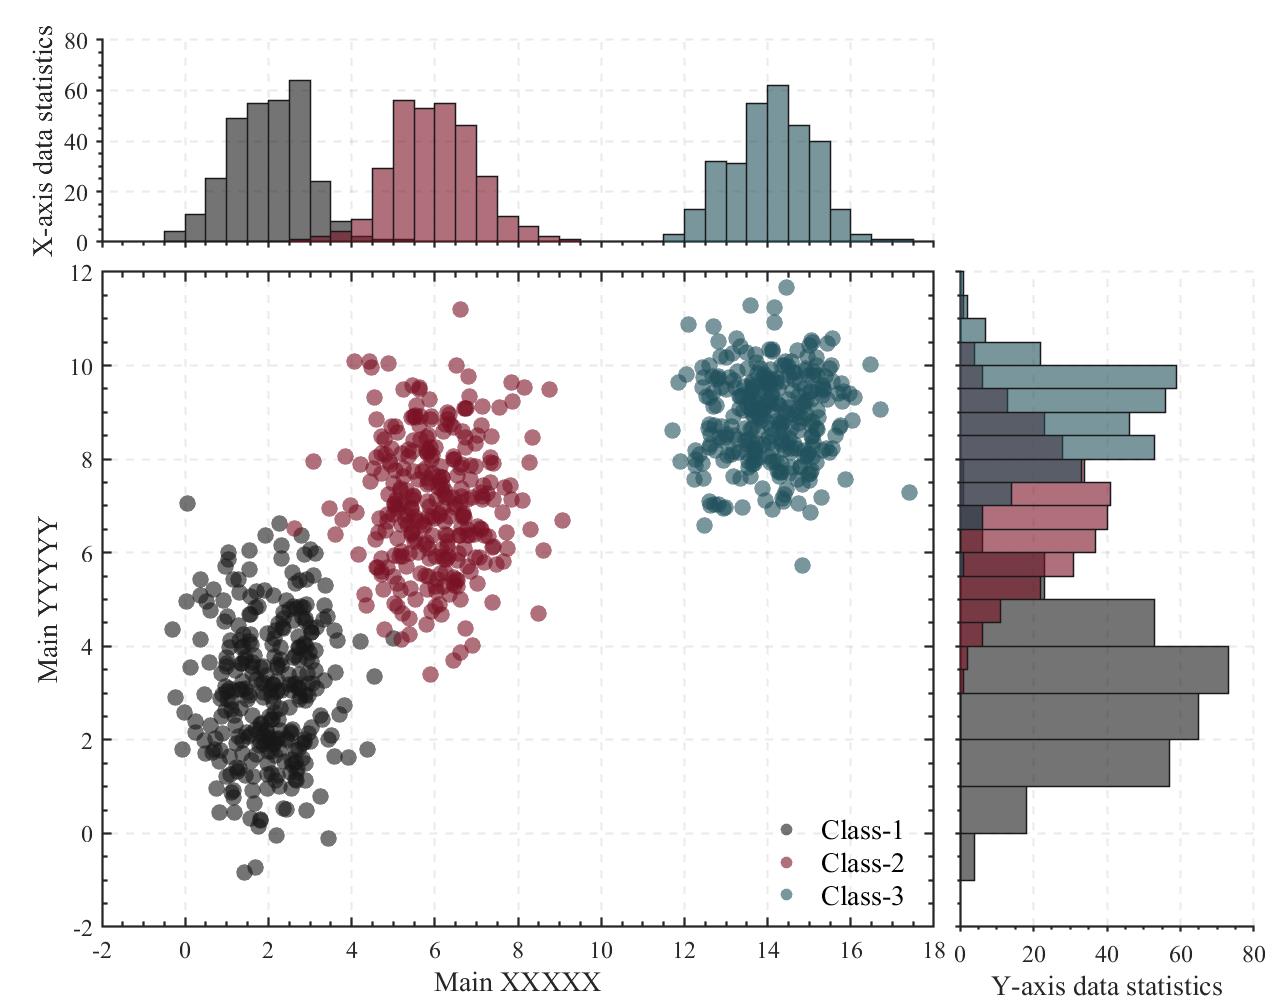
C8
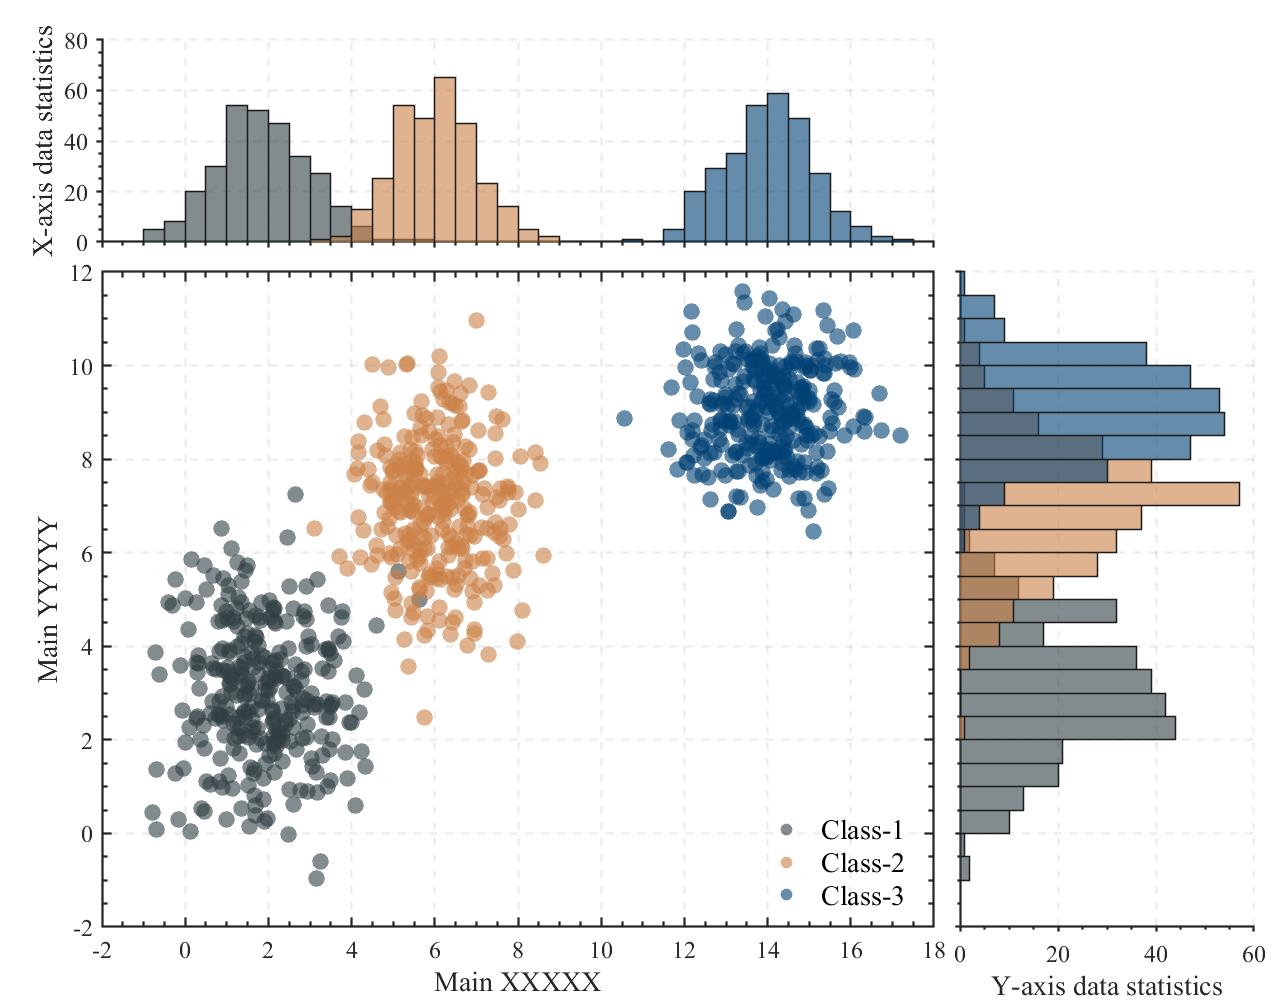
3 绘图格式修改
中心图及边缘图格式可以通过修改:
- mainType
- marginType
俩参数进行修改,mainType为中心图类型,可选1-8,marginType为边际图类型,可选1-11,
% 在这改边缘图及中心图种类
% (here to change the type of marginal plot and main plot)
%    |
%    |
%    |
% \\  |  /
%  \\ | /
%   \\|/
%
mainType=5;
marginType=7;
%
%   /|\\
%  / | \\
% /  |  \\
%    |
%    |
%    |
4 中心图
中心图绘制代码:
% 主要区域散点图绘制
switch mainType
case 1 % 散点图
for i=1:length(PntSet)
tPntSet=PntSeti;
scatter(axM,tPntSet(:,1),tPntSet(:,2),70,'filled','CData',colorList(i,:),'MarkerFaceAlpha',.6)
end
legendStrlength(PntSet)='';
for i=1:length(PntSet)
legendStri=['Class-',num2str(i)];
end
legend(axM,legendStr,'FontSize',14,'Box','off','Location','best');
case 2 % 等高线图
for i=1:length(PntSet)
tPntSet=PntSeti;
gridx1=linspace(min(tPntSet(:,1)),max(tPntSet(:,1)),round(sqrt(size(tPntSet,1))));
gridx2=linspace(min(tPntSet(:,2)),max(tPntSet(:,2)),round(sqrt(size(tPntSet,1))));
[x1,x2]=meshgrid(gridx1, gridx2);
[m,n]=size(x1);
x1=x1(:);
x2=x2(:);
xi=[x1,x2];
h=ksdensity(tPntSet,xi);
contour(axM,reshape(x1,[m,n]),reshape(x2,[m,n]),reshape(h,[m,n]),...
'LineWidth',1.2,'EdgeColor',colorList(i,:))
end
legendStrlength(PntSet)='';
for i=1:length(PntSet)
legendStri=['Class-',num2str(i)];
end
legend(axM,legendStr,'FontSize',14,'Box','off','Location','best');
case 3 % 回归曲线
for i=1:length(PntSet)
tPntSet=PntSeti;
[p,S]=polyfit(tPntSet(:,1),tPntSet(:,2),1);
x1=linspace(min(tPntSet(:,1)),max(tPntSet(:,1)),100);
[y_fit,delta]=polyval(p,x1,S);
% 绘制原始数据、线性拟合和 95% 预测区间 y±2Δ。
uy=y_fit+2.*delta;
dy=y_fit-2.*delta;
% 绘制原始数据
sHdl(i)=scatter(axM,tPntSet(:,1),tPntSet(:,2),30,'filled','CData',colorList(i,:),'MarkerFaceAlpha',.9);
% 绘制拟合曲线
plot(axM,x1,y_fit,'Color',colorList(i,:),'LineWidth',2.5)
% 绘制置信区间
fill(axM,[x1,x1(end:-1:1)],[uy,dy(end:-1:1)],colorList(i,:),'EdgeColor','none','FaceAlpha',.15)
end
legendStrlength(PntSet)='';
for i=1:length(PntSet)
legendStri=['Class-',num2str(i)];
end
legend(axM,sHdl,legendStr,'FontSize',14,'Box','off','Location','best');
case 4 % 散点+凸包
for i=1:length(PntSet)
tPntSet=PntSeti;
[k,av]=convhull(tPntSet);
sHdl(i)=scatter(axM,tPntSet(:,1),tPntSet(:,2),30,'filled','CData',colorList(i,:),'MarkerFaceAlpha',.9);
fill(axM,tPntSet(k,1),tPntSet(k,2),colorList(i,:),'FaceAlpha',0.3,'EdgeColor',colorList(i,:),'LineWidth',2)
end
legendStrlength(PntSet)='';
for i=1:length(PntSet)
legendStri=['Class-',num2str(i)];
end
legend(axM,sHdl,legendStr,'FontSize',14,'Box','off','Location','best');
case 5 % 散点+不规则图形
for i=1:length(PntSet)
tPntSet=PntSeti;
sHdl(i)=scatter(axM,tPntSet(:,1),tPntSet(:,2),30,'filled','CData',colorList(i,:),'MarkerFaceAlpha',.9);
R=max(max(tPntSet(: