使用k8s v1.14.3安装部署EFK日志收集系统
Posted ~~~~~~~~~~~~~~
tags:
篇首语:本文由小常识网(cha138.com)小编为大家整理,主要介绍了使用k8s v1.14.3安装部署EFK日志收集系统相关的知识,希望对你有一定的参考价值。
EFK日志收集系统包含3个组件: elasticsearch、fluentd、kibana
本次环境如下:
| Master:192.168.88.145 2C4G node1:192.168.88.148 2C4G node2:192.168.88.150 2C2G |
直接上yaml文件(在根据github/kubernetes上进行布署,遇到些问题,下面yaml文件已均做修改):
-
elasticsearch
es-statefulset.yaml:
文件中KUBERNETES_SERVICE_HOST变量的值请自行修改为k8s master节点IP地址。
volumes部分生产环境请使用PVC或storageclass做持久化数据存储。
# RBAC authn and authz
apiVersion: v1
kind: ServiceAccount
metadata:
  name: elasticsearch-logging
  namespace: kube-system
  labels:
    k8s-app: elasticsearch-logging
    addonmanager.kubernetes.io/mode: Reconcile
---
kind: ClusterRole
apiVersion: rbac.authorization.k8s.io/v1
metadata:
  name: elasticsearch-logging
  labels:
    k8s-app: elasticsearch-logging
    addonmanager.kubernetes.io/mode: Reconcile
rules:
- apiGroups:
  - ""
  resources:
  - "services"
  - "namespaces"
  - "endpoints"
  verbs:
  - "get"
---
kind: ClusterRoleBinding
apiVersion: rbac.authorization.k8s.io/v1
metadata:
  namespace: kube-system
  name: elasticsearch-logging
  labels:
    k8s-app: elasticsearch-logging
    addonmanager.kubernetes.io/mode: Reconcile
subjects:
- kind: ServiceAccount
  name: elasticsearch-logging
  namespace: kube-system
  apiGroup: ""
roleRef:
  kind: ClusterRole
  name: elasticsearch-logging
  apiGroup: ""
---
# Elasticsearch deployment itself
apiVersion: apps/v1
kind: StatefulSet
metadata:
  name: elasticsearch-logging
  namespace: kube-system
  labels:
    k8s-app: elasticsearch-logging
    version: v7.4.2
    addonmanager.kubernetes.io/mode: Reconcile
spec:
  serviceName: elasticsearch-logging
  replicas: 2
  selector:
    matchLabels:
      k8s-app: elasticsearch-logging
      version: v7.4.2
  template:
    metadata:
      labels:
        k8s-app: elasticsearch-logging
        version: v7.4.2
    spec:
      serviceAccountName: elasticsearch-logging
      containers:
      - image: quay.io/fluentd_elasticsearch/elasticsearch:v7.4.2
        name: elasticsearch-logging
        imagePullPolicy: Always
        resources:
          # need more cpu upon initialization, therefore burstable class
          limits:
            cpu: 1000m
            memory: 3Gi
          requests:
            cpu: 100m
            memory: 3Gi
        ports:
        - containerPort: 9200
          name: db
          protocol: TCP
        - containerPort: 9300
          name: transport
          protocol: TCP
#        livenessProbe:
#          tcpSocket:
#            port: transport
#          initialDelaySeconds: 5
#          timeoutSeconds: 10
#        readinessProbe:
#          tcpSocket:
#            port: transport
#          initialDelaySeconds: 5
#          timeoutSeconds: 10
        volumeMounts:
        - name: elasticsearch-logging
          mountPath: /data
        env:
        - name: "NAMESPACE"
          valueFrom:
            fieldRef:
              fieldPath: metadata.namespace
        - name: KUBERNETES_SERVICE_HOST
          value: "192.168.88.145"
        - name: KUBERNETES_SERVICE_PORT
          value: "6443"
      volumes:
      - name: elasticsearch-logging
        emptyDir:
      # Elasticsearch requires vm.max_map_count to be at least 262144.
      # If your OS already sets up this number to a higher value, feel free
      # to remove this init container.
      initContainers:
      - image: alpine:3.6
        command: ["/sbin/sysctl", "-w", "vm.max_map_count=262144"]
        name: elasticsearch-logging-init
        securityContext:
          privileged: true
es-service.yaml:
apiVersion: v1
kind: Service
metadata:
  name: elasticsearch-logging
  namespace: kube-system
  labels:
    k8s-app: elasticsearch-logging
    kubernetes.io/cluster-service: "true"
    addonmanager.kubernetes.io/mode: Reconcile
    kubernetes.io/name: "Elasticsearch"
spec:
  ports:
  - port: 9200
    protocol: TCP
    targetPort: db
  selector:
    k8s-app: elasticsearch-logging
2. fluentd
fluentd-es-ds.yaml如下:
apiVersion: v1
kind: ServiceAccount
metadata:
  name: fluentd-es
  namespace: kube-system
  labels:
    k8s-app: fluentd-es
    addonmanager.kubernetes.io/mode: Reconcile
---
kind: ClusterRole
apiVersion: rbac.authorization.k8s.io/v1
metadata:
  name: fluentd-es
  labels:
    k8s-app: fluentd-es
    addonmanager.kubernetes.io/mode: Reconcile
rules:
- apiGroups:
  - ""
  resources:
  - "namespaces"
  - "pods"
  verbs:
  - "get"
  - "watch"
  - "list"
---
kind: ClusterRoleBinding
apiVersion: rbac.authorization.k8s.io/v1
metadata:
  name: fluentd-es
  labels:
    k8s-app: fluentd-es
    addonmanager.kubernetes.io/mode: Reconcile
subjects:
- kind: ServiceAccount
  name: fluentd-es
  namespace: kube-system
  apiGroup: ""
roleRef:
  kind: ClusterRole
  name: fluentd-es
  apiGroup: ""
---
apiVersion: apps/v1
kind: DaemonSet
metadata:
  name: fluentd-es-v3.0.2
  namespace: kube-system
  labels:
    k8s-app: fluentd-es
    version: v3.0.2
    addonmanager.kubernetes.io/mode: Reconcile
spec:
  selector:
    matchLabels:
      k8s-app: fluentd-es
      version: v3.0.2
  template:
    metadata:
      labels:
        k8s-app: fluentd-es
        version: v3.0.2
      # This annotation ensures that fluentd does not get evicted if the node
      # supports critical pod annotation based priority scheme.
      # Note that this does not guarantee admission on the nodes (#40573).
      annotations:
        seccomp.security.alpha.kubernetes.io/pod: 'docker/default'
    spec:
      priorityClassName: system-node-critical
      serviceAccountName: fluentd-es
      containers:
      - name: fluentd-es
        image: quay.io/fluentd_elasticsearch/fluentd:v3.0.2
        env:
        - name: FLUENTD_ARGS
          value: --no-supervisor -q
        resources:
          limits:
            memory: 500Mi
          requests:
            cpu: 100m
            memory: 200Mi
        volumeMounts:
        - name: varlog
          mountPath: /var/log
        - name: varlibdockercontainers
          mountPath: /var/lib/docker/containers
          readOnly: true
        - name: config-volume
          mountPath: /etc/fluent/config.d
        ports:
        - containerPort: 24231
          name: prometheus
          protocol: TCP
        livenessProbe:
          tcpSocket:
            port: prometheus
          initialDelaySeconds: 5
          timeoutSeconds: 10
        readinessProbe:
          tcpSocket:
            port: prometheus
          initialDelaySeconds: 5
          timeoutSeconds: 10
      terminationGracePeriodSeconds: 30
      volumes:
      - name: varlog
        hostPath:
          path: /var/log
      - name: varlibdockercontainers
        hostPath:
          path: /var/lib/docker/containers
      - name: config-volume
        configMap:
          name: fluentd-es-config-v0.2.0
fluentd-es-configmap.yaml:
kind: ConfigMap
apiVersion: v1
metadata:
  name: fluentd-es-config-v0.2.0
  namespace: kube-system
  labels:
    addonmanager.kubernetes.io/mode: Reconcile
data:
  system.conf: |-
    <system>
      root_dir /tmp/fluentd-buffers/
    </system>

  containers.input.conf: |-

    <source>
      @id fluentd-containers.log
      @type tail
      path /var/log/containers/*.log
      pos_file /var/log/es-containers.log.pos
      tag raw.kubernetes.*
      read_from_head true
      <parse>
        @type multi_format
        <pattern>
          format json
          time_key time
          time_format %Y-%m-%dT%H:%M:%S.%NZ
        </pattern>
        <pattern>
          format /^(?<time>.+) (?<stream>stdout|stderr) [^ ]* (?<log>.*)$/
          time_format %Y-%m-%dT%H:%M:%S.%N%:z
        </pattern>
      </parse>
    </source>

    <match raw.kubernetes.**>
      @id raw.kubernetes
      @type detect_exceptions
      remove_tag_prefix raw
      message log
      stream stream
      multiline_flush_interval 5
      max_bytes 500000
      max_lines 1000
    </match>

    <filter **>
      @id filter_concat
      @type concat
      key message
      multiline_end_regexp /\\n$/
      separator ""
    </filter>

    <filter kubernetes.**>
      @id filter_kubernetes_metadata
      @type kubernetes_metadata
    </filter>

    <filter kubernetes.**>
      @id filter_parser
      @type parser
      key_name log
      reserve_data true
      remove_key_name_field true
      <parse>
        @type multi_format
        <pattern>
          format json
        </pattern>
        <pattern>
          format none
        </pattern>
      </parse>
    </filter>

  system.input.conf: |-
    <source>
      @id minion
      @type tail
      format /^(?<time>[^ ]* [^ ,]*)[^\\[]*\\[[^\\]]*\\]\\[(?<severity>[^ \\]]*) *\\] (?<message>.*)$/
      time_format %Y-%m-%d %H:%M:%S
      path /var/log/salt/minion
      pos_file /var/log/salt.pos
      tag salt
    </source>

    <source>
      @id startupscript.log
      @type tail
      format syslog
      path /var/log/startupscript.log
      pos_file /var/log/es-startupscript.log.pos
      tag startupscript
    </source>

    <source>
      @id docker.log
      @type tail
      format /^time="(?<time>[^"]*)" level=(?<severity>[^ ]*) msg="(?<message>[^"]*)"( err="(?<error>[^"]*)")?( statusCode=($<status_code>\\d+))?/
      path /var/log/docker.log
      pos_file /var/log/es-docker.log.pos
      tag docker
    </source>

    <source>
      @id etcd.log
      @type tail
      format none
      path /var/log/etcd.log
      pos_file /var/log/es-etcd.log.pos
      tag etcd
    </source>


    <source>
      @id kubelet.log
      @type tail
      format multiline
      multiline_flush_interval 5s
      format_firstline /^\\w\\d4/
      format1 /^(?<severity>\\w)(?<time>\\d4 [^\\s]*)\\s+(?<pid>\\d+)\\s+(?<source>[^ \\]]+)\\] (?<message>.*)/
      time_format %m%d %H:%M:%S.%N
      path /var/log/kubelet.log
      pos_file /var/log/es-kubelet.log.pos
      tag kubelet
    </source>

    <source>
      @id kube-proxy.log
      @type tail
      format multiline
      multiline_flush_interval 5s
      format_firstline /^\\w\\d4/
      format1 /^(?<severity>\\w)(?<time>\\d4 [^\\s]*)\\s+(?<pid>\\d+)\\s+(?<source>[^ \\]]+)\\] (?<message>.*)/
      time_format %m%d %H:%M:%S.%N
      path /var/log/kube-proxy.log
      pos_file /var/log/es-kube-proxy.log.pos
      tag kube-proxy
    </source>

    <source>
      @id kube-apiserver.log
      @type tail
      format multiline
      multiline_flush_interval 5s
      format_firstline /^\\w\\d4/
      format1 /^(?<severity>\\w)(?<time>\\d4 [^\\s]*)\\s+(?<pid>\\d+)\\s+(?<source>[^ \\]]+)\\] (?<message>.*)/
      time_format %m%d %H:%M:%S.%N
      path /var/log/kube-apiserver.log
      pos_file /var/log/es-kube-apiserver.log.pos
      tag kube-apiserver
    </source>

    <source>
      @id kube-controller-manager.log
      @type tail
      format multiline
      multiline_flush_interval 5s
      format_firstline /^\\w\\d4/
      format1 /^(?<severity>\\w)(?<time>\\d4 [^\\s]*)\\s+(?<pid>\\d+)\\s+(?<source>[^ \\]]+)\\] (?<message>.*)/
      time_format %m%d %H:%M:%S.%N
      path /var/log/kube-controller-manager.log
      pos_file /var/log/es-kube-controller-manager.log.pos
      tag kube-controller-manager
    </source>

    <source>
      @id kube-scheduler.log
      @type tail
      format multiline
      multiline_flush_interval 5s
      format_firstline /^\\w\\d4/
      format1 /^(?<severity>\\w)(?<time>\\d4 [^\\s]*)\\s+(?<pid>\\d+)\\s+(?<source>[^ \\]]+)\\] (?<message>.*)/
      time_format %m%d %H:%M:%S.%N
      path /var/log/kube-scheduler.log
      pos_file /var/log/es-kube-scheduler.log.pos
      tag kube-scheduler
    </source>

    <source>
      @id glbc.log
      @type tail
      format multiline
      multiline_flush_interval 5s
      format_firstline /^\\w\\d4/
      format1 /^(?<severity>\\w)(?<time>\\d4 [^\\s]*)\\s+(?<pid>\\d+)\\s+(?<source>[^ \\]]+)\\] (?<message>.*)/
      time_format %m%d %H:%M:%S.%N
      path /var/log/glbc.log
      pos_file /var/log/es-glbc.log.pos
      tag glbc
    </source>

    <source>
      @id cluster-autoscaler.log
      @type tail
      format multiline
      multiline_flush_interval 5s
      format_firstline /^\\w\\d4/
      format1 /^(?<severity>\\w)(?<time>\\d4 [^\\s]*)\\s+(?<pid>\\d+)\\s+(?<source>[^ \\]]+)\\] (?<message>.*)/
      time_format %m%d %H:%M:%S.%N
      path /var/log/cluster-autoscaler.log
      pos_file /var/log/es-cluster-autoscaler.log.pos
      tag cluster-autoscaler
    </source>

    <source>
      @id journald-docker
      @type systemd
      matches [ "_SYSTEMD_UNIT": "docker.service" ]
      <storage>
        @type local
        persistent true
        path /var/log/journald-docker.pos
      </storage>
      read_from_head true
      tag docker
    </source>

    <source>
      @id journald-container-runtime
      @type systemd
      matches [ "_SYSTEMD_UNIT": " fluentd_container_runtime_service .service" ]
      <storage>
        @type local
        persistent true
        path /var/log/journald-container-runtime.pos
      </storage>
      read_from_head true
      tag container-runtime
    </source>

    <source>
      @id journald-kubelet
      @type systemd
      matches [ "_SYSTEMD_UNIT": "kubelet.service" ]
      <storage>
        @type local
        persistent true
        path /var/log/journald-kubelet.pos
      </storage>
      read_from_head true
      tag kubelet
    </source>

    <source>
      @id journald-node-problem-detector
      @type systemd
      matches [ "_SYSTEMD_UNIT": "node-problem-detector.service" ]
      <storage>
        @type local
        persistent true
        path /var/log/journald-node-problem-detector.pos
      </storage>
      read_from_head true
      tag node-problem-detector
    </source>

    <source>
      @id kernel
      @type systemd
      matches [ "_TRANSPORT": "kernel" ]
      <storage>
        @type local
        persistent true
        path /var/log/kernel.pos
      </storage>
      <entry>
        fields_strip_underscores true
        fields_lowercase true
      </entry>
      read_from_head true
      tag kernel
    </source>

  forward.input.conf: |-
    <source>
      @id forward
      @type forward
    </source>

  monitoring.conf: |-
    <source>
      @id prometheus
      @type prometheus
    </source>

    <source>
      @id monitor_agent
      @type monitor_agent
    </source>

    <source>
      @id prometheus_monitor
      @type prometheus_monitor
      <labels>
        host $hostname
      </labels>
    </source>

    <source>
      @id prometheus_output_monitor
      @type prometheus_output_monitor
      <labels>
        host $hostname
      </labels>
    </source>

    <source>
      @id prometheus_tail_monitor
      @type prometheus_tail_monitor
      <labels>
        host $hostname
      </labels>
    </source>

  output.conf: |-
    <match **>
      @id elasticsearch
      @type elasticsearch
      @log_level info
      type_name _doc
      include_tag_key true
      host elasticsearch-logging
      port 9200
      logstash_format true
      <buffer>
        @type file
        path /var/log/fluentd-buffers/kubernetes.system.buffer
        flush_mode interval
        retry_type exponential_backoff
        flush_thread_count 2
        flush_interval 5s
        retry_forever
        retry_max_interval 30
        chunk_limit_size 2M
        total_limit_size 500M
        overflow_action block
      </buffer>
    </match>
3. kibana
kibana-deployment.yaml :
apiVersion: apps/v1
kind: Deployment
metadata:
  name: kibana-logging
  namespace: kube-system
  labels:
    k8s-app: kibana-logging
    addonmanager.kubernetes.io/mode: Reconcile
spec:
  replicas: 1
  selector:
    matchLabels:
      k8s-app: kibana-logging
  template:
    metadata:
      labels:
        k8s-app: kibana-logging
      annotations:
        seccomp.security.alpha.kubernetes.io/pod: 'docker/default'
    spec:
      containers:
      - name: kibana-logging
        image: docker.elastic.co/kibana/kibana-oss:7.2.0
#         image: hekai/docker.elastic.co_kibana_kibana_7.4.2
        resources:
          # need more cpu upon initialization, therefore burstable class
          limits:
            cpu: 1000m
          requests:
            cpu: 100m
        env:
          - name: ELASTICSEARCH_HOSTS
            value: http://elasticsearch-logging:9200
          - name: SERVER_NAME
            value: kibana-logging
#          - name: SERVER_BASEPATH
#            value: /api/v1/namespaces/kube-system/services/kibana-logging/proxy
          - name: SERVER_REWRITEBASEPATH
            value: "false"
        ports:
        - containerPort: 5601
          name: ui
          protocol: TCP
        livenessProbe:
          httpGet:
            path: /api/status
            port: ui
          initialDelaySeconds: 5
          timeoutSeconds: 10
        readinessProbe:
          httpGet:
            path: /api/status
            port: ui
          initialDelaySeconds: 5
          timeoutSeconds: 10
kibana-service.yaml:
apiVersion: v1
kind: Service
metadata:
  name: kibana-logging
  namespace: kube-system
  labels:
    k8s-app: kibana-logging
    kubernetes.io/cluster-service: "true"
    addonmanager.kubernetes.io/mode: Reconcile
    kubernetes.io/name: "Kibana"
spec:
  type: NodePort

  ports:
  - port: 5601
#    port: 5601
    protocol: TCP
    targetPort: ui
  selector:
    k8s-app: kibana-logging
部署完成后最终状态如下:
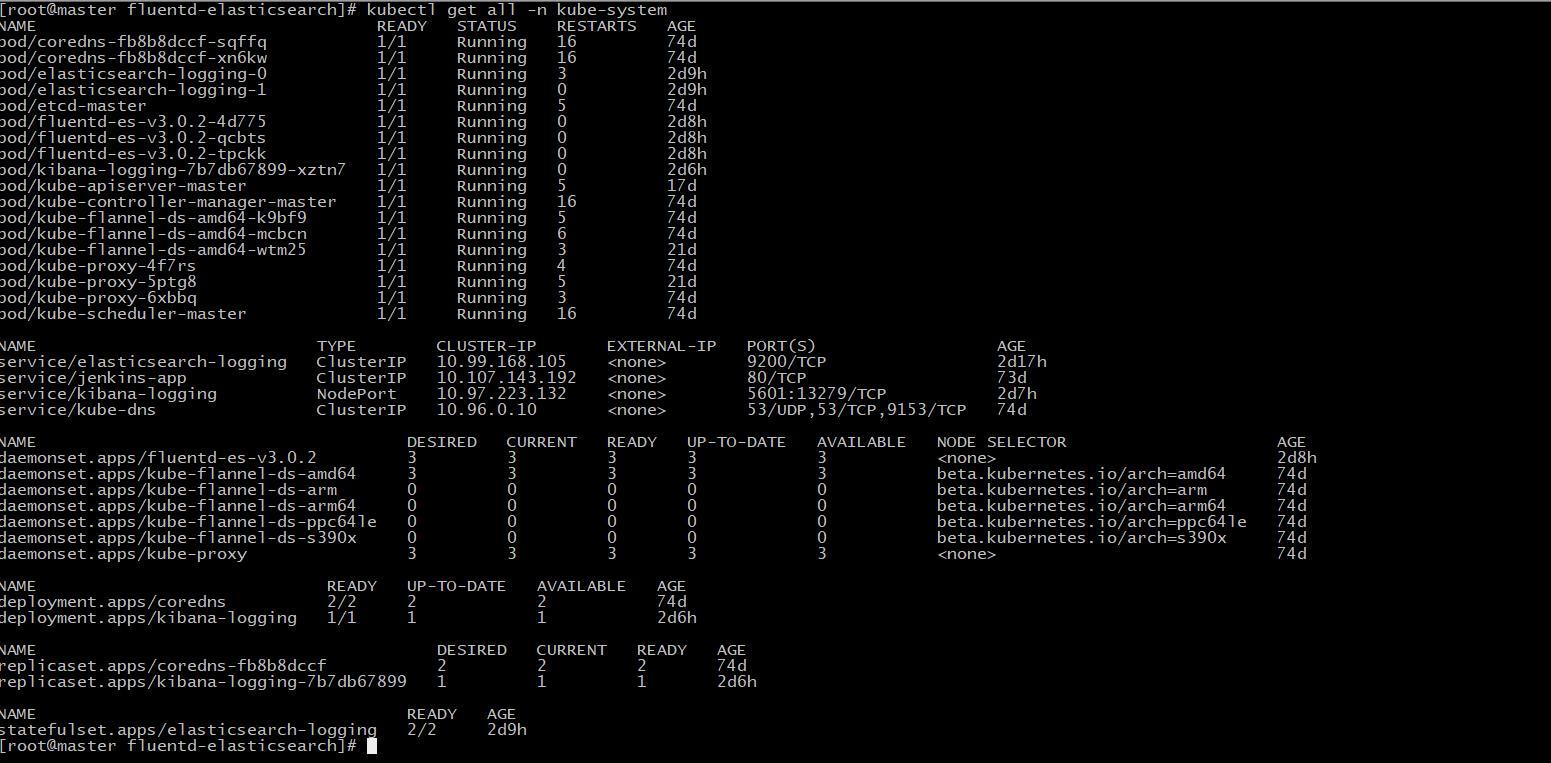
查看到service对外暴露kibana Node端口号为13279,使用Node节点IP地址加端口号访问即可。


以上是关于使用k8s v1.14.3安装部署EFK日志收集系统的主要内容,如果未能解决你的问题,请参考以下文章