Pandas教程(非常详细)
Posted 小熊coder
tags:
篇首语:本文由小常识网(cha138.com)小编为大家整理,主要介绍了Pandas教程(非常详细)相关的知识,希望对你有一定的参考价值。
文章目录
- Pandas是什么
- Pandas库下载和安装
- Pandas Series入门教程
- Pandas DataFrame入门教程(图解版)
- Pandas Panel三维数据结构
- Python Pandas描述性统计
- Python Pandas绘图教程(详解版)
- Pandas csv读写文件
- Pandas Excel读写操作详解
- Pandas和NumPy的比较
转载于: http://c.biancheng.net/pandas/
Pandas 库是一个免费、开源的第三方 Python 库,是 Python 数据分析必不可少的工具之一,它为 Python 数据分析提供了高性能,且易于使用的数据结构,即 Series 和 DataFrame。Pandas 自诞生后被应用于众多的领域,比如金融、统计学、社会科学、建筑工程等。
Pandas 库基于 Python NumPy 库开发而来,因此,它可以与 Python 的科学计算库配合使用。Pandas 提供了两种数据结构,分别是 Series(一维数组结构)与 DataFrame(二维数组结构),这两种数据结构极大地增强的了 Pandas 的数据分析能力。在本套教程中,我们将学习 Python Pandas 的各种方法、特性以及如何在实践中运用它们。
教程特点
本套教程是为 Pandas 初学者打造的,学习完本套教程,您将在一定程度上掌握 Pandas 的基础知识,以及各种功能。如果您是从事数据分析的工作人员,那么这套教程会对您有所帮助。
本套教程对 Python Pandas 库进行详细地讲解,包括文件读写、统计学函数、缺失值处理、以及数据可视化等重点知识。为了降低初学者的学习门槛,我们的教程尽量采用通俗易懂、深入浅出的语言风格,相信通过对本套教程的学习,您一定会收获颇丰。
阅读条件
在开始学习本套教程前,首先您应该对于数据分析、数据可视化的概念有一定程度的了解,并且您已经熟练掌握 Python 语言的基础知识。其次,由于 Pandas 库是在 NumPy 库的基础上构建而来,所以建议您提前学习《Python NumPy教程》。
Pandas是什么
Pandas 是一个开源的第三方 Python 库,从 Numpy 和 Matplotlib 的基础上构建而来,享有数据分析“三剑客之一”的盛名(NumPy、Matplotlib、Pandas)。Pandas 已经成为 Python 数据分析的必备高级工具,它的目标是成为强大、灵活、可以支持任何编程语言的数据分析工具。

图1:Pandas Logo
Pandas 这个名字来源于面板数据(Panel Data)与数据分析(data analysis)这两个名词的组合。在经济学中,Panel Data 是一个关于多维数据集的术语。Pandas 最初被应用于金融量化交易领域,现在它的应用领域更加广泛,涵盖了农业、工业、交通等许多行业。
Pandas 最初由 Wes McKinney(韦斯·麦金尼)于 2008 年开发,并于 2009 年实现开源。目前,Pandas 由 PyData 团队进行日常的开发和维护工作。在 2020 年 12 月,PyData 团队公布了最新的 Pandas 1.20 版本 。
在 Pandas 没有出现之前,Python 在数据分析任务中主要承担着数据采集和数据预处理的工作,但是这对数据分析的支持十分有限,并不能突出 Python 简单、易上手的特点。Pandas 的出现使得 Python 做数据分析的能力得到了大幅度提升,它主要实现了数据分析的五个重要环节:
- 加载数据
- 整理数据
- 操作数据
- 构建数据模型
- 分析数据
Pandas主要特点
Pandas 主要包括以下几个特点:
- 它提供了一个简单、高效、带有默认标签(也可以自定义标签)的 DataFrame 对象。
- 能够快速得从不同格式的文件中加载数据(比如 Excel、CSV 、SQL文件),然后将其转换为可处理的对象;
- 能够按数据的行、列标签进行分组,并对分组后的对象执行聚合和转换操作;
- 能够很方便地实现数据归一化操作和缺失值处理;
- 能够很方便地对 DataFrame 的数据列进行增加、修改或者删除的操作;
- 能够处理不同格式的数据集,比如矩阵数据、异构数据表、时间序列等;
- 提供了多种处理数据集的方式,比如构建子集、切片、过滤、分组以及重新排序等。
上述知识点将在后续学习中为大家一一讲解。
Pandas主要优势
与其它语言的数据分析包相比,Pandas 具有以下优势:
- Pandas 的 DataFrame 和 Series 构建了适用于数据分析的存储结构;
- Pandas 简洁的 API 能够让你专注于代码的核心层面;
- Pandas 实现了与其他库的集成,比如 Scipy、scikit-learn 和 Matplotlib;
- Pandas 官方网站(点击访问)提供了完善资料支持,及其良好的社区环境。
Pandas内置数据结构
我们知道,构建和处理二维、多维数组是一项繁琐的任务。Pandas 为解决这一问题, 在 ndarray 数组(NumPy 中的数组)的基础上构建出了两种不同的数据结构,分别是 Series(一维数据结构)DataFrame(二维数据结构):
- Series 是带标签的一维数组,这里的标签可以理解为索引,但这个索引并不局限于整数,它也可以是字符类型,比如 a、b、c 等;
- DataFrame 是一种表格型数据结构,它既有行标签,又有列标签。
下面对上述数据结构做简单地的说明:
| 数据结构 | 维度 | 说明 |
|---|---|---|
| Series | 1 | 该结构能够存储各种数据类型,比如字符数、整数、浮点数、Python 对象等,Series 用 name 和 index 属性来描述 数据值。Series 是一维数据结构,因此其维数不可以改变。 |
| DataFrame | 2 | DataFrame 是一种二维表格型数据的结构,既有行索引,也有列索引。行索引是 index,列索引是 columns。 在创建该结构时,可以指定相应的索引值。 |
由于上述数据结构的存在,使得处理多维数组数任务变的简单。在《Pandas Series入门教程》和《Pandas DataFrame入门教程(图解)》两节中,我们会对上述数据结构做详细讲解。
注意,在 Pandas 0.25 版本后,Pamdas 废弃了 Panel 数据结构,如果感兴趣可阅读《Pandas Panel三维数据结构》一节。
Pandas库下载和安装
Python 官方标准发行版并没有自带 Pandas 库,因此需要另行安装。除了标准发行版外,还有一些第三方机构发布的 Python 免费发行版, 它们在官方版本的基础上开发而来,并有针对性的提前安装了一些 Python 模块,从而满足某些特定领域的需求,比如专门适应于科学计算领域的 Anaconda,它就提前安装了多款适用于科学计算的软件包。
对于第三方发行版而言,它们已经自带 Pandas 库,所以无须另行安装。下面介绍了常用的免费发行版:
-
Anaconda(官网下载:https://www.anaconda.com/)是一个开源的 Python 发行版,包含了 180 多个科学包及其依赖项。除了支持 Windows 系统外,也支持 Linux 和 Mac 系统。
-
Python(x,y)(下载地址:https://python-xy.github.io/)是一款基于 Python、Qt (图形用户界面)和 Spyder (交互式开发环境)开发的软件,主要用于数值计算、数据分析和数据可视化等工程项目,目前只支持 Python 2 版本。
-
WinPython(下载地址:https://sourceforge.net/projects/winpython/files/)一个免费的 Python 发行版,包含了常用的科学计算包与 Spyder IDE,但仅支持 Windows 系统。
下面介绍在不同操作系统环境下,标准发行版安装 Pandas 的方法。
Windows系统安装
使用 pip 包管理器安装 Pandas,是最简单的一种安装方式。在 CMD 命令提示符界面行执行以下命令:
pip install pandas
Linux系统安装
对于不同的版本的 Linux 系统,您可以采用它们各自的包管理器来安装 Pandas。
1) Ubuntu用户
Pandas 通常需要与其他软件包一起使用,因此可采用以下命令,一次性安装所有包:
sudo apt-get install numpy scipy matplotlib pandas
2) Fedora用户
对于 Fedora 用户而言,可采用以下命令安装:
sudo yum install numpy scipy matplotlib pandas
MacOSX系统安装
对于 Mac 用户而言,同样可以直接使用 pip 包管理器来安装,命令如下:
pip install pandas
Pandas Series入门教程
Series 结构,也称 Series 序列,是 Pandas 常用的数据结构之一,它是一种类似于一维数组的结构,由一组数据值(value)和一组标签组成,其中标签与数据值之间是一一对应的关系。
Series 可以保存任何数据类型,比如整数、字符串、浮点数、Python 对象等,它的标签默认为整数,从 0 开始依次递增。Series 的结构图,如下所示:
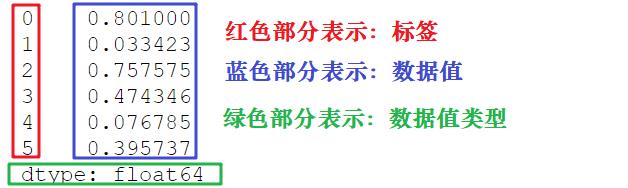
通过标签我们可以更加直观地查看数据所在的索引位置。
创建Series对象
Pandas 使用 Series() 函数来创建 Series 对象,通过这个对象可以调用相应的方法和属性,从而达到处理数据的目的:
import pandas as pd
s=pd.Series( data, index, dtype, copy)
参数说明如下所示:
| 参数名称 | 描述 |
|---|---|
| data | 输入的数据,可以是列表、常量、ndarray 数组等。 |
| index | 索引值必须是惟一的,如果没有传递索引,则默认为 np.arrange(n)。 |
| dtype | dtype表示数据类型,如果没有提供,则会自动判断得出。 |
| copy | 表示对 data 进行拷贝,默认为 False。 |
我们也可以使用数组、字典、标量值或者 Python 对象来创建 Series 对象。下面展示了创建 Series 对象的不同方法:
1) 创建一个空Series对象
使用以下方法可以创建一个空的 Series 对象,如下所示:
import pandas as pd
#输出数据为空
s = pd.Series()
print(s)
输出结果如下:
Series([], dtype: float64)
2) ndarray创建Series对象
ndarray 是 NumPy 中的数组类型,当 data 是 ndarry 时,传递的索引必须具有与数组相同的长度。假如没有给 index 参数传参,在默认情况下,索引值将使用是 range(n) 生成,其中 n 代表数组长度,如下所示:
[0,1,2,3…. range(len(array))-1]
使用默认索引,创建 Series 序列对象:
import pandas as pd
import numpy as np
data = np.array(['a','b','c','d'])
s = pd.Series(data)
print (s)
输出结果如下:
0   a
1   b
2   c
3   d
dtype: object
上述示例中没有传递任何索引,所以索引默认从 0 开始分配 ,其索引范围为 0 到len(data)-1,即 0 到 3。这种设置方式被称为“隐式索引”。
除了上述方法外,你也可以使用“显式索引”的方法定义索引标签,示例如下:
import pandas as pd
import numpy as np
data = np.array(['a','b','c','d'])
#自定义索引标签(即显示索引)
s = pd.Series(data,index=[100,101,102,103])
print(s)
输出结果:
100  a
101  b
102  c
103  d
dtype: object
3) dict创建Series对象
您可以把 dict 作为输入数据。如果没有传入索引时会按照字典的键来构造索引;反之,当传递了索引时需要将索引标签与字典中的值一一对应。
下面两组示例分别对上述两种情况做了演示。
示例1,没有传递索引时:
import pandas as pd
import numpy as np
data = 'a' : 0., 'b' : 1., 'c' : 2.
s = pd.Series(data)
print(s)
输出结果:
a 0.0
b 1.0
c 2.0
dtype: float64
示例 2,为index参数传递索引时:
import pandas as pd
import numpy as np
data = 'a' : 0., 'b' : 1., 'c' : 2.
s = pd.Series(data,index=['b','c','d','a'])
print(s)
输出结果:
b 1.0
c 2.0
d NaN
a 0.0
dtype: float64
当传递的索引值无法找到与其对应的值时,使用 NaN(非数字)填充。
4) 标量创建Series对象
如果 data 是标量值,则必须提供索引,示例如下:
import pandas as pd
import numpy as np
s = pd.Series(5, index=[0, 1, 2, 3])
print(s)
输出如下:
0  5
1  5
2  5
3  5
dtype: int64
标量值按照 index 的数量进行重复,并与其一一对应。
访问Series数据
上述讲解了创建 Series 对象的多种方式,那么我们应该如何访问 Series 序列中元素呢?分为两种方式,一种是位置索引访问;另一种是索引标签访问。
1) 位置索引访问
这种访问方式与 ndarray 和 list 相同,使用元素自身的下标进行访问。我们知道数组的索引计数从 0 开始,这表示第一个元素存储在第 0 个索引位置上,以此类推,就可以获得 Series 序列中的每个元素。下面看一组简单的示例:
import pandas as pd
s = pd.Series([1,2,3,4,5],index = ['a','b','c','d','e'])
print(s[0])  #位置下标
print(s['a']) #标签下标
输出结果:
1
1
通过切片的方式访问 Series 序列中的数据,示例如下:
import pandas as pd
s = pd.Series([1,2,3,4,5],index = ['a','b','c','d','e'])
print(s[:3])
输出结果:
a  1
b  2
c  3
dtype: int64
如果想要获取最后三个元素,也可以使用下面的方式:
import pandas as pd
s = pd.Series([1,2,3,4,5],index = ['a','b','c','d','e'])
print(s[-3:])
输出结果:
c  3
d  4
e  5
dtype: int64
2) 索引标签访问
Series 类似于固定大小的 dict,把 index 中的索引标签当做 key,而把 Series 序列中的元素值当做 value,然后通过 index 索引标签来访问或者修改元素值。
示例1,使用索标签访问单个元素值:
import pandas as pd
s = pd.Series([6,7,8,9,10],index = ['a','b','c','d','e'])
print(s['a'])
输出结果:
6
示例 2,使用索引标签访问多个元素值
import pandas as pd
s = pd.Series([6,7,8,9,10],index = ['a','b','c','d','e'])
print(s[['a','c','d']])
输出结果:
a    6
c    8
d    9
dtype: int64
示例3,如果使用了 index 中不包含的标签,则会触发异常:
import pandas as pd
s = pd.Series([6,7,8,9,10],index = ['a','b','c','d','e'])
#不包含f值
print(s['f'])
输出结果:
......
KeyError: 'f'
Series常用属性
下面我们介绍 Series 的常用属性和方法。在下表列出了 Series 对象的常用属性。
| 名称 | 属性 |
|---|---|
| axes | 以列表的形式返回所有行索引标签。 |
| dtype | 返回对象的数据类型。 |
| empty | 返回一个空的 Series 对象。 |
| ndim | 返回输入数据的维数。 |
| size | 返回输入数据的元素数量。 |
| values | 以 ndarray 的形式返回 Series 对象。 |
| index | 返回一个RangeIndex对象,用来描述索引的取值范围。 |
现在创建一个 Series 对象,并演示如何使用上述表格中的属性。如下所示:
import pandas as pd
import numpy as np
s = pd.Series(np.random.randn(5))
print(s)
输出结果:
0    0.898097
1    0.730210
2    2.307401
3   -1.723065
4    0.346728
dtype: float64
上述示例的行索引标签是 [0,1,2,3,4]。
1) axes
import pandas as pd
import numpy as np
s = pd.Series(np.random.randn(5))
print ("The axes are:")
print(s.axes)
输出结果
The axes are:
[RangeIndex(start=0, stop=5, step=1)]
2) dtype
import pandas as pd
import numpy as np
s = pd.Series(np.random.randn(5))
print ("The dtype is:")
print(s.dtype)
输出结果:
The dtype is:
float64
3) empty
返回一个布尔值,用于判断数据对象是否为空。示例如下:
import pandas as pd
import numpy as np
s = pd.Series(np.random.randn(5))
print("是否为空对象?")
print (s.empty)
输出结果:
是否为空对象?
False
4) ndim
查看序列的维数。根据定义,Series 是一维数据结构,因此它始终返回 1。
import pandas as pd
import numpy as np
s = pd.Series(np.random.randn(5))
print (s)
print (s.ndim)
输出结果:
0    0.311485
1    1.748860
2   -0.022721
3   -0.129223
4   -0.489824
dtype: float64
1
5) size
返回 Series 对象的大小(长度)。
import pandas as pd
import numpy as np
s = pd.Series(np.random.randn(3))
print (s)
#series的长度大小
print(s.size)
输出结果:
0   -1.866261
1   -0.636726
2    0.586037
dtype: float64
3
6) values
以数组的形式返回 Series 对象中的数据。
import pandas as pd
import numpy as np
s = pd.Series(np.random.randn(6))
print(s)
print("输出series中数据")
print(s.values)
输出结果:
0   -0.502100
1    0.696194
2   -0.982063
3    0.416430
4   -1.384514
5    0.444303
dtype: float64
输出series中数据
[-0.50210028  0.69619407 -0.98206327  0.41642976 -1.38451433  0.44430257]
7) index
该属性用来查看 Series 中索引的取值范围。示例如下:
#显示索引
import pandas as pd
s=pd.Series([1,2,5,8],index=['a','b','c','d'])
print(s.index)
#隐式索引
s1=pd.Series([1,2,5,8])
print(s1.index)
输出结果:
隐式索引:
Index(['a', 'b', 'c', 'd'], dtype='object')
显示索引:
RangeIndex(start=0, stop=4, step=1)
Series常用方法
1) head()&tail()查看数据
如果想要查看 Series 的某一部分数据,可以使用 head() 或者 tail() 方法。其中 head() 返回前 n 行数据,默认显示前 5 行数据。示例如下:
import pandas as pd
import numpy as np
s = pd.Series(np.random.randn(5))
print ("The original series is:")
print (s)
#返回前三行数据
print (s.head(3))
输出结果:
原系列输出结果:
0    1.249679
1    0.636487
2   -0.987621
3    0.999613
4    1.607751
head(3)输出:
dtype: float64
0    1.249679
1    0.636487
2   -0.987621
dtype: float64
tail() 返回的是后 n 行数据,默认为后 5 行。示例如下:
import pandas as pd
import numpy as np
s = pd.Series(np.random.randn(4))
#原series
print(s)
#输出后两行数据
print (s.tail(2))
输出结果:
原Series输出:
0    0.053340
1    2.165836
2   -0.719175
3   -0.035178
输出后两行数据:
dtype: float64
2   -0.719175
3   -0.035178
dtype: float64
2) isnull()&nonull()检测缺失值
isnull() 和 nonull() 用于检测 Series 中的缺失值。所谓缺失值,顾名思义就是值不存在、丢失、缺少。
- isnull():如果为值不存在或者缺失,则返回 True。
- notnull():如果值不存在或者缺失,则返回 False。
其实不难理解,在实际的数据分析任物中,数据的收集往往要经历一个繁琐的过程。在这个过程中难免会因为一些不可抗力,或者人为因素导致数据丢失的现象。这时,我们可以使用相应的方法对缺失值进行处理,比如均值插值、数据补齐等方法。上述两个方法就是帮助我们检测是否存在缺失值。示例如下:
import pandas as pd
#None代表缺失数据
s=pd.Series([1,2,5,None])
print(pd.isnull(s))  #是空值返回True
print(pd.notnull(s)) #空值返回False
输出结果:
0    False
1    False
2    False
3     True
dtype: bool

notnull():
0     True
1     True
2     True
3    False
dtype: bool
Pandas DataFrame入门教程(图解版)
DataFrame 是 Pandas 的重要数据结构之一,也是在使用 Pandas 进行数据分析过程中最常用的结构之一,可以这么说,掌握了 DataFrame 的用法,你就拥有了学习数据分析的基本能力。
认识DataFrame结构
DataFrame 一个表格型的数据结构,既有行标签(index),又有列标签(columns),它也被称异构数据表,所谓异构,指的是表格中每列的数据类型可以不同,比如可以是字符串、整型或者浮点型等。其结构图示意图,如下所示:

表格中展示了某个销售团队个人信息和绩效评级(rating)的相关数据。数据以行和列形式来表示,其中每一列表示一个属性,而每一行表示一个条目的信息。
下表展示了上述表格中每一列标签所描述数据的数据类型,如下所示:
| Column | Type |
|---|---|
| name | String |
| age | integer |
| gender | String |
| rating | Float |
DataFrame 的每一行数据都可以看成一个 Series 结构,只不过,DataFrame 为这些行中每个数据值增加了一个列标签。因此 DataFrame 其实是从 Series 的基础上演变而来。在数据分析任务中 DataFrame 的应用非常广泛,因为它描述数据的更为清晰、直观。
通过示例对 DataFrame 结构做进一步讲解。 下面展示了一张学生成绩表,如下所示:
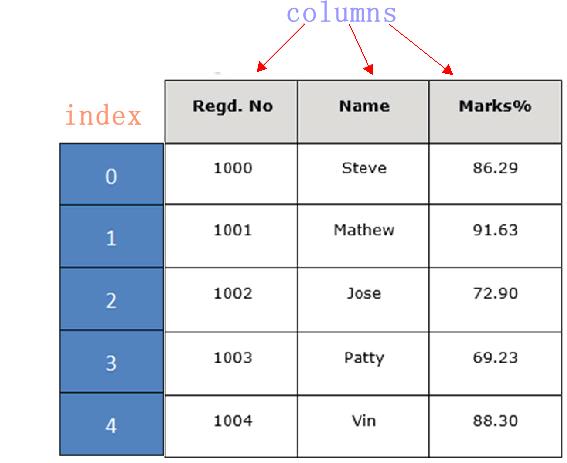
DataFrame 结构类似于 Execl 的表格型,表格中列标签的含义如下所示:
- Regd.No:表示登记的序列号
- Name:学生姓名
- Marks:学生分数
同 Series 一样,DataFrame 自带行标签索引,默认为“隐式索引”即从 0 开始依次递增,行标签与 DataFrame 中的数据项一一对应。上述表格的行标签从 0 到 5,共记录了 5 条数据(图中将行标签省略)。当然你也可以用“显式索引”的方式来设置行标签。
下面对 DataFrame 数据结构的特点做简单地总结,如下所示:
- DataFrame 每一列的标签值允许使用不同的数据类型;
- DataFrame 是表格型的数据结构,具有行和列;
- DataFrame 中的每个数据值都可以被修改。
- DataFrame 结构的行数、列数允许增加或者删除;
- DataFrame 有两个方向的标签轴,分别是行标签和列标签;
- DataFrame 可以对行和列执行算术运算。
创建DataFrame对象
创建 DataFrame 对象的语法格式如下:
import pandas as pd
pd.DataFrame( data, index, columns, dtype, copy)
参数说明:
| 参数名称 | 说明 |
|---|---|
| data | 输入的数据,可以是 ndarray,series,list,dict,标量以及一个 DataFrame。 |
| index | 行标签,如果没有传递 index 值,则默认行标签是 np.arange(n),n 代表 data 的元素个数。 |
| columns | 列标签,如果没有传递 columns 值,则默认列标签是 np.arange(n)。 |
| dtype | dtype表示每一列的数据类型。 |
| copy | 默认为 False,表示复制数据 data。 |
Pandas 提供了多种创建 DataFrame 对象的方式,主要包含以下五种,分别进行介绍。
1) 创建空的DataFrame对象
使用下列方式创建一个空的 DataFrame,这是 DataFrame 最基本的创建方法。
import pandas as pd
df = pd.DataFrame()
print(df)
输出结果如下:
Empty DataFrame
Columns: []
Index: []
2) 列表创建DataFame对象
可以使用单一列表或嵌套列表来创建一个 DataFrame。
示例 1,单一列表创建 DataFrame:
import pandas as pd
data = [1,2,3,4,5]
df = pd.DataFrame(data)
print(df)
输出如下:
     0
0    1
1    2
2    3
3    4
4    5
示例 2,使用嵌套列表创建 DataFrame 对象:
import pandas as pd
data = [['Alex',10],['Bob',12],['Clarke',13]]
df = pd.DataFrame(data,columns=['Name','Age'])
print(df)
输出结果:
      Name      Age
0     Alex      10
1     Bob       12
2     Clarke    13
示例 3,指定数值元素的数据类型为 float:
import pandas as pd
data = [['Alex',10],['Bob',12],['Clarke',13]]
df = pd.DataFrame<Pandas高级教程之:自定义选项
简介
pandas有一个option系统可以控制pandas的展示情况,一般来说我们不需要进行修改,但是不排除特殊情况下的修改需求。本文将会详细讲解pandas中的option设置。
常用选项
pd.options.display 可以控制展示选项,比如设置最大展示行数:
In [1]: import pandas as pd
In [2]: pd.options.display.max_rows
Out[2]: 15
In [3]: pd.options.display.max_rows = 999
In [4]: pd.options.display.max_rows
Out[4]: 999
除此之外,pd还有4个相关的方法来对option进行修改:
- get_option() / set_option() – get/set 单个option的值
- reset_option() – 重设某个option的值到默认值
- describe_option() – 打印某个option的值
- option_context() – 在代码片段中执行某些option的更改
如下所示:
In [5]: pd.get_option("display.max_rows")
Out[5]: 999
In [6]: pd.set_option("display.max_rows", 101)
In [7]: pd.get_option("display.max_rows")
Out[7]: 101
In [8]: pd.set_option("max_r", 102)
In [9]: pd.get_option("display.max_rows")
Out[9]: 102
get/set 选项
pd.get_option 和 pd.set_option 可以用来获取和修改特定的option:
In [11]: pd.get_option("mode.sim_interactive")
Out[11]: False
In [12]: pd.set_option("mode.sim_interactive", True)
In [13]: pd.get_option("mode.sim_interactive")
Out[13]: True
使用 reset_option 来重置:
In [14]: pd.get_option("display.max_rows")
Out[14]: 60
In [15]: pd.set_option("display.max_rows", 999)
In [16]: pd.get_option("display.max_rows")
Out[16]: 999
In [17]: pd.reset_option("display.max_rows")
In [18]: pd.get_option("display.max_rows")
Out[18]: 60
使用正则表达式可以重置多条option:
In [19]: pd.reset_option("^display")
option_context 在代码环境中修改option,代码结束之后,option会被还原:
In [20]: with pd.option_context("display.max_rows", 10, "display.max_columns", 5):
....: print(pd.get_option("display.max_rows"))
....: print(pd.get_option("display.max_columns"))
....:
10
5
In [21]: print(pd.get_option("display.max_rows"))
60
In [22]: print(pd.get_option("display.max_columns"))
0
经常使用的选项
下面我们看一些经常使用选项的例子:
最大展示行数
display.max_rows 和 display.max_columns 可以设置最大展示行数和列数:
In [23]: df = pd.DataFrame(np.random.randn(7, 2))
In [24]: pd.set_option("max_rows", 7)
In [25]: df
Out[25]:
0 1
0 0.469112 -0.282863
1 -1.509059 -1.135632
2 1.212112 -0.173215
3 0.119209 -1.044236
4 -0.861849 -2.104569
5 -0.494929 1.071804
6 0.721555 -0.706771
In [26]: pd.set_option("max_rows", 5)
In [27]: df
Out[27]:
0 1
0 0.469112 -0.282863
1 -1.509059 -1.135632
.. ... ...
5 -0.494929 1.071804
6 0.721555 -0.706771
[7 rows x 2 columns]
超出数据展示
display.large_repr 可以选择对于超出的行或者列的展示行为,可以是truncated frame:
In [43]: df = pd.DataFrame(np.random.randn(10, 10))
In [44]: pd.set_option("max_rows", 5)
In [45]: pd.set_option("large_repr", "truncate")
In [46]: df
Out[46]:
0 1 2 3 4 5 6 7 8 9
0 -0.954208 1.462696 -1.743161 -0.826591 -0.345352 1.314232 0.690579 0.995761 2.396780 0.014871
1 3.357427 -0.317441 -1.236269 0.896171 -0.487602 -0.082240 -2.182937 0.380396 0.084844 0.432390
.. ... ... ... ... ... ... ... ... ... ...
8 -0.303421 -0.858447 0.306996 -0.028665 0.384316 1.574159 1.588931 0.476720 0.473424 -0.242861
9 -0.014805 -0.284319 0.650776 -1.461665 -1.137707 -0.891060 -0.693921 1.613616 0.464000 0.227371
[10 rows x 10 columns]
也可以是统计信息:
In [47]: pd.set_option("large_repr", "info")
In [48]: df
Out[48]:
<class \'pandas.core.frame.DataFrame\'>
RangeIndex: 10 entries, 0 to 9
Data columns (total 10 columns):
# Column Non-Null Count Dtype
--- ------ -------------- -----
0 0 10 non-null float64
1 1 10 non-null float64
2 2 10 non-null float64
3 3 10 non-null float64
4 4 10 non-null float64
5 5 10 non-null float64
6 6 10 non-null float64
7 7 10 non-null float64
8 8 10 non-null float64
9 9 10 non-null float64
dtypes: float64(10)
memory usage: 928.0 bytes
最大列的宽度
display.max_colwidth 用来设置最大列的宽度。
In [51]: df = pd.DataFrame(
....: np.array(
....: [
....: ["foo", "bar", "bim", "uncomfortably long string"],
....: ["horse", "cow", "banana", "apple"],
....: ]
....: )
....: )
....:
In [52]: pd.set_option("max_colwidth", 40)
In [53]: df
Out[53]:
0 1 2 3
0 foo bar bim uncomfortably long string
1 horse cow banana apple
In [54]: pd.set_option("max_colwidth", 6)
In [55]: df
Out[55]:
0 1 2 3
0 foo bar bim un...
1 horse cow ba... apple
显示精度
display.precision 可以设置显示的精度:
In [70]: df = pd.DataFrame(np.random.randn(5, 5))
In [71]: pd.set_option("precision", 7)
In [72]: df
Out[72]:
0 1 2 3 4
0 -1.1506406 -0.7983341 -0.5576966 0.3813531 1.3371217
1 -1.5310949 1.3314582 -0.5713290 -0.0266708 -1.0856630
2 -1.1147378 -0.0582158 -0.4867681 1.6851483 0.1125723
3 -1.4953086 0.8984347 -0.1482168 -1.5960698 0.1596530
4 0.2621358 0.0362196 0.1847350 -0.2550694 -0.2710197
零转换的门槛
display.chop_threshold 可以设置将Series或者DF中数据展示为0的门槛:
In [75]: df = pd.DataFrame(np.random.randn(6, 6))
In [76]: pd.set_option("chop_threshold", 0)
In [77]: df
Out[77]:
0 1 2 3 4 5
0 1.2884 0.2946 -1.1658 0.8470 -0.6856 0.6091
1 -0.3040 0.6256 -0.0593 0.2497 1.1039 -1.0875
2 1.9980 -0.2445 0.1362 0.8863 -1.3507 -0.8863
3 -1.0133 1.9209 -0.3882 -2.3144 0.6655 0.4026
4 0.3996 -1.7660 0.8504 0.3881 0.9923 0.7441
5 -0.7398 -1.0549 -0.1796 0.6396 1.5850 1.9067
In [78]: pd.set_option("chop_threshold", 0.5)
In [79]: df
Out[79]:
0 1 2 3 4 5
0 1.2884 0.0000 -1.1658 0.8470 -0.6856 0.6091
1 0.0000 0.6256 0.0000 0.0000 1.1039 -1.0875
2 1.9980 0.0000 0.0000 0.8863 -1.3507 -0.8863
3 -1.0133 1.9209 0.0000 -2.3144 0.6655 0.0000
4 0.0000 -1.7660 0.8504 0.0000 0.9923 0.7441
5 -0.7398 -1.0549 0.0000 0.6396 1.5850 1.9067
上例中,绝对值< 0.5 的都会被展示为0 。
列头的对齐方向
display.colheader_justify 可以修改列头部文字的对齐方向:
In [81]: df = pd.DataFrame(
....: np.array([np.random.randn(6), np.random.randint(1, 9, 6) * 0.1, np.zeros(6)]).T,
....: columns=["A", "B", "C"],
....: dtype="float",
....: )
....:
In [82]: pd.set_option("colheader_justify", "right")
In [83]: df
Out[83]:
A B C
0 0.1040 0.1 0.0
1 0.1741 0.5 0.0
2 -0.4395 0.4 0.0
3 -0.7413 0.8 0.0
4 -0.0797 0.4 0.0
5 -0.9229 0.3 0.0
In [84]: pd.set_option("colheader_justify", "left")
In [85]: df
Out[85]:
A B C
0 0.1040 0.1 0.0
1 0.1741 0.5 0.0
2 -0.4395 0.4 0.0
3 -0.7413 0.8 0.0
4 -0.0797 0.4 0.0
5 -0.9229 0.3 0.0
常见的选项表格:
选项
默认值
描述
display.chop_threshold
None
If set to a float value, all float values smaller then the given threshold will be displayed as exactly 0 by repr and friends.
display.colheader_justify
right
Controls the justification of column headers. used by DataFrameFormatter.
display.column_space
12
No description available.
display.date_dayfirst
False
When True, prints and parses dates with the day first, eg 20/01/2005
display.date_yearfirst
False
When True, prints and parses dates with the year first, eg 2005/01/20
display.encoding
UTF-8
Defaults to the detected encoding of the console. Specifies the encoding to be used for strings returned by to_string, these are generally strings meant to be displayed on the console.
display.expand_frame_repr
True
Whether to print out the full DataFrame repr for wide DataFrames across multiple lines, max_columns is still respected, but the output will wrap-around across multiple “pages” if its width exceeds display.width.
display.float_format
None
The callable should accept a floating point number and return a string with the desired format of the number. This is used in some places like SeriesFormatter. See core.format.EngFormatter for an example.
display.large_repr
truncate
For DataFrames exceeding max_rows/max_cols, the repr (and HTML repr) can show a truncated table (the default), or switch to the view from df.info() (the behaviour in earlier versions of pandas). allowable settings, [‘truncate’, ‘info’]
display.latex.repr
False
Whether to produce a latex DataFrame representation for Jupyter frontends that support it.
display.latex.escape
True
Escapes special characters in DataFrames, when using the to_latex method.
display.latex.longtable
False
Specifies if the to_latex method of a DataFrame uses the longtable format.
display.latex.multicolumn
True
Combines columns when using a MultiIndex
display.latex.multicolumn_format
‘l’
Alignment of multicolumn labels
display.latex.multirow
False
Combines rows when using a MultiIndex. Centered instead of top-aligned, separated by clines.
display.max_columns
0 or 20
max_rows and max_columns are used in repr() methods to decide if to_string() or info() is used to render an object to a string. In case Python/IPython is running in a terminal this is set to 0 by default and pandas will correctly auto-detect the width of the terminal and switch to a smaller format in case all columns would not fit vertically. The IPython notebook, IPython qtconsole, or IDLE do not run in a terminal and hence it is not possible to do correct auto-detection, in which case the default is set to 20. ‘None’ value means unlimited.
display.max_colwidth
50
The maximum width in characters of a column in the repr of a pandas data structure. When the column overflows, a “…” placeholder is embedded in the output. ‘None’ value means unlimited.
display.max_info_columns
100
max_info_columns is used in DataFrame.info method to decide if per column information will be printed.
display.max_info_rows
1690785
df.info() will usually show null-counts for each column. For large frames this can be quite slow. max_info_rows and max_info_cols limit this null check only to frames with smaller dimensions then specified.
display.max_rows
60
This sets the maximum number of rows pandas should output when printing out various output. For example, this value determines whether the repr() for a dataframe prints out fully or just a truncated or summary repr. ‘None’ value means unlimited.
display.min_rows
10
The numbers of rows to show in a truncated repr (when max_rows is exceeded). Ignored when max_rows is set to None or 0. When set to None, follows the value of max_rows.
display.max_seq_items
100
when pretty-printing a long sequence, no more then max_seq_items will be printed. If items are omitted, they will be denoted by the addition of “…” to the resulting string. If set to None, the number of items to be printed is unlimited.
display.memory_usage
True
This specifies if the memory usage of a DataFrame should be displayed when the df.info() method is invoked.
display.multi_sparse
True
“Sparsify” MultiIndex display (don’t display repeated elements in outer levels within groups)
display.notebook_repr_html
True
When True, IPython notebook will use html representation for pandas objects (if it is available).
display.pprint_nest_depth
3
Controls the number of nested levels to process when pretty-printing
display.precision
6
Floating point output precision in terms of number of places after the decimal, for regular formatting as well as scientific notation. Similar to numpy’s precision print option
display.show_dimensions
truncate
Whether to print out dimensions at the end of DataFrame repr. If ‘truncate’ is specified, only print out the dimensions if the frame is truncated (e.g. not display all rows and/or columns)
display.width
80
Width of the display in characters. In case Python/IPython is running in a terminal this can be set to None and pandas will correctly auto-detect the width. Note that the IPython notebook, IPython qtconsole, or IDLE do not run in a terminal and hence it is not possible to correctly detect the width.
display.html.table_schema
False
Whether to publish a Table Schema representation for frontends that support it.
display.html.border
1
A border=value attribute is inserted in the <table> tag for the DataFrame HTML repr.
display.html.use_mathjax
True
When True, Jupyter notebook will process table contents using MathJax, rendering mathematical expressions enclosed by the dollar symbol.
io.excel.xls.writer
xlwt
The default Excel writer engine for ‘xls’ files.Deprecated since version 1.2.0: As xlwt package is no longer maintained, the xlwt engine will be removed in a future version of pandas. Since this is the only engine in pandas that supports writing to .xls files, this option will also be removed.
io.excel.xlsm.writer
openpyxl
The default Excel writer engine for ‘xlsm’ files. Available options: ‘openpyxl’ (the default).
io.excel.xlsx.writer
openpyxl
The default Excel writer engine for ‘xlsx’ files.
io.hdf.default_format
None
default format writing format, if None, then put will default to ‘fixed’ and append will default to ‘table’
io.hdf.dropna_table
True
drop ALL nan rows when appending to a table
io.parquet.engine
None
The engine to use as a default for parquet reading and writing. If None then try ‘pyarrow’ and ‘fastparquet’
mode.chained_assignment
warn
Controls SettingWithCopyWarning: ‘raise’, ‘warn’, or None. Raise an exception, warn, or no action if trying to use chained assignment.
mode.sim_interactive
False
Whether to simulate interactive mode for purposes of testing.
mode.use_inf_as_na
False
True means treat None, NaN, -INF, INF as NA (old way), False means None and NaN are null, but INF, -INF are not NA (new way).
compute.use_bottleneck
True
Use the bottleneck library to accelerate computation if it is installed.
compute.use_numexpr
True
Use the numexpr library to accelerate computation if it is installed.
plotting.backend
matplotlib
Change the plotting backend to a different backend than the current matplotlib one. Backends can be implemented as third-party libraries implementing the pandas plotting API. They can use other plotting libraries like Bokeh, Altair, etc.
plotting.matplotlib.register_converters
True
Register custom converters with matplotlib. Set to False to de-register.
以上是关于Pandas教程(非常详细)的主要内容,如果未能解决你的问题,请参考以下文章