数据聚类基于matlab杂草算法优化K-means算法数据聚类含Matlab源码 2168期
Posted 海神之光
tags:
篇首语:本文由小常识网(cha138.com)小编为大家整理,主要介绍了数据聚类基于matlab杂草算法优化K-means算法数据聚类含Matlab源码 2168期相关的知识,希望对你有一定的参考价值。
一、获取代码方式
获取代码方式1:
完整代码已上传我的资源:【数据聚类】基于matlab杂草算法优化K-means算法数据聚类【含Matlab源码 2168期】
获取代码方式2:
通过订阅紫极神光博客付费专栏,凭支付凭证,私信博主,可获得此代码。
备注:
订阅紫极神光博客付费专栏,可免费获得1份代码(有效期为订阅日起,三天内有效);
二、K-means算法数据聚类
1 k-means算法步骤
k-means算法是根据参数k将n个数据集划分为k-means(k聚类),最终使各个聚类的数据点到聚类中心的距离的平方和达到最小的方法。
k-means算法的具体步骤如下:(1)任意选k个点作为初始聚类的中心或者均值;(2)计算其他数据点到聚类中心的距离;(3)按最近距离原则将数据点分配到最近的中心;(4)利用均值算法计算新的聚类中心;(5)若相邻中心无变化或准则函数E已收敛,算法结束,否则继续迭代;(6)最后产生的k个聚类中心点和以它为中心的聚类划分是最终结果。
2 k-means算法模型
假设对n个m维样本聚类,得到样本集X=X1,X2…,Xn,其中,Xi=(Xi1,Xi2…,Xim),k个分类记为C=C1,C2…,Ck,质=心

式中:dij(xi,zj)为距离计算函数,文章选用欧式距离来计算;k为聚类数量;zj为样本j的聚类中心。
三、部分源代码
clc;
clear;
close all;
warning(‘off’);
%% Basics
% Loading
data = load(‘dat’);
X = data.XX;
%
k = 3; % Number of Clusters
%
CostFunction=@(m) ClusterCost(m, X); % Cost Function
VarSize=[k size(X,2)]; % Decision Variables Matrix Size
nVar=prod(VarSize); % Number of Decision Variables
VarMin= repmat(min(X),k,1); % Lower Bound of Variables
VarMax= repmat(max(X),k,1); % Upper Bound of Variables
%% IWO Params
MaxIt = 25; % Maximum Number of Iterations
nPop0 = 2; % Initial Population Size
nPop = 5; % Maximum Population Size
Smin = 2; % Minimum Number of Seeds
Smax = 5; % Maximum Number of Seeds
Exponent = 1.5; % Variance Reduction Exponent
sigma_initial = 0.2; % Initial Value of Standard Deviation
sigma_final = 0.001; % Final Value of Standard Deviation
%% Intro
% Empty Plant Structure
empty_plant.Position = [];
empty_plant.Cost = [];
empty_plant.Out = [];
pop = repmat(empty_plant, nPop0, 1); % Initial Population Array
for i = 1:numel(pop)
% Initialize Position
pop(i).Position = unifrnd(VarMin, VarMax, VarSize);
% Evaluation
[pop(i).Cost, pop(i).Out]= CostFunction(pop(i).Position);
end
% Best Solution Ever Found
BestSol = pop(1);
% Initialize Best Cost History
BestCosts = zeros(MaxIt, 1);
%% IWO Main Body
for it = 1:MaxIt
% Update Standard Deviation
sigma = ((MaxIt - it)/(MaxIt - 1))^Exponent * (sigma_initial - sigma_final) + sigma_final;
% Get Best and Worst Cost Values
Costs = [pop.Cost];
BestCost = min(Costs);
WorstCost = max(Costs);
% Initialize Offsprings Population
newpop = [];
% Reproduction
for i = 1:numel(pop)
ratio = (pop(i).Cost - WorstCost)/(BestCost - WorstCost);
S = floor(Smin + (Smax - Smin)*ratio);
for j = 1:S
% Initialize Offspring
newsol = empty_plant;
% Generate Random Location
newsol.Position = pop(i).Position + sigma * randn(VarSize);
% Apply Lower/Upper Bounds
newsol.Position = max(newsol.Position, VarMin);
newsol.Position = min(newsol.Position, VarMax);
% Evaluate Offsring
[newsol.Cost, newsol.Out] = CostFunction(newsol.Position);
% Add Offpsring to the Population
newpop = [newpop
newsol];
end
end
% Merge Populations
pop = [pop
newpop];
% Sort Population
[~, SortOrder] = sort([pop.Cost]);
pop = pop(SortOrder);
% Competitive Exclusion (Delete Extra Members)
if numel(pop)>nPop
pop = pop(1:nPop);
end
% Store Best Solution Ever Found
BestSol = pop(1);
% Store Best Cost History
BestCosts(it) = BestSol.Cost;
% Display Iteration Information
disp(['Iteration ’ num2str(it) ': Best Cost = ’ num2str(BestCosts(it))]);
% Plot
DECenters=PlotRes(X, BestSol);
pause(0.01);
end
%% Plot IWO Train
figure;
semilogy(BestCosts, ‘LineWidth’, 2);
xlabel(‘Iteration’);
ylabel(‘Best Cost’);
grid on;
DElbl=BestSol.Out.ind;
%% K-Means Clustering for Comparison
[kidx,KCenters] = kmeans(X,k);
figure
set(gcf, ‘Position’, [150, 50, 700, 400])
subplot(2,3,1)
gscatter(X(:,1),X(:,2),kidx);title(‘K-Means’)
hold on;
plot(KCenters(:,1),KCenters(:,2),‘ok’,‘LineWidth’,2,‘MarkerSize’,6);
subplot(2,3,2)
gscatter(X(:,1),X(:,3),kidx);title(‘K-Means’)
hold on;
plot(KCenters(:,1),KCenters(:,3),‘ok’,‘LineWidth’,2,‘MarkerSize’,6);
subplot(2,3,3)
gscatter(X(:,1),X(:,4),kidx);title(‘K-Means’)
hold on;
plot(KCenters(:,1),KCenters(:,4),‘ok’,‘LineWidth’,2,‘MarkerSize’,6);
subplot(2,3,4)
gscatter(X(:,2),X(:,3),kidx);title(‘K-Means’)
hold on;
plot(KCenters(:,2),KCenters(:,3),‘ok’,‘LineWidth’,2,‘MarkerSize’,6);
subplot(2,3,5)
gscatter(X(:,2),X(:,4),kidx);title(‘K-Means’)
hold on;
plot(KCenters(:,2),KCenters(:,4),‘ok’,‘LineWidth’,2,‘MarkerSize’,6);
subplot(2,3,6)
gscatter(X(:,3),X(:,4),kidx);title(‘K-Means’)
hold on;
plot(KCenters(:,3),KCenters(:,4),‘ok’,‘LineWidth’,2,‘MarkerSize’,6);
%
KMeanslbl=kidx;
%% Gaussian Mixture Model Clustering for Comparison
options = statset(‘Display’,‘final’);
gm = fitgmdist(X,k,‘Options’,options)
idx = cluster(gm,X);
figure
set(gcf, ‘Position’, [50, 300, 700, 400])
subplot(2,3,1)
gscatter(X(:,1),X(:,2),idx);title(‘GMM’)
hold on;
subplot(2,3,2)
gscatter(X(:,1),X(:,3),idx);title(‘GMM’)
hold on;
subplot(2,3,3)
gscatter(X(:,1),X(:,4),idx);title(‘GMM’)
hold on;
subplot(2,3,4)
gscatter(X(:,2),X(:,3),idx);title(‘GMM’)
hold on;
subplot(2,3,5)
gscatter(X(:,2),X(:,4),idx);title(‘GMM’)
hold on;
subplot(2,3,6)
gscatter(X(:,3),X(:,4),idx);title(‘GMM’)
hold on;
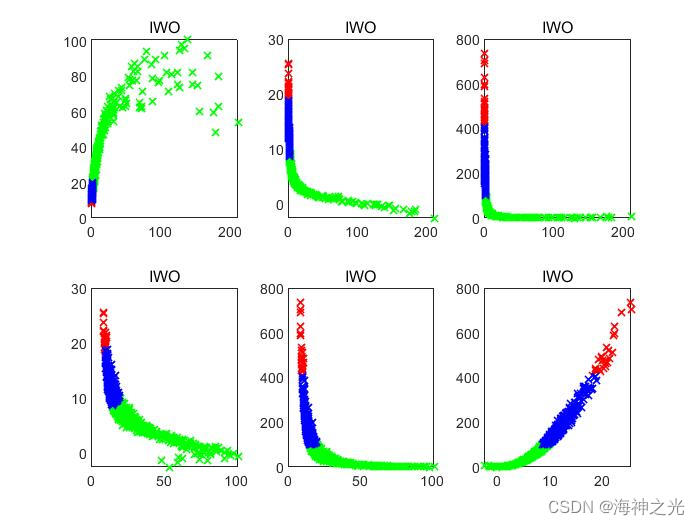
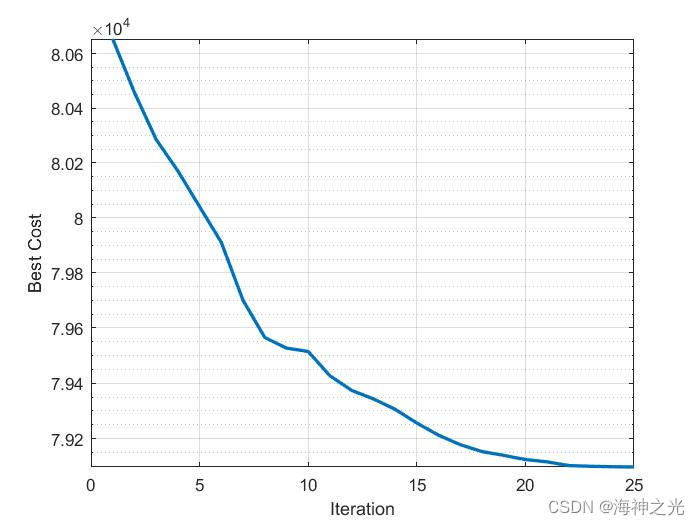
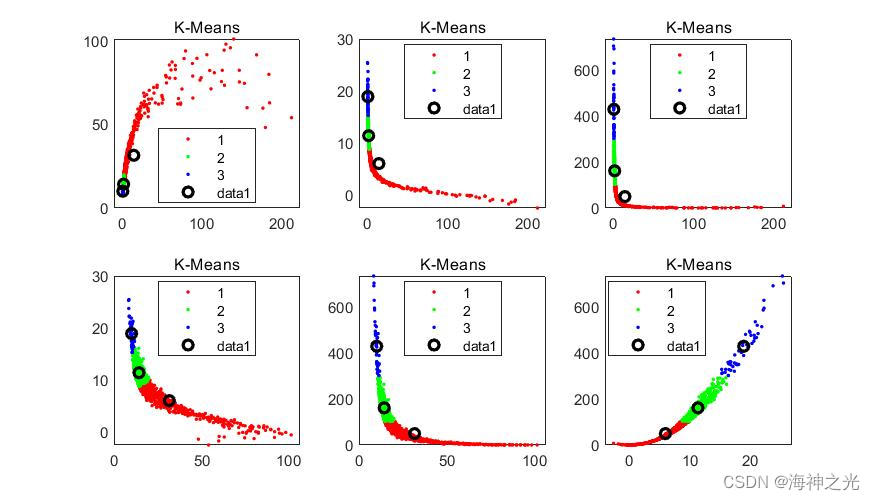
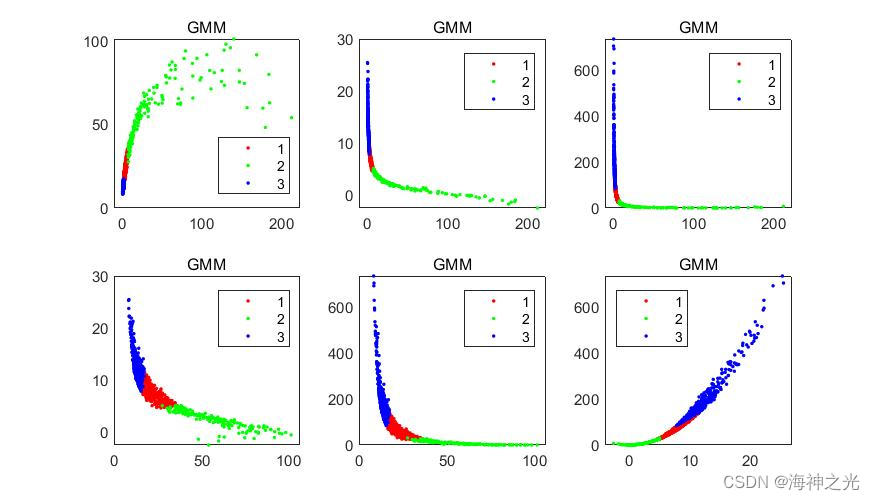
四、运行结果


五、matlab版本及参考文献
1 matlab版本
2014a
2 参考文献
[1]刘姣姣.基于k-means算法的电力负荷数据聚类方法分析[J].光源与照明. 2022,(06)
3 备注
简介此部分摘自互联网,仅供参考,若侵权,联系删除
以上是关于数据聚类基于matlab杂草算法优化K-means算法数据聚类含Matlab源码 2168期的主要内容,如果未能解决你的问题,请参考以下文章