Vue使用G2Plot-Pie饼图实现数据渲染-和类似0.1+0.2导致的精度问题
Posted JackieDYH
tags:
篇首语:本文由小常识网(cha138.com)小编为大家整理,主要介绍了Vue使用G2Plot-Pie饼图实现数据渲染-和类似0.1+0.2导致的精度问题相关的知识,希望对你有一定的参考价值。
前言
笔者,在使用Pie饼图的时候,有时候需要调整显示内容,比如在饼图中间显示总计金额,
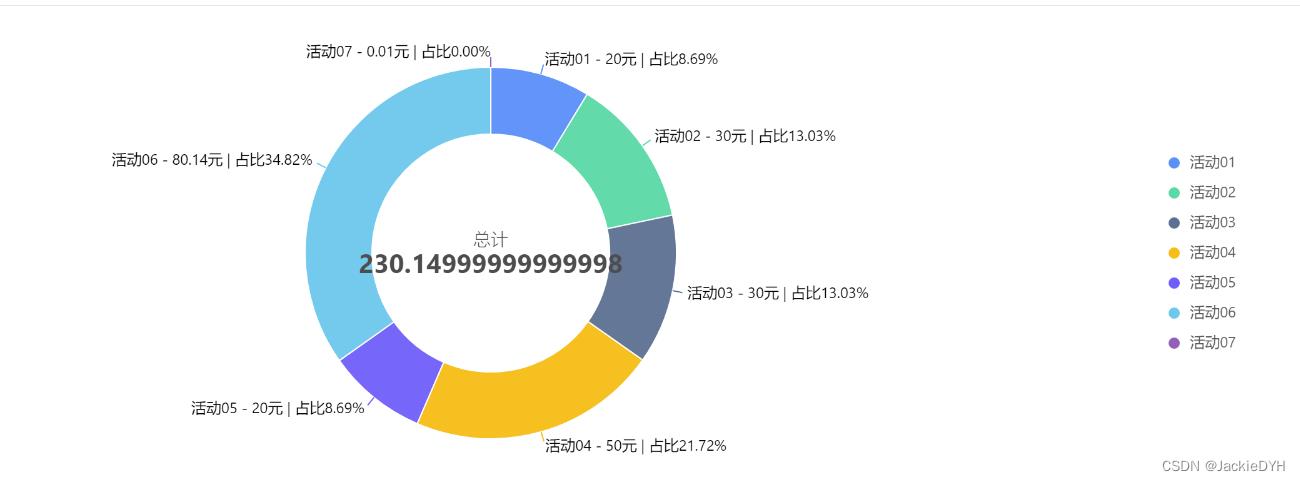
但是,在使用的时候,会发现一个经典的问题,javascript计算类似0.1+0.2的时候,会出现精度失真的情况,那么这个时候就需要自己二次处理一下计算过程,已解决失真的问题
图示

首先定义组件
<!--
 * @Author: Jackie
 * @Date: 2022-06-16 15:09:39
 * @LastEditTime: 2022-07-04 16:48:11
 * @LastEditors: Jackie
 * @Description: 饼图
 * @FilePath: /white-label-nft-admin-client/src/components/Charts/PieChart.vue
 * @version:
-->
<template>
  <div id="PieChart" ref="PieChart"></div>
</template>

<script>
import  Pie  from '@antv/g2plot'
let chartChange
export default
  name: 'PieChart',
  props:
    value:
      type: Array,
      default()
        return []
      ,
    ,
    Height:
      type: Number,
      default: 0,
    ,
  ,
  // 监听
  watch:
    value:
      handler(newVal, oldVal)
        console.log(newVal)
        // 更新数据
        chartChange.changeData(newVal)

        // 销毁后再渲染
        // chartChange.destroy()
        // this.initG2Plot()
      ,
      deep: true, //深度监听
      // immediate: true,
    ,
  ,
  mounted()
    this.initG2Plot()
  ,
  methods:
    initG2Plot()
      chartChange = new Pie(this.$refs.PieChart,
        data: this.value,
        height: this.Height,
        appendPadding: 10,
        angleField: 'value',
        colorField: 'type',
        radius: 0.9,
        innerRadius: 0.64,
        meta:
          value:
            formatter: (v) => `¥ $v`,
          ,
        ,
        legend:
          ayout: 'vertical',
          position: 'right',
          flipPage: true,
          offsetX: -20,
          // title:
          //   text: '产品类别 (销售量占比)',
          //   spacing: 8,
          // ,
          // itemValue:
          //   formatter: (text, item) =>
          //     const items = this.value.filter((d) => d.type === item.value)
          //     return items.length ? '¥' + items.reduce((a, b) => a + b.value, 0) / items.length : '-'
          //   ,
          //   style:
          //     opacity: 0.65,
          //   ,
          // ,
        ,
        label:
          type: 'outer',
          content: 'name - value元 | 占比percentage',
          // type: 'inner',
          // offset: '-50%',
          // autoRotate: false,
          // style:  textAlign: 'center' ,
          // formatter: ( percent ) => `$(percent * 100).toFixed(0)%`,
          style:
            fill: '#000',
          ,
        ,
        // 圆心配置
        statistic:
          title:
            offsetY: -10,
            content: '总计',
          ,
          content:
            offsetY: 10,
          ,
        ,
        // 添加 中心统计文本 交互
        interactions: [
           type: 'pie-legend-active' ,
           type: 'element-active' ,
          //  type: 'element-selected' ,
          //
          //   type: 'pie-statistic-active',
          //   cfg:
          //     start: [
          //        trigger: 'element:mouseenter', action: 'pie-statistic:change' ,
          //        trigger: 'legend-item:mouseenter', action: 'pie-statistic:change' ,
          //     ],
          //     end: [
          //        trigger: 'element:mouseleave', action: 'pie-statistic:reset' ,
          //        trigger: 'legend-item:mouseleave', action: 'pie-statistic:reset' ,
          //     ],
          //   ,
          // ,
        ],
      )
      chartChange.render()
    ,
  ,

</script>
使用的时候当传入数据有小数时,容易出现问题
[
	 type: '活动01', value: 20 ,
	 type: '活动02', value: 30 ,
	 type: '活动03', value: 30 ,
	 type: '活动04', value: 50 ,
	 type: '活动05', value: 20 ,
	 type: '活动06', value: 80.14 ,
	 type: '活动07', value: 0.01 ,
]
解决问题
当出现这个问题时,我就明白是JavaScript计算精度导致的,那么只能自己处理这个累计的值,来解决这个问题
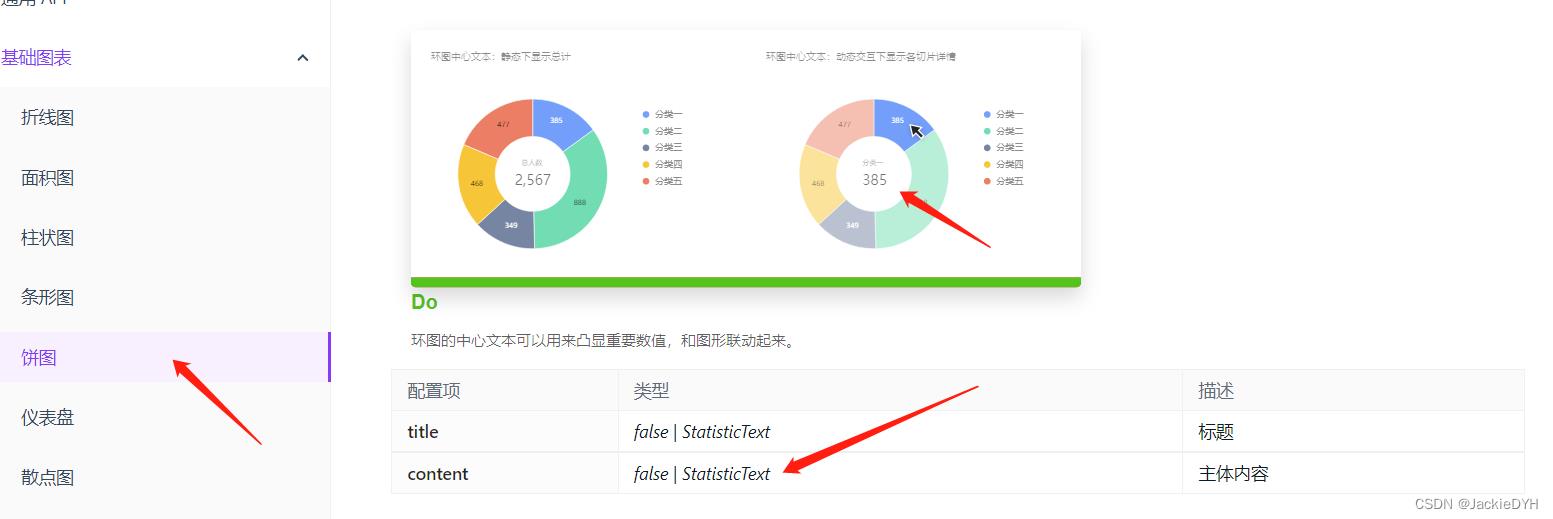
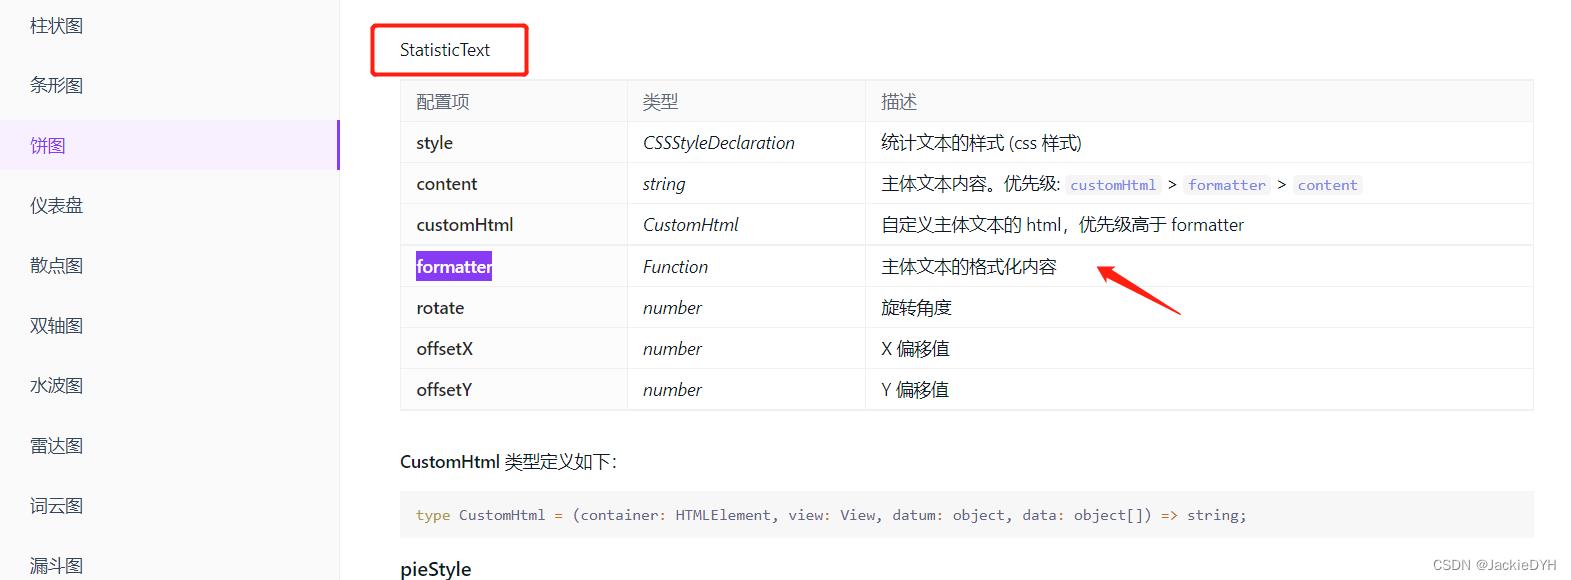
查阅官方文档


参照文档
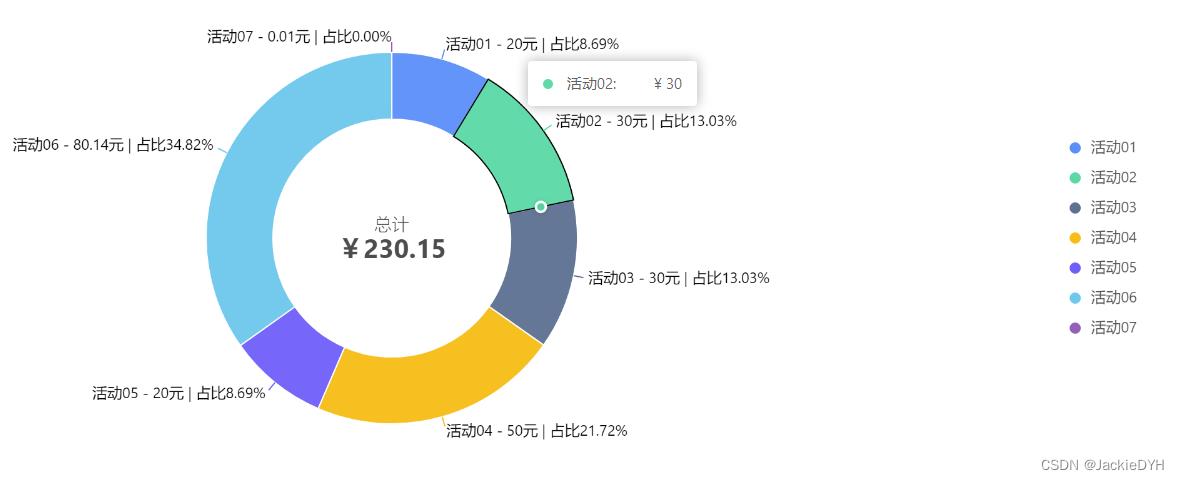
解决方法:失真是由于小数相加导致的,那么我们在相加之前,先扩大100倍,得到结果后缩小100倍,这样正确的值就得到了
// 圆心配置
statistic:
  title:
	offsetY: -10,
	content: '总计',
  ,
  content:
	offsetY: 10,
	// 解决精度失真问题
	// 方法一:value * 1000000000000
	// 方法二:parseFloat((0.1+0.2).toFixed(5))
	formatter: (value, datum, index, data) =>
	  const total = datum.reduce((a, b) =>
		return a + b.value
		// return a + b.value * 1000000000000
	  , 0)
	  return `¥$parseFloat(total.toFixed(5))`
	  // return `¥$total / 1000000000000`
	,
   ,
,
图示

全量代码
<!--
 * @Author: Jackie
 * @Date: 2022-06-16 15:09:39
 * @LastEditTime: 2022-07-04 17:00:37
 * @LastEditors: Jackie
 * @Description: 饼图
 * @FilePath: src/components/Charts/PieChart.vue
 * @version:
-->
<template>
  <div id="PieChart" ref="PieChart"></div>
</template>

<script>
import  Pie  from '@antv/g2plot'
let chartChange
export default
  name: 'PieChart',
  props:
    value:
      type: Array,
      default()
        return []
      ,
    ,
    Height:
      type: Number,
      default: 0,
    ,
  ,
  // 监听
  watch:
    value:
      handler(newVal, oldVal)
        console.log(newVal)
        // 更新数据
        chartChange.changeData(newVal)

        // 销毁后再渲染
        // chartChange.destroy()
        // this.initG2Plot()
      ,
      deep: true, //深度监听
      // immediate: true,
    ,
  ,
  mounted()
    this.initG2Plot()
  ,
  methods:
    initG2Plot()
      chartChange = new Pie(this.$refs.PieChart,
        data: this.value,
        height: this.Height,
        appendPadding: 10,
        angleField: 'value',
        colorField: 'type',
        radius: 0.9,
        innerRadius: 0.64,
        meta:
          value:
            formatter: (v) => `¥ $v`,
          ,
        ,
        legend:
          ayout: 'vertical',
          position: 'right',
          flipPage: true,
          offsetX: -20,
          // title:
          //   text: '产品类别 (销售量占比)',
          //   spacing: 8,
          // ,
          // itemValue:
          //   formatter: (text, item) =>
          //     const items = this.value.filter((d) => d.type === item.value)
          //     return items.length ? '¥' + items.reduce((a, b) => a + b.value, 0) / items.length : '-'
          //   ,
          //   style:
          //     opacity: 0.65,
          //   ,
          // ,
        ,
        label:
          type: 'outer',
          content: 'name - value元 | 占比percentage',
          // type: 'inner',
          // offset: '-50%',
          // autoRotate: false,
          // style:  textAlign: 'center' ,
          // formatter: ( percent ) => `$(percent * 100).toFixed(0)%`,
          style:
            fill: '#000',
          ,
        ,
        // 圆心配置
        statistic:
          title:
            offsetY: -10,
            content: '总计',
          ,
          content:
            offsetY: 10,
            // 解决精度失真问题
            // 方法一:value * 1000000000000
            // 方法二:parseFloat((0.1+0.2).toFixed(5))
            formatter: (value, datum, index, data) =>
              const total = datum.reduce((a, b) =>
                return a + b.value
                // return a + b.value * 1000000000000
              , 0)
              return `¥$parseFloat(total.toFixed(5))`
              // return `¥$total / 1000000000000`
            ,
          ,
        ,
        // 添加 中心统计文本 交互
        interactions: [
           type: 'pie-legend-active' ,
           type: 'element-active' ,
          //  type: 'element-selected' ,
          //
          //   type: 'pie-statistic-active',
          //   cfg:
          //     start: [
          //        trigger: 'element:mouseenter', action: 'pie-statistic:change' ,
          //        trigger: 'legend-item:mouseenter', action: 'pie-statistic:change' ,
          //     ],
          //     end: [
          //        trigger: 'element:mouseleave', action: 'pie-statistic:reset' ,
          //        trigger: 'legend-item:mouseleave', action: 'pie-statistic:reset' ,
          //     ],
          //   ,
          // ,
        ],
      )
      chartChange.render()
    ,
  ,

</script>
以上是关于Vue使用G2Plot-Pie饼图实现数据渲染-和类似0.1+0.2导致的精度问题的主要内容,如果未能解决你的问题,请参考以下文章