多项式回归学习曲线
Posted 劳埃德·福杰
tags:
篇首语:本文由小常识网(cha138.com)小编为大家整理,主要介绍了多项式回归学习曲线相关的知识,希望对你有一定的参考价值。
1.简介
你可以使用线性模型来拟合非线性数据。
一个简单的方法就是将每个特征的幂次方添加为一个新特征,然后在此扩展特征集上训练一个线性模型。这种技术称为多项式回归。
2.举例
y=0.5x^2+x+2,加一些噪声,生成一些非线性数据
import numpy as np
import numpy.random as rnd
import matplotlib.pyplot as plt

np.random.seed(42)

m = 100
X = 6 * np.random.rand(m, 1) - 3
y = 0.5 * X**2 + X + 2 + np.random.randn(m, 1)

plt.plot(X, y, "b.")
plt.xlabel("$x_1$", fontsize=18)
plt.ylabel("$y$", rotation=0, fontsize=18)
plt.axis([-3, 3, 0, 10])
plt.show()
显然,一条直线永远无法正确地拟合此数据。
让我们使用Scikit-Learn的PolynomialFeatures类来转换训练数据,将训练集中每个特征的平方添加为新特征
from sklearn.linear_model import LinearRegression
from sklearn.preprocessing import PolynomialFeatures

poly_features = PolynomialFeatures(degree=2, include_bias=False)
X_poly = poly_features.fit_transform(X) # X_poly现在包含X的原始特征以及该特征的平方

lin_reg = LinearRegression()
lin_reg.fit(X_poly, y)
lin_reg.coef_, lin_reg.intercept_
# 输出:(array([[0.93366893, 0.56456263]]), array([1.78134581]))模型估算结果:y=0.56x^2 + 0.93x + 1.78,而实际上原始函数:y=0.5x^2+x+2+高斯噪声。
我们画下图看看
# 画预测曲线,用np.linspace以均匀步长生成数字序列,这里,-3到3分成100份
# 知道间隔用np.arrange生成序列,不知道间隔,只知道要分多少份用np.linspace
X_new=np.linspace(-3, 3, 100).reshape(100, 1)
X_new_poly = poly_features.transform(X_new)
y_new = lin_reg.predict(X_new_poly)

plt.plot(X, y, "b.")
plt.plot(X_new, y_new, "r-", linewidth=2, label="Predictions")
plt.xlabel("$x_1$", fontsize=18)
plt.ylabel("$y$", rotation=0, fontsize=18)
plt.legend(loc="upper left", fontsize=14)
plt.axis([-3, 3, 0, 10])
plt.show()
当存在多个特征时,多项式回归能够找到特征之间的关系。
PolynomialFeatures还可以将特征的所有组合添加到给定的多项式阶数。
例如,如果有两个特征a和b,则degree=3的PolynomialFeatures不仅会添加特征a^2、a^3、b^2和b^3,还会添加组合ab、a^2b和ab^2。
3.学习曲线
①不同阶数的多项式回归
from sklearn.preprocessing import StandardScaler
from sklearn.pipeline import Pipeline

for style, width, degree in (("g-", 1, 300), ("b--", 2, 2), ("r-+", 2, 1)):
    polybig_features = PolynomialFeatures(degree=degree, include_bias=False)
    std_scaler = StandardScaler()
    lin_reg = LinearRegression()
    polynomial_regression = Pipeline([
            ("poly_features", polybig_features),
            ("std_scaler", std_scaler),
            ("lin_reg", lin_reg),
        ])
    polynomial_regression.fit(X, y)
    y_newbig = polynomial_regression.predict(X_new)
    plt.plot(X_new, y_newbig, style, label=str(degree), linewidth=width)

plt.plot(X, y, "b.", linewidth=3)
plt.legend(loc="upper left")
plt.xlabel("$x_1$", fontsize=18)
plt.ylabel("$y$", rotation=0, fontsize=18)
plt.axis([-3, 3, 0, 10])
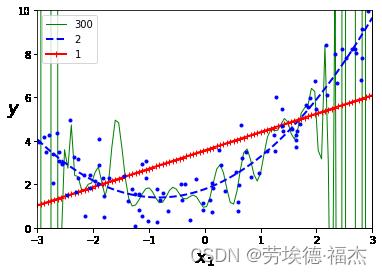
plt.show()
可见,高阶多项式回归模型严重过拟合训练数据,而线性模型则欠拟合,最能泛化的模型是二次模型。但是一开始你不知道数据由什么函数生成,那么如何确定模型的复杂性呢?你如何判断模型是过拟合数据还是欠拟合数据呢?
之前我们使用交叉验证来估计模型的泛化性能。如果模型在训练数据上表现良好,但根据交叉验证的指标泛化较差,则你的模型过拟合。如果两者的表现均不理想,则说明欠拟合。
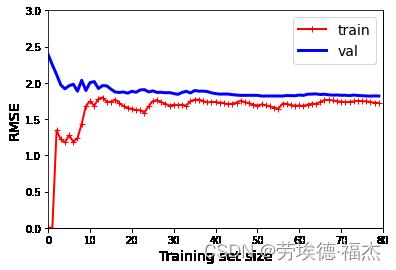
还有一种方法是观察学习曲线:这个曲线绘制的是模型在训练集和验证集上关于训练集大小的性能函数。要生成这个曲线,只需要在不同大小的训练子集上多次训练模型。
②普通线性回归模型的学习曲线
from sklearn.metrics import mean_squared_error
from sklearn.model_selection import train_test_split

def plot_learning_curves(model, X, y):
    X_train, X_val, y_train, y_val = train_test_split(X, y, test_size=0.2, random_state=10)
    train_errors, val_errors = [], []
    for m in range(1, len(X_train) + 1):
        model.fit(X_train[:m], y_train[:m])
        y_train_predict = model.predict(X_train[:m])
        y_val_predict = model.predict(X_val)
        train_errors.append(mean_squared_error(y_train[:m], y_train_predict))
        val_errors.append(mean_squared_error(y_val, y_val_predict))

    plt.plot(np.sqrt(train_errors), "r-+", linewidth=2, label="train")
    plt.plot(np.sqrt(val_errors), "b-", linewidth=3, label="val")
    plt.legend(loc="upper right", fontsize=14)
    plt.xlabel("Training set size", fontsize=14)
    plt.ylabel("RMSE", fontsize=14)

lin_reg = LinearRegression()
plot_learning_curves(lin_reg, X, y)
plt.axis([0, 80, 0, 3])
plt.show()
这种模型是欠拟合的:当训练集中只有一个或两个实例时,模型可以很好地拟合它们,随着将新实例添加到训练集中,它开始学习,验证错误逐渐降低,但是,直线不能很好地对数据进行建模,因此误差最终达到一个平稳的状态。
欠拟合的模型,添加更多训练示例将无济于事,你需要使用更复杂的模型或提供更好的特征。
③相同数据上的10阶多项式模型的学习曲线
from sklearn.pipeline import Pipeline

polynomial_regression = Pipeline([
    ("poly_features", PolynomialFeatures(degree=10, include_bias=False)),
    ("lin_reg", LinearRegression()),
])

plot_learning_curves(polynomial_regression, X, y)
plt.axis([0, 80, 0, 3])
plt.show() 
与线性回归模型相比,训练数据上的误差要低得多。
该模型在训练集上的性能要比在验证集上的好得多,说明模型过拟合。
改善过拟合模型的一种方法是:向其提供更多的训练数据。
以上是关于多项式回归学习曲线的主要内容,如果未能解决你的问题,请参考以下文章