matlab绘制带箭头的图
Posted studyer_domi
tags:
篇首语:本文由小常识网(cha138.com)小编为大家整理,主要介绍了matlab绘制带箭头的图相关的知识,希望对你有一定的参考价值。
clear
clc
close all hidden
%%%%%%%%%%%%%%%%%%%%%%%%%%%%%%
load('iiii.mat')
x=1:length(mmmm);
y=mmmm;
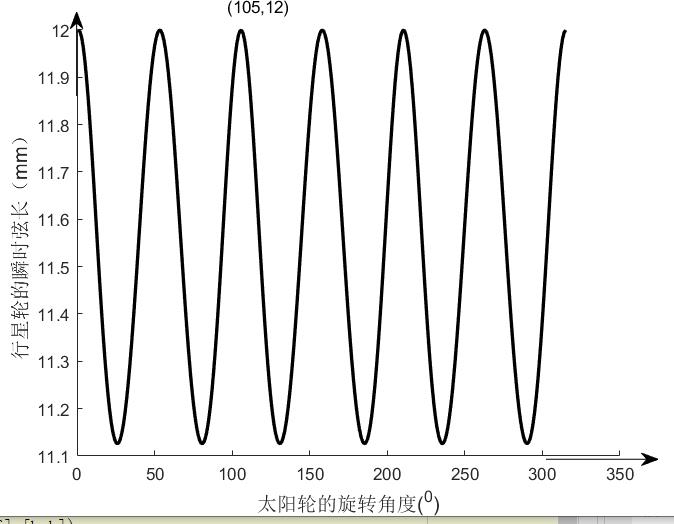
h=plot(x,y);
set(h,'Color','k','LineWidth',2);
set(gca,'box','off');
set(gcf,'color','white');
xlabel('\\theta'),ylabel('tan\\theta')
xlabel('太阳轮的旋转角度(^0)','FontSize',12);
ylabel('行星轮的瞬时弦长(mm)','FontSize',12);
%xlim([0 350]);ylim([13.6 15.4]);
a=0.1295;
b=0.108;
annotation('arrow',[a a],[0.8 0.96]);
annotation('arrow',[0.8 0.96],[b b]);
text(97,12.05,'(105,12)','FontSize',10);

以上是关于matlab绘制带箭头的图的主要内容,如果未能解决你的问题,请参考以下文章