33-Vue之ECharts-仪表盘图
Posted 爱学习de测试小白
tags:
篇首语:本文由小常识网(cha138.com)小编为大家整理,主要介绍了33-Vue之ECharts-仪表盘图相关的知识,希望对你有一定的参考价值。
ECharts-仪表盘图
前言
- 本篇来学习写仪表盘图
仪表盘的特点
- 可以更直观的表现出某个指标的进度或实际情况
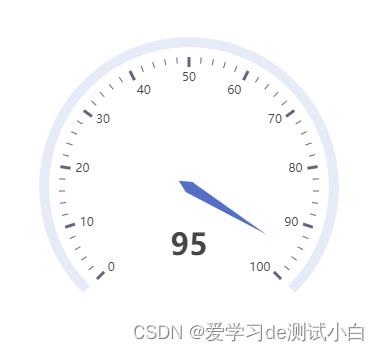
仪表盘的基本实现
- ECharts 最基本的代码结构
- 准备数据, 设置给 series 下的 data
- 在 series 下设置 type:gauge
<!DOCTYPE html>
<html lang="en">

<head>
  <meta charset="UTF-8">
  <meta name="viewport" content="width=device-width, initial-scale=1.0">
  <meta http-equiv="X-UA-Compatible" content="ie=edge">
  <title>仪表盘</title>
  <!-- cdn方式 引入echarts.js文件 -->
  <script src="https://cdn.jsdelivr.net/npm/echarts@5.4.1/dist/echarts.min.js"></script>
</head>

<body>
  <div id='app' style="width: 600px;height:400px"></div>

  <script>
    var mCharts = echarts.init(document.getElementById("app"))
    var option =
      series: [

          type: 'gauge',
          data: [

              value: 95

          ]

      ]

    mCharts.setOption(option)
  </script>
</body>

</html>
- 效果

仪表盘的常见效果
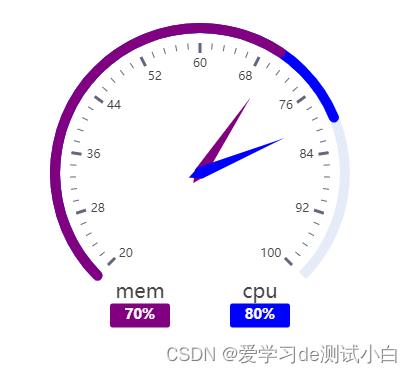
- 数值范围: max min
- 多个指针: 增加data中数组的元素
- 多个指针颜色的差异: itemStyle
<!DOCTYPE html>
<html lang="en">

<head>
    <meta charset="UTF-8">
    <meta name="viewport" content="width=device-width, initial-scale=1.0">
    <meta http-equiv="X-UA-Compatible" content="ie=edge">
    <title>仪表盘</title>
    <!-- cdn方式 引入echarts.js文件 -->
    <script src="https://cdn.jsdelivr.net/npm/echarts@5.4.1/dist/echarts.min.js"></script>
</head>

<body>
<div id='app' style="width: 600px;height:400px"></div>

<script>
    var mCharts = echarts.init(document.getElementById("app"))
    var option =
        series: [

                type: 'gauge',
                data: [
                    // 每一个对象就代表一个指针

                        name: 'mem',
                        value: 70,
                        itemStyle:  // 指针的样式
                            color: 'purple' // 指针的颜色
                        ,
                        title:
                            offsetCenter: ['-40%', '80%']
                        ,
                        detail:
                            offsetCenter: ['-40%', '95%']

                    ,

                        name: 'cpu',
                        value: 80,
                        itemStyle:
                            color: 'blue'
                        ,
                        title:
                            offsetCenter: ['40%', '80%']
                        ,
                        detail:
                            offsetCenter: ['40%', '95%']

                    ,

                ],
                detail:    // 数值文案样式
                    width: 40,
                    height: 14,
                    fontSize: 14,
                    color: '#fff',
                    backgroundColor: 'auto',
                    borderRadius: 3,
                    formatter: 'value%'
                ,
                title:   // name 文字大小
                    fontSize: 20
                ,
                progress:   // 仪表盘数据样式
                    show: true,
                    overlap: true,
                    roundCap: true
                ,
                max: 100,
                min: 20 // min max 控制仪表盘数值范围

        ]

    mCharts.setOption(option)
</script>
</body>

</html>
- 效果

以上是关于33-Vue之ECharts-仪表盘图的主要内容,如果未能解决你的问题,请参考以下文章