沃趣科技prometheus配置MySQL邮件报警
Posted woqutechteam
tags:
篇首语:本文由小常识网(cha138.com)小编为大家整理,主要介绍了沃趣科技prometheus配置MySQL邮件报警相关的知识,希望对你有一定的参考价值。
沃趣科技作为国内领先的数据库云平台解决方案提供商,一直致力于企业级数据库云平台产品的研发,为用户提供高性能、高可用、可扩展的的数据库云环境及不同业务场景需求的数据库平台,满足客户对极致性能、数据安全、容灾备份、业务永续等需求。沃趣科技凭借专业的团队,优质的产品,前沿的技术,贴心的服务赢得了客户的信任与尊重,也获得了市场的认同。
前两期文章(引用沃趣技术——《prometheus监控多个MySQL实例》、《构建狂拽炫酷屌的MySQL监控平台》)介绍了prometheus、grafana、exporter的安装以及集中监控mysql节点的方法,这篇文章介绍一下prometheus的邮件报警配置。
alertmanager下载
prometheus报警配置需要用到alertmanager组件,这个组件可以到prometheus官网上进行下载。
https://prometheus.io/download/
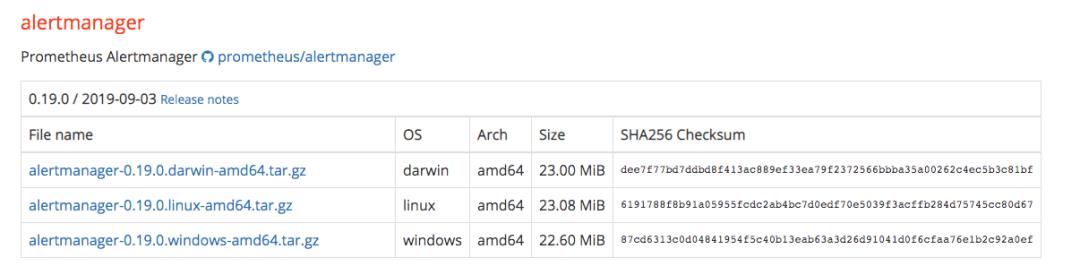
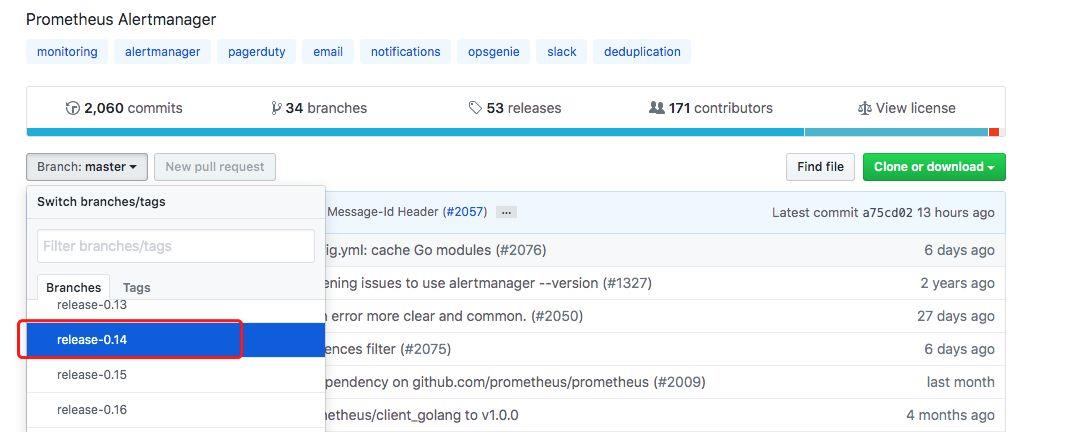
由于最新版本的alertmanager组件配置邮箱通讯存在一些问题,我们这里选择在github上下载0.14版本的alertmanager。
https://github.com/prometheus/alertmanager
附具体下载地址:
https://github.com/prometheus/alertmanager/releases/download/v0.14.0/alertmanager-0.14.0.linux-amd64.tar.gz
alertmanager安装配置
将下载的alertmanager包进行解压安装。
tar -xf alertmanager-0.14.0.linux-amd64.tar.gz
mv alertmanager-0.14.0.linux-amd64 /data/alertmanager
编辑alertmanager的配置文件,添加邮箱信息。
# cd /data/alertmanager
# cat alertmanager.yml
global:
  smtp_smarthost: smtp.exmail.xxx.com:465 # 发件人邮箱smtp地址
  smtp_auth_username: xxxx@xxx.com # 发件人邮箱账号
  smtp_from: xxx@xxx.com # 发件人邮箱账号
  smtp_auth_password: xxxxxx # 发件人邮箱密码
  resolve_timeout: 5m
  smtp_require_tls: false

route:
  # group_by: ['alertname'] # 报警分组依据
  group_wait: 10s # 最初即第一次等待多久时间发送一组警报的通知
  group_interval: 10s # 在发送新警报前的等待时间
  repeat_interval: 1m # 发送重复警报的周期 对于email配置中多频繁
  receiver: 'email'

receivers:
- name: email
  email_configs:
  - send_resolved: true
    to: xxx@xxx.com # 收件人邮箱账号
启动alertmanager。
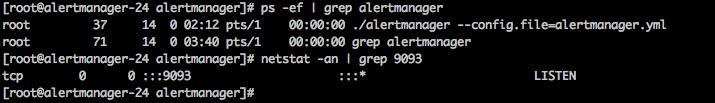
# cd /data/alertmanager
./alertmanager --config.file=alertmanager.yml &
alertmanager的默认端口为9093。
prometheus配置
在prometheus目录下编辑报警模版alert_rules.yml,添加一些自定义报警项。
# cd /data/prometheus
# cat alert_rules.yml
groups:
- name: MySQL-rules
  rules:
  - alert: MySQL Status # 告警名称
    expr: up == 0
    for: 5s # 满足告警条件持续时间多久后,才会发送告警
    annotations: # 解析项,详细解释告警信息
      summary: "$labels.instance: MySQL has stop !!!"
      value: "$value"
      alertname: "MySQL数据库停止运行"
      description: "检测MySQL数据库运行状态"
      message: 当前数据库实例$labels.instance已经停止运行,请及时处理
  - alert: MySQL Slave IO Thread Status # 告警名称
    expr: mysql_slave_status_slave_io_running == 0
    for: 5s # 满足告警条件持续时间多久后,才会发送告警
    annotations: # 解析项,详细解释告警信息
      summary: "$labels.instance: MySQL Slave IO Thread has stop !!!"
      value: "$value"
      alertname: "MySQL主从IO线程停止运行"
      description: "检测MySQL主从IO线程运行状态"
      message: 当前数据库实例$labels.instance IO线程已经停止运行,请及时处理
  - alert: MySQL Slave SQL Thread Status # 告警名称
    expr: mysql_slave_status_slave_sql_running == 0
    for: 5s # 满足告警条件持续时间多久后,才会发送告警
    annotations: # 解析项,详细解释告警信息
      summary: "$labels.instance: MySQL Slave SQL Thread has stop !!!"
      value: "$value"
      alertname: "MySQL主从SQL线程停止运行"
      description: "检测MySQL主从SQL线程运行状态"
      message: 当前数据库实例$labels.instance SQL线程已经停止运行,请及时处理
  - alert: MySQL Slave Delay Status # 告警名称
    expr: mysql_slave_status_sql_delay == 30
    for: 5s # 满足告警条件持续时间多久后,才会发送告警
    annotations: # 解析项,详细解释告警信息
      summary: "$labels.instance: MySQL Slave Delay has more than 30s !!!"
      value: "$value"
      alertname: "MySQL主从延时过大"
      description: "检测MySQL主从延时状态"
      message: 当前数据库实例$labels.instance 主从延时状态已经超过30s,请及时处理
在prometheus目录下编辑prometheus的配置文件,将监控的配置信息添加到prometheus.yml。
# cd /data/prometheus
# cat prometheus.yml
# my global config
global:
  scrape_interval: 15s # Set the scrape interval to every 15 seconds. Default is every 1 minute.
  evaluation_interval: 15s # Evaluate rules every 15 seconds. The default is every 1 minute.
  # scrape_timeout is set to the global default (10s).

# Alertmanager configuration
alerting:
  alertmanagers:
  - static_configs:
    - targets:
      - 172.18.0.24:9093 # 对应启动的altermanager节点的9093端口

# Load rules once and periodically evaluate them according to the global 'evaluation_interval'.
rule_files:
  - "alert_rules.yml" # 对应前面编辑的报警模版alert_rules.yml文件

# A scrape configuration containing exactly one endpoint to scrape:
scrape_configs:
  - file_sd_configs:
    - files:
      - mysql.yml
    job_name: MySQL
    metrics_path: /metrics
    relabel_configs:
    - source_labels: [__address__]
      regex: (.*)
      target_label: __address__
      replacement: $1
编辑完成后,重新加载一下配置更改。
kill -HUP [prometheus PID]验证邮件报警
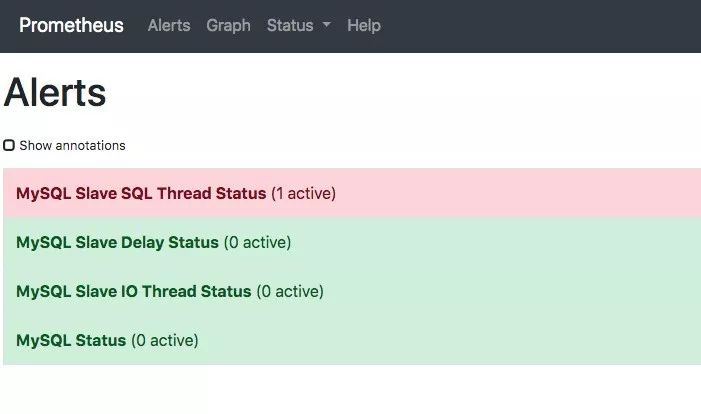
登陆prometheus的web页面,查看报警信息。
浏览器输入Prometheus_IP:9090 ,可以看到各个报警项的状态。
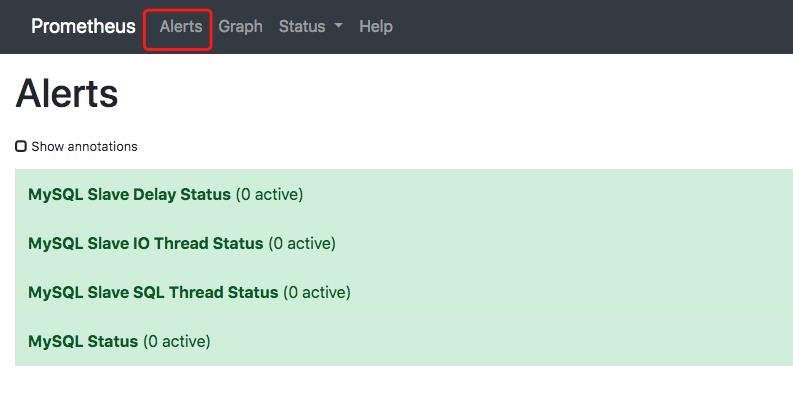
停掉主从线程,模拟触发报警。

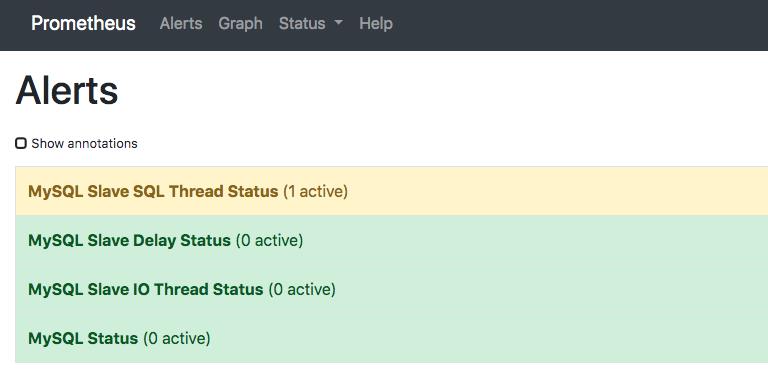
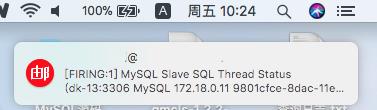
Slave SQL线程停掉后,报警项颜色变成黄色,持续时间超过定义的持续时间后,颜色变红,并发送邮件。
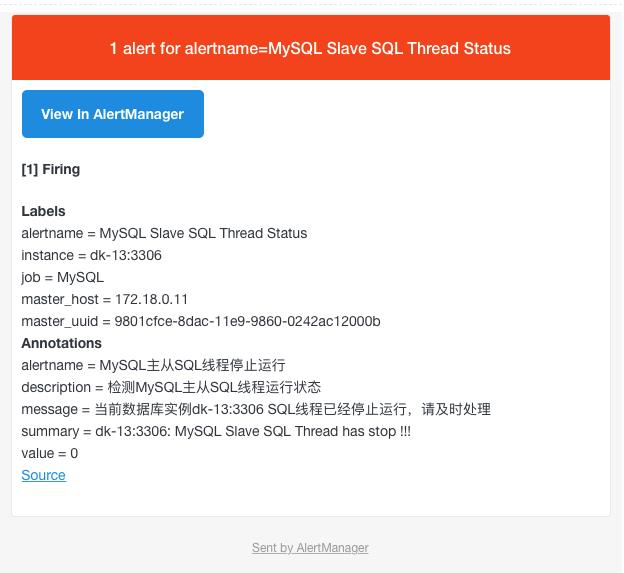
收到报警邮件。
| 作者简介
李文航·沃趣科技数据库技术专家
熟悉MySQL体系结构和工作原理、SQL调优、数据库故障诊断、数据迁移、备份恢复。
以上是关于沃趣科技prometheus配置MySQL邮件报警的主要内容,如果未能解决你的问题,请参考以下文章