可视化篇:Echarts实现区域人群密度实时监控
Posted 杨铖
tags:
篇首语:本文由小常识网(cha138.com)小编为大家整理,主要介绍了可视化篇:Echarts实现区域人群密度实时监控相关的知识,希望对你有一定的参考价值。
perface
一些工作经验的整理,欢迎留言探讨。
Echarts2的时候曾试过在百度地图背景上加timeline属性,但发现不支持遂以失败告终,e3后来的bmap.js扩展,使得之前的设想得以实现。
下面是《可视化篇:效果图》中第10、11张的实现说明
其中:
1.下图展示数据均为模拟数据
2.使用的echarts版本为3.2.3,关于如何引入百度地图,参考《Echarts3.0引入百度地图》
3.此部分为热力图实时变化,可以通过扩展实现多区域实时变化,echarts3支持十万级别数据渲染,但是会有点慢
下面是一些实现细节:
1. 关于人群密度变化的思考
现阶段对一些景点区域,以及一些人流量相对较大的区域的监控预警是十分重要的一种事故预防措施,除了一些冷冰冰的数字呈现,我们仍可以通过一些相对醒目的手法来提高预警技巧,比如将要讲的人群密度热力分布,通过加上时间轴,以及地图渲染,我们可以清晰地了解在什么时间,什么地点,什么情况,当然百度地图一直就有这种功能服务,现在我们只是把他拿出来讲具体如何实现,仅此而已。
2. option 设置
在含有timeline属性的echarts图表中,有两个关键的实现基础,baseOption 和 options.
1. option.baseOption
option.baseOption,顾名思义就是图标的一些基础选项,由于在timeline属性环境下,option必须分成两家,1家baseOption承载之前option的属性设置,另一家options则对应到timeline属性下各个时间段
那么baseOption下都应该怎么设置呢?
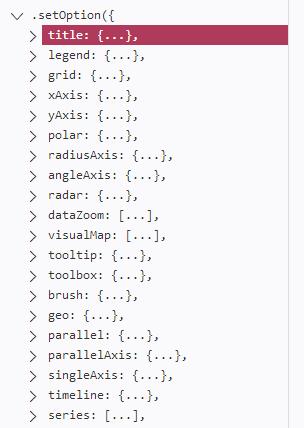
图中任何属性都是可以写在baseOption里,图为echarts3配置文档。
如本篇例子中的代码:
    baseOption:
        title:
            text: "区域人群实时密度监控--花城广场",
            link: 'http://blog.csdn.net/yc_1993',
            subtext: "数据模拟,仅为测试",
            left: 'center',
            top: 20,
            textStyle:
                color: 'red',
                fontSize: 20
            ,
            subtextStyle:
                color: 'white',
                fontSize: 16

        ,
        timeline:
            autoPlay:true,
            data: ["7:00","8:00","9:00","10:00","11:00","12:00","13:00","14:00","15:00","16:00","17:00"],
            axisType: 'category',
            padding: [5,5,5,5],
            playInterval:1500,
            lineStyle:color:'white',
            label:
                normal:
                    textStyle:
                        color: 'white',
                        fontSize: 13


        ,
        bmap:
        center: [113.331788,23.124235],
        zoom: 16,
        roam: true,
        mapStyle:
                       styleJson: [

                    'featureType': 'land',     //调整土地颜色
                    'elementType': 'geometry',
                    'stylers':
                              'color': '#081734'

          ,

                    'featureType': 'building',   //调整建筑物颜色
                    'elementType': 'geometry',
                    'stylers':
                              'color': '#04406F'

          ,

                    'featureType': 'building',   //调整建筑物标签是否可视
                    'elementType': 'labels',
                    'stylers':
                    'visibility': 'off'

          ,

                    'featureType': 'highway',     //调整高速道路颜色
                    'elementType': 'geometry',
                    'stylers':
                    'color': '#015B99'

          ,

                    'featureType': 'highway',    //调整高速名字是否可视
                    'elementType': 'labels',
                    'stylers':
                    'visibility': 'off'

          ,

                    'featureType': 'arterial',   //调整一些干道颜色
                    'elementType': 'geometry',
                    'stylers':
                    'color':'#003051'

          ,

                    'featureType': 'arterial',
                    'elementType': 'labels',
                    'stylers':
                    'visibility': 'off'

          ,

                    'featureType': 'green',
                    'elementType': 'geometry',
                    'stylers':
                    'visibility': 'off'

          ,

                    'featureType': 'water',
                    'elementType': 'geometry',
                    'stylers':
                              'color': '#044161'

          ,

                    'featureType': 'subway',    //调整地铁颜色
                    'elementType': 'geometry.stroke',
                    'stylers':
                    'color': '#003051'

          ,

                    'featureType': 'subway',
                    'elementType': 'labels',
                    'stylers':
                    'visibility': 'off'

          ,

                    'featureType': 'railway',
                    'elementType': 'geometry',
                    'stylers':
                    'visibility': 'off'

          ,

                    'featureType': 'railway',
                    'elementType': 'labels',
                    'stylers':
                    'visibility': 'off'

          ,

                    'featureType': 'all',     //调整所有的标签的边缘颜色
                    'elementType': 'labels.text.stroke',
                    'stylers':
                              'color': '#313131'

          ,

                    'featureType': 'all',     //调整所有标签的填充颜色
                    'elementType': 'labels.text.fill',
                    'stylers':
                              'color': '#FFFFFF'

          ,

                    'featureType': 'manmade',
                    'elementType': 'geometry',
                    'stylers':
                    'visibility': 'off'

          ,

                    'featureType': 'manmade',
                    'elementType': 'labels',
                    'stylers':
                    'visibility': 'off'

          ,

                    'featureType': 'local',
                    'elementType': 'geometry',
                    'stylers':
                    'visibility': 'off'

          ,

                    'featureType': 'local',
                    'elementType': 'labels',
                    'stylers':
                    'visibility': 'off'

          ,

                    'featureType': 'subway',
                    'elementType': 'geometry',
                    'stylers':
                              'lightness': -65

          ,

                    'featureType': 'railway',
                    'elementType': 'all',
                    'stylers':
                              'lightness': -40

          ,

                    'featureType': 'boundary',
                    'elementType': 'geometry',
                    'stylers':
                              'color': '#8b8787',
                              'weight': '1',
                              'lightness': -29

          ]
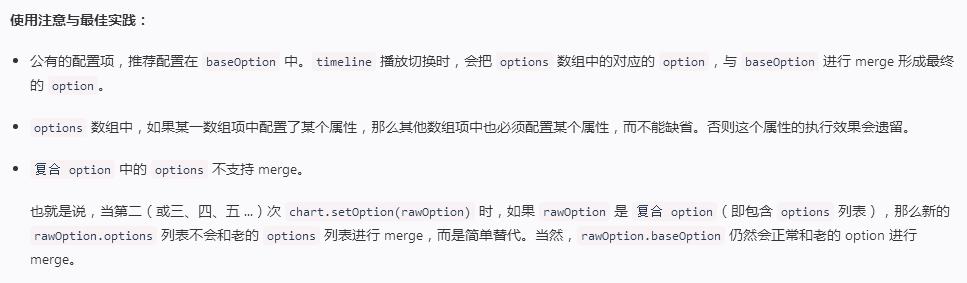
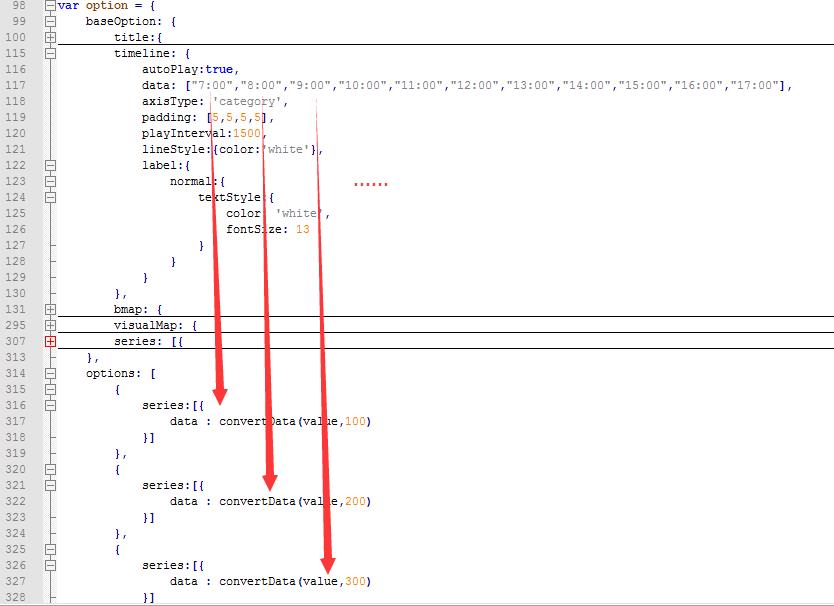
注意到上述代码中的timeline属性,里面有data[…]这一设置,设置中每一项均对应下文options中的每个…,同时baseOption为基础设置,应该把 不随着时间变化而变化的 共性的东西 放在baseOption里,好好理解加粗字。
2. option.options
options具体形式为:
options:[
    时间刻度一对应的设置,
    时间刻度二对应的设置,
    时间刻度二对应的设置,
    ...
    ]
对应到本篇例子中为:
options: [

            series:[
                data : convertData(value,100)
            ]
        ,

            series:[
                data : convertData(value,200)
            ]
        ,

            series:[
                data : convertData(value,300)
            ]
        ,

            series:[
                data : convertData(value,400)
            ]
        ,

            series:[
                data : convertData(value,500)
            ]
        ,

            series:[
                data : convertData(value,600)
            ]
        ,

            series:[
                data : convertData(value,900)
            ]
        ,

            series:[
                data : convertData(value,700)
            ]
        ,

            series:[
                data : convertData(value,600)
            ]
        ,

            series:[
                data : convertData(value,500)
            ]
        ,

            series:[
                data: convertData(value,300)
            ]

    ]
每个中括号对应timeline.data中每个值。
注意到echarts3官网配置文档中有这么一段话:
这里我只说第三点,其意思就是,随着时间的变化,新的效果不会在旧的效果上进行融合展示,而是重新刷新进而覆盖,这使得本来我想展示轨迹迁徙的,但是看不到走过的痕迹了。
3. timeline 属性设置
timeline属性与配置文档其他内容相似,关键在于baseOption.timeline.data 中每个数值对应 options中每个列表。
为更加明显突出,做了个对指引图:
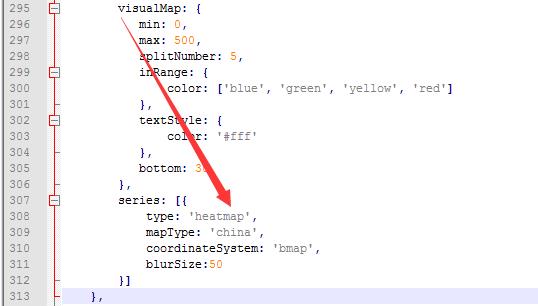
4. heatmap 属性设置
heatmap 是series下一种效果,设置参考官网配置文档即可,但须注意的是,在将series.type设置为heatmap的同时,仍需在series的外部指定visualMap,关于visualMap的属性设置,官网配置文档也写得很清楚,贴个图说明下:
5. 过程代码
1. 首页,一些引用说明
如下代码
<html>
    <head>
        <meta charset="utf-8">
        <style type="text/css">
            body
                margin: 0;

            #main
                height: 100%;

        </style>
    </head>
    <body>
        <div id="main"></div>
        <script src="./echarts/echarts.js"></script>
        <script src="./js/bmap.js"></script>
        <script type="text/javascript" src="http://api.map.baidu.com/api?v=2.0&ak=53oVIOgmSIejwV7EfphpgTynOZbIiVYu"></script>
        <script src="./js/example4.js"></script>
    </body>
</html>
2. example4.js echarts效果脚本
var myChart = echarts.init(document.getElementById('main'));
var geoCoordMap =
'p1':[113.331788,23.121235],
'p2':[113.332788,23.121335],
'p3':[113.330188,23.122135],
'p4':[113.33128,23.123135],
'p5':[113.33104,23.120135],
'p6':[113.3342,23.1222135],
'p7':[113.3333,23.1235],
'p8':[113.332288,23.124435],
'p9':[113.334588,23.120035],
'p10':[113.333288,23.119935],
'p11':[113.335688,23.11835],
'p12':[113.337888,23.1210135],
'p13':[113.330188,23.121935],
'p14':[113.329088,23.120135],
'p15':[113.333988,23.120035],
'p16':[113.331588,23.122235],
'p17':[113.331688,23.121335],
'p18':[113.333388,23.124435],
'p19':[113.334488,23.125535],
'p20':[113.335588,23.123335],
'p21':[113.331788,23.121235],
'p22':[113.332788,23.121335],
'p23':[113.330188,23.122135],
'p24':[113.33128,23.123135],
'p25':[113.33104,23.120135],
'p26':[113.3342,23.1222135],
'p27':[113.3333,23.1235],
'p28':[113.332288,23.124435],
'p29':[113.334588,23.120035],
'p30':[113.333288,23.119935],
'p31':[113.335688,23.11835],
'p32':[113.337888,23.1210135],
'p33':[113.330188,23.121935],
'p34':[113.329088,23.120135],
'p35':[113.333988,23.120035],
'p36':[113.331588,23.122235],
'p37':[113.331688,23.121335],
'p38':[113.333388,23.124435],
'p39':[113.334488,23.125535],
'p40':[113.335588,23.123335]
;
var value = [
name:'p1',value:100,
name:'p2',value:120,
name:'p3',value:130,
name:'p4',value:122,
name:'p5',value:144,
name:'p6',value:100,
name:'p7',value:156,
name:'p8',value:199,
name:'p9',value:122,
name:'p10',value:100,
name:'p11',value:140,
name:'p12',value:140,
name:'p13',value:143,
name:'p14',value:199,
name:'p15',value:111,
name:'p16',value:133,
name:'p17',value:155,
name:'p18',value:135,
name:'p19',value:210,
name:'p20',value:229,
name:'p21',value:100,
name:'p22',value:120,
name:'p23',value:130,
name:'p24',value:122,
name:'p25',value:144,
name:'p26',value:100,
name:'p27',value:156,
name:'p28',value:199,
name:'p29',value:122,
name:'p30',value:100,
name:'p31',value:100,
name:'p32',value:120,
name:'p33',value:130,
name:'p34',value:122,
name:'p35',value:144,
name:'p36',value:100,
name:'p37',value:156,
name:'p38',value:199,
name:'p39',value:122,
name:'p40',value:100
];

var convertData = function (data,n)
    var res = [];
    for (var i = 0; i < data.length; i++)
        var geoCoord = geoCoordMap[data[i].name];
        if (geoCoord)
            res.push(geoCoord.concat(data[i].value+ (Math.random()-0.5)*n ));


    return res;
;

var option =
    baseOption:
        title:
            text: "区域人群实时密度监控--花城广场",
            link: 'http://blog.csdn.net/yc_1993',
            subtext: "数据模拟,仅为测试",
            left: 'center',
            top: 20,
            textStyle:
                color: 'red',
                fontSize: 20
            ,
            subtextStyle:
                color: 'white',
                fontSize: 16

        ,
        timeline:
            autoPlay:true,
            data: ["7:00","8:00","9:00","10:00","11:00","12:00","13:00","14:00","15:00","16:00","17:00"],
            axisType: 'category',
            padding: [5,5,5,5],
            playInterval:1500,
            lineStyle:color:'white',
            label:
                normal:
                    textStyle:
                        color: 'white',
                        fontSize: 13


        ,
        bmap:
        center: [113.331788,23.124235],
        zoom: 16,
        roam: true,
        mapStyle:
                       styleJson: [

                    'featureType': 'land',     //调整土地颜色
                    'elementType': 'geometry',
                    'stylers':
                              'color': '#081734'

          ,

                    'featureType': 'building',   //调整建筑物颜色
                    'elementType': 'geometry',
                    'stylers':
                              'color': '#04406F'

          ,

                    'featureType': 'building',   //调整建筑物标签是否可视
                    'elementType': 'labels',
                    'stylers':
                    'visibility': 'off'

          ,

                    'featureType': 'highway',     //调整高速道路颜色
                    'elementType': 'geometry',
                    'stylers':
                    'color': '#015B99'

          ,

                    'featureType': 'highway',    //调整高速名字是否可视
                    'elementType': 'labels',
                    'stylers':
                    'visibility': 'off'

          ,

                    'featureType': 'arterial',   //调整一些干道颜色
                    'elementType': 'geometry',
                    'stylers':
                    'color':'#003051'

          ,

                    'featureType': 'arterial',
                    'elementType': 'labels',
                    'stylers':
                    'visibility': 'off'

          ,

                    'featureType': 'green',
                    'elementType': 'geometry',
                    'stylers':
                    'visibility': 'off'

          ,

                    'featureType': 'water',
                    'elementType': 'geometry',
                    'stylers':
                              'color': '#044161'

          ,

                    'featureType': 'subway',    //调整地铁颜色
                    'elementType': 'geometry.stroke',
                    'stylers':
                    'color': '#003051'

          ,

                    'featureType': 'subway',
                    'elementType': 'labels',
                    'stylers':
                    'visibility': 'off'

          ,

                    'featureType': 'railway',
                    'elementType': 'geometry',
                    'stylers':
                    'visibility': 'off'

          ,

                    'featureType': 'railway',
                    'elementType': 'labels',
                    'stylers':
                    'visibility': 'off'

          ,

                    'featureType': 'all',     //调整所有的标签的边缘颜色
                    'elementType': 'labels.text.stroke',
                    'stylers':
                              'color': '#313131'

          ,

                    'featureType': 'all',     //调整所有标签的填充颜色
                    'elementType': 'labels.text.fill',
                    'stylers':
                              'color': '#FFFFFF'

          ,

                    'featureType': 'manmade',
                    'elementType': 'geometry',
                    'stylers':
                    'visibility': 'off'

          ,

                    'featureType': 'manmade',
                    'elementType': 'labels',
                    'stylers':
                    'visibility': 'off'

          ,

                    'featureType': 'local',
                    'elementType': 'geometry',
                    'stylers':
                    'visibility': 'off'

          ,

                    'featureType': 'local',
                    'elementType': 'labels',
                    'stylers':
                    'visibility': 'off'

          ,

                    'featureType': 'subway',
                    'elementType': 'geometry',
                    'stylers':
                              'lightness': -65

          ,

                    'featureType': 'railway',
                    'elementType': 'all',
                    'stylers':
                              'lightness': -40

          ,

                    'featureType': 'boundary',
                    'elementType': 'geometry',
                    'stylers':
                              'color': '#8b8787',
                              'weight': '1',
                              'lightness': -29

          ]

        ,
        visualMap:
           min: 0,
           max: 500,
           splitNumber: 5,
           inRange:
               color: ['blue', 'green', 'yellow', 'red']
           ,
           textStyle:
               color: '#fff'
           ,
           bottom: 30
        ,
        series: [
            type: 'heatmap',
            mapType: 'china',
            coordinateSystem: 'bmap',
            blurSize:50
        ]
    ,
    options: [

            series:[
                data : convertData(value,100)
            ]
        ,

            series:[
                data : convertData(value,200)
            ]
        ,

            series:[
                data : convertData(value,300)
            ]
        ,

            series:[
                data : convertData(value,400)
            ]
        ,

            series:[
                data : convertData(value,500)
            ]
        ,

            series:[
                data : convertData(value,600)
            ]
        ,

            series:[
                data : convertData(value,900)
            ]
        ,

            series:[
                data : convertData(value,700)
            ]
        ,

            series:[
                data : convertData(value,600)
            ]
        ,

            series:[
                data : convertData(value,500)
            ]
        ,

            series:[
                data: convertData(value,300)
            ]

    ]

// 使用刚指定的配置项和数据显示图表。
myChart.setOption(option);
复制可运行。
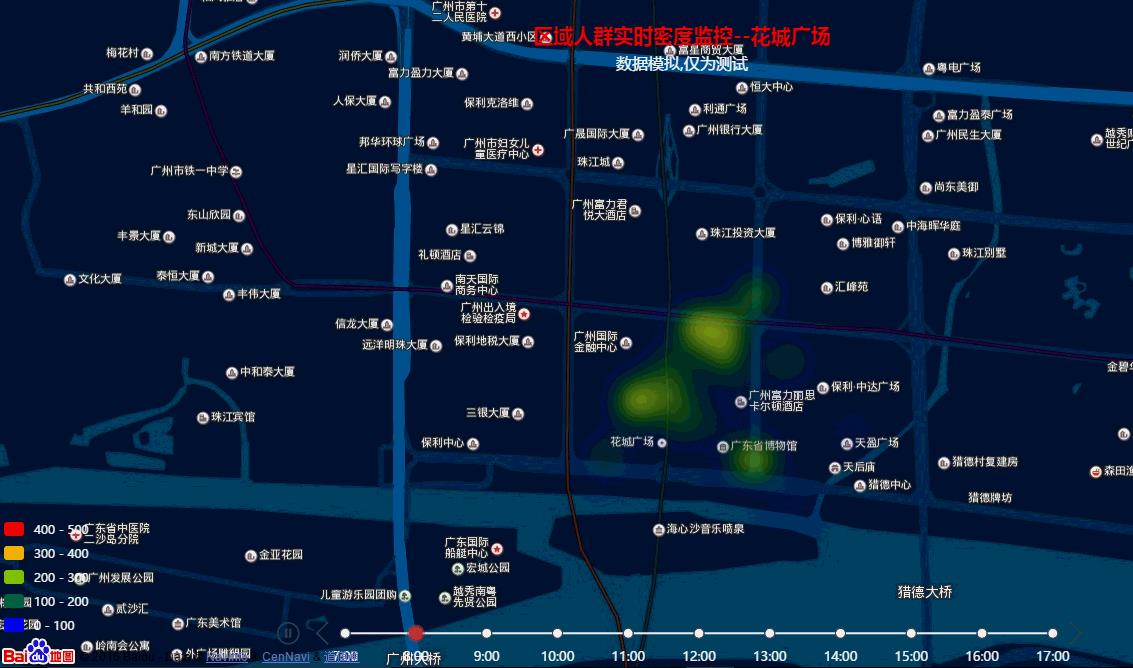
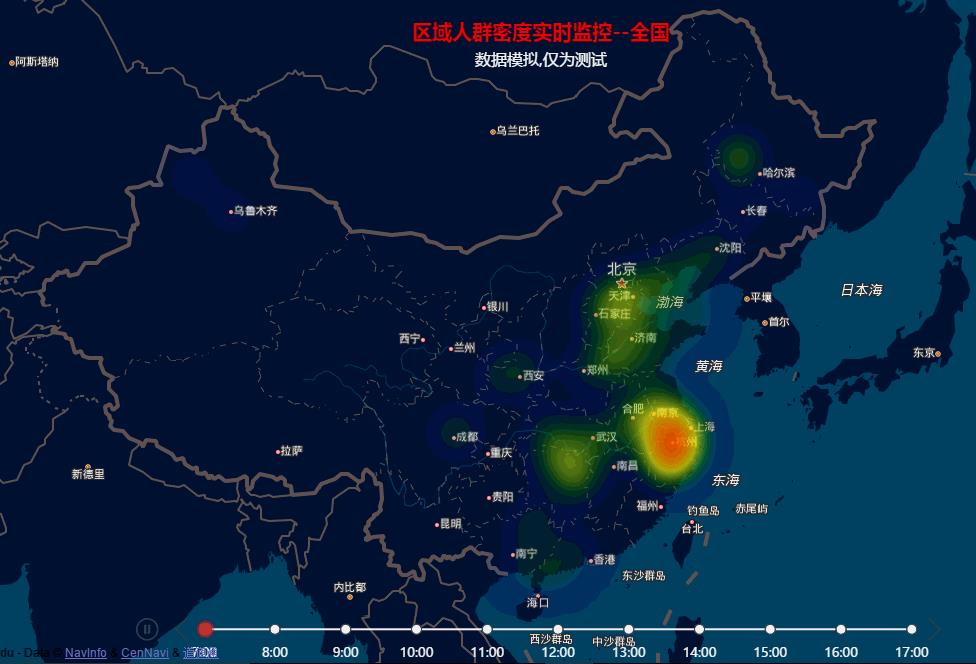
6. 效果图
区域人群密度实时监控(景点)
区域人群密度实时监控(全国)
有任何疑问可以留言讨论,谢谢。
以上是关于可视化篇:Echarts实现区域人群密度实时监控的主要内容,如果未能解决你的问题,请参考以下文章