MATLAB | 给热图整点花哨操作(三角,树状图,分组图)
Posted slandarer
tags:
篇首语:本文由小常识网(cha138.com)小编为大家整理,主要介绍了MATLAB | 给热图整点花哨操作(三角,树状图,分组图)相关的知识,希望对你有一定的参考价值。
前段时间写的特殊热图绘制函数迎来大更新,基础使用教程可以看看这一篇:
https://slandarer.blog.csdn.net/article/details/129292679
原本的绘图代码几乎完全不变,主要是增添了很多新的功能!!!

工具函数完整代码放在最后,但还是建议大家直接去fileexchange或者gitee下载,因为还包含一些素材包(主要是slanCM包),当然也可以单独去下载slanCM包不过麻烦些:
本文项目gitee
https://gitee.com/slandarer/matlab-special-heatmap
slanCM所在gitee
https://gitee.com/slandarer/slanColor
新版新增功能
6 三角化
此部分所使用数据:
% 随便捏造了点数据(Made up some data casually)
X=randn(20,15)+[(linspace(-1,2.5,20)').*ones(1,6),(linspace(.5,-.7,20)').*ones(1,5),(linspace(.9,-.2,20)').*ones(1,4)];
% 求相关系数矩阵(Get the correlation matrix)
Data=corr(X);
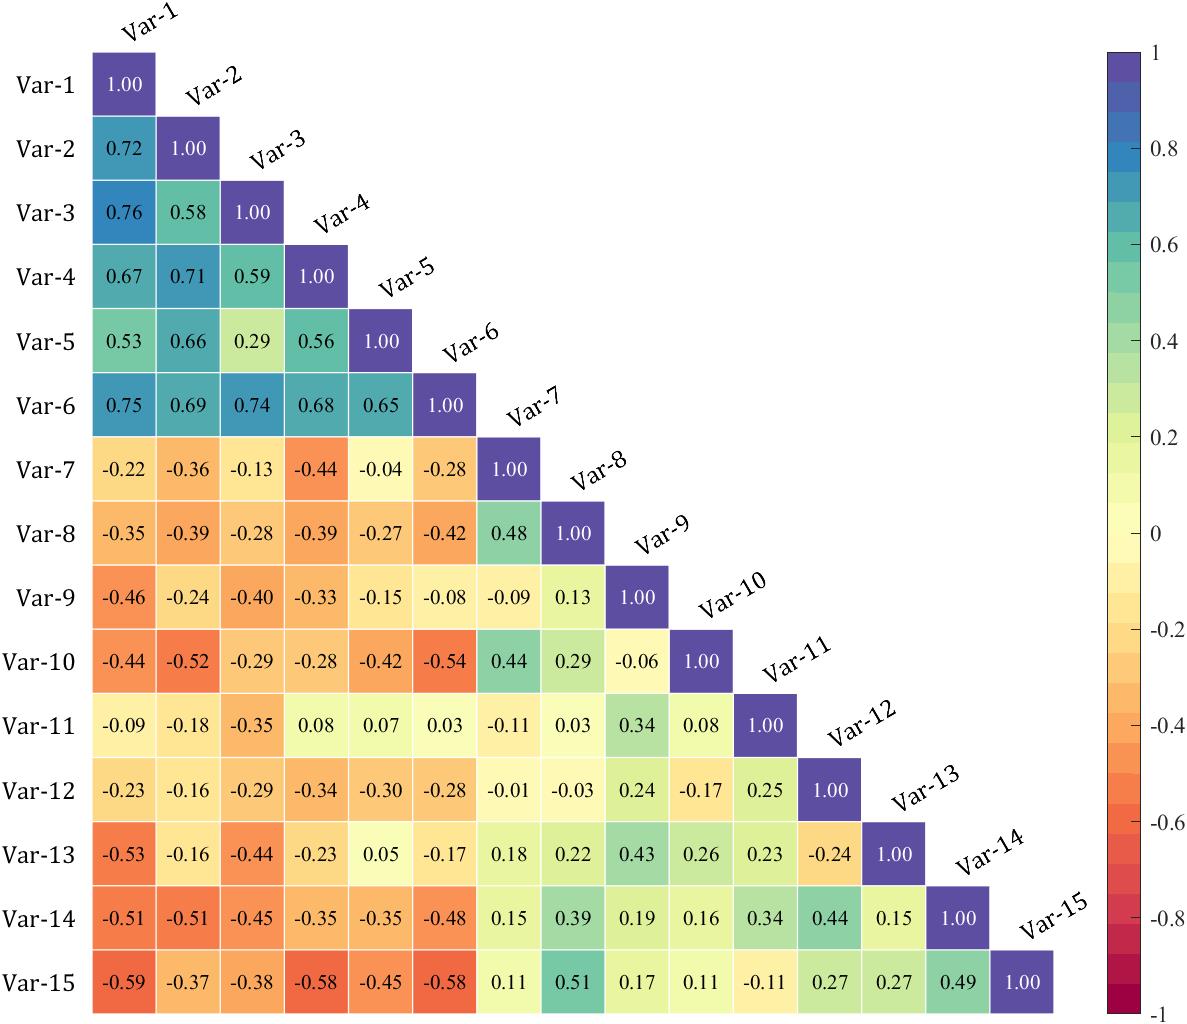
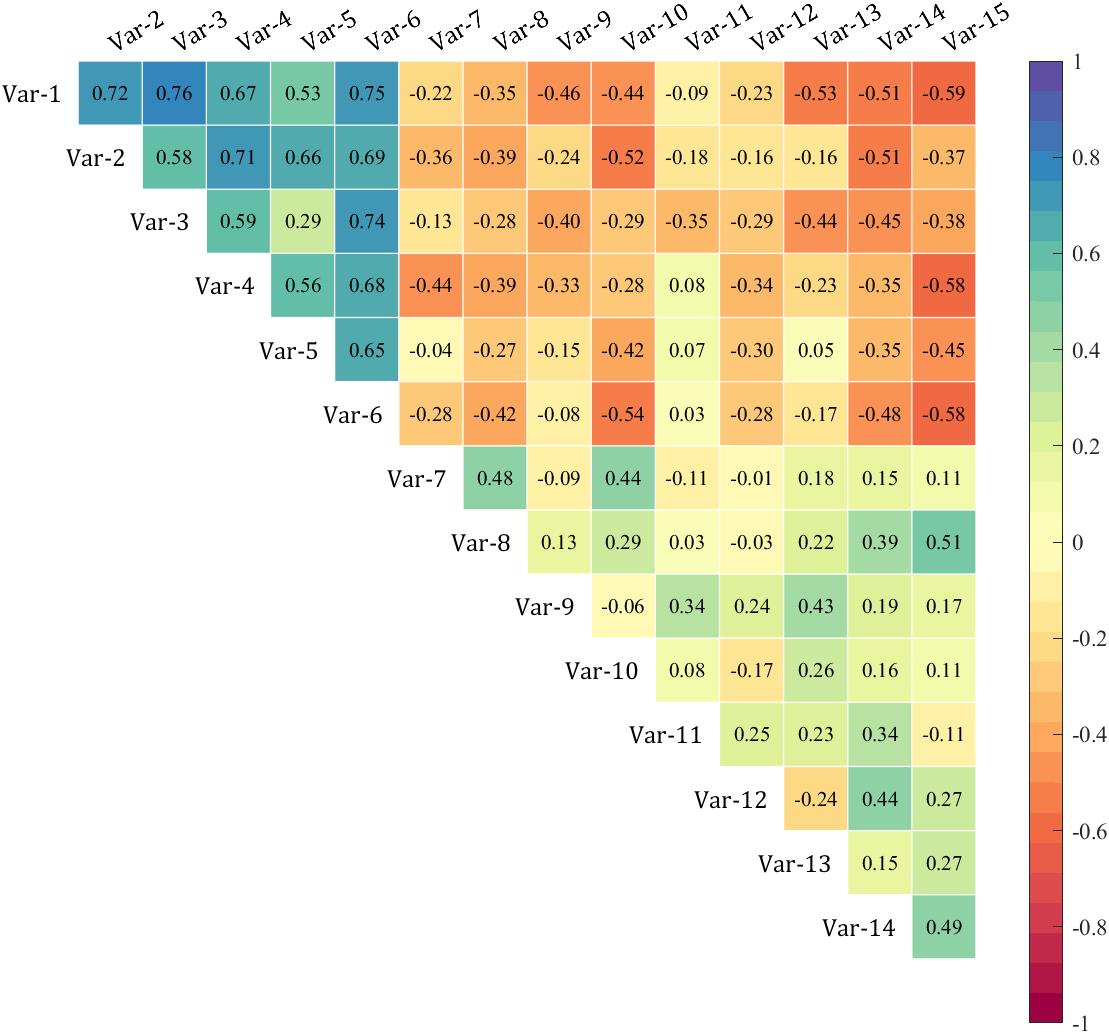
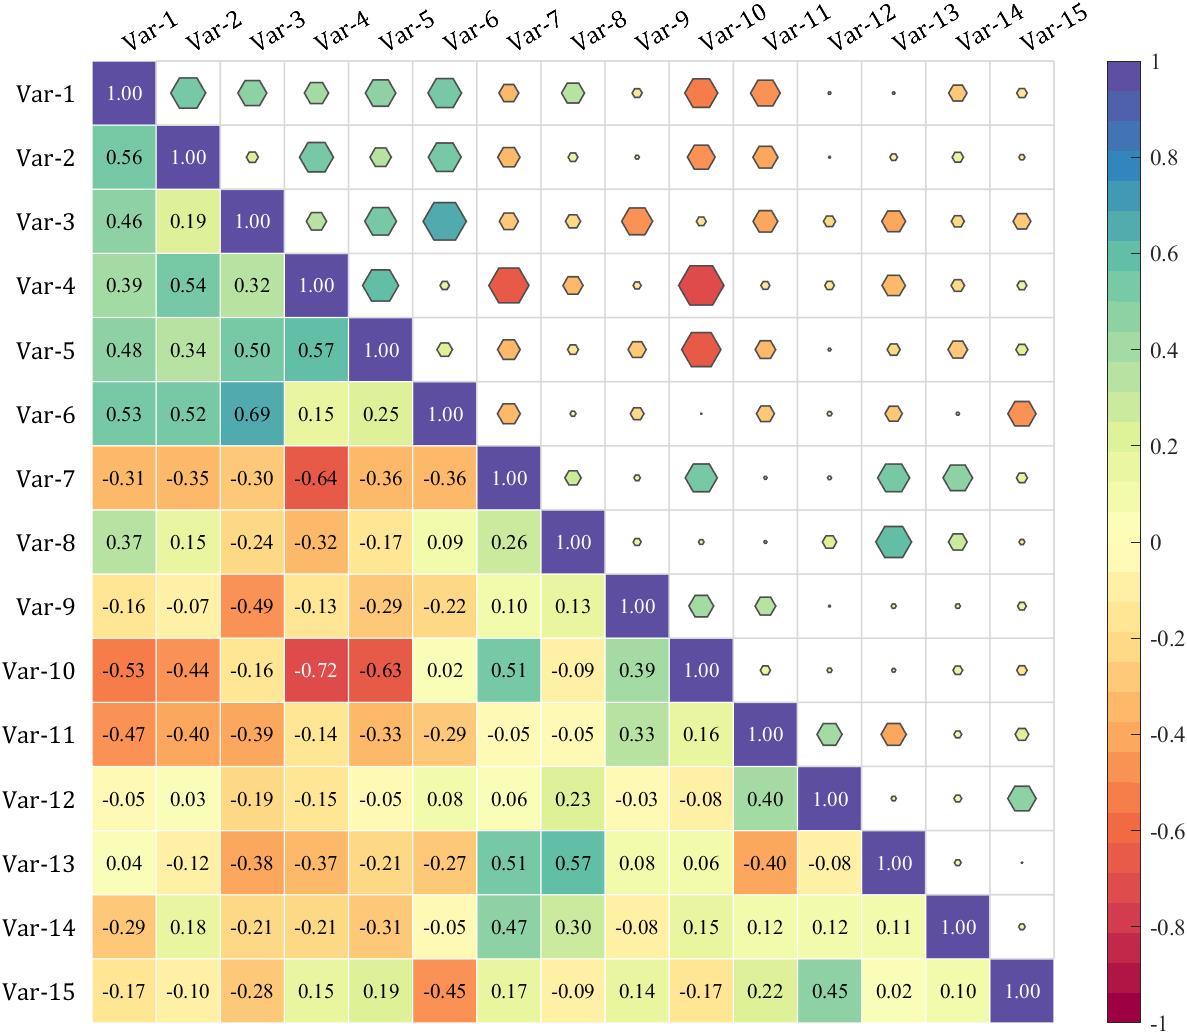
6.1 三角化类型
通过 setType() 函数设置三角化格式,可设置为:
- ‘triu’ : upper triangle : 上三角部分
- ‘tril’ : lower triangle : 下三角部分
- ‘triu0’ : upper triangle without diagonal : 扣除对角线上三角部分
- ‘tril0’ : lower triangle without diagonal : 扣除对角线下三角部分
% + 'triu'   : upper triangle                  : 上三角部分
% + 'tril'   : lower triangle                  : 下三角部分
% + 'triu0'  : upper triangle without diagonal : 扣除对角线上三角部分
% + 'tril0'  : lower triangle without diagonal : 扣除对角线下三角部分

Type='triu','tril','triu0','tril0';
for i=1:length(Type)
    figure()
    SHM_s1=SHeatmap(Data,'Format','sq');
    SHM_s1=SHM_s1.draw();
    SHM_s1.setText();
    % 设置格式(set Type)
    SHM_s1.setType(Typei)
%     exportgraphics(gca,['gallery\\Type_',Typei,'.png'])
end
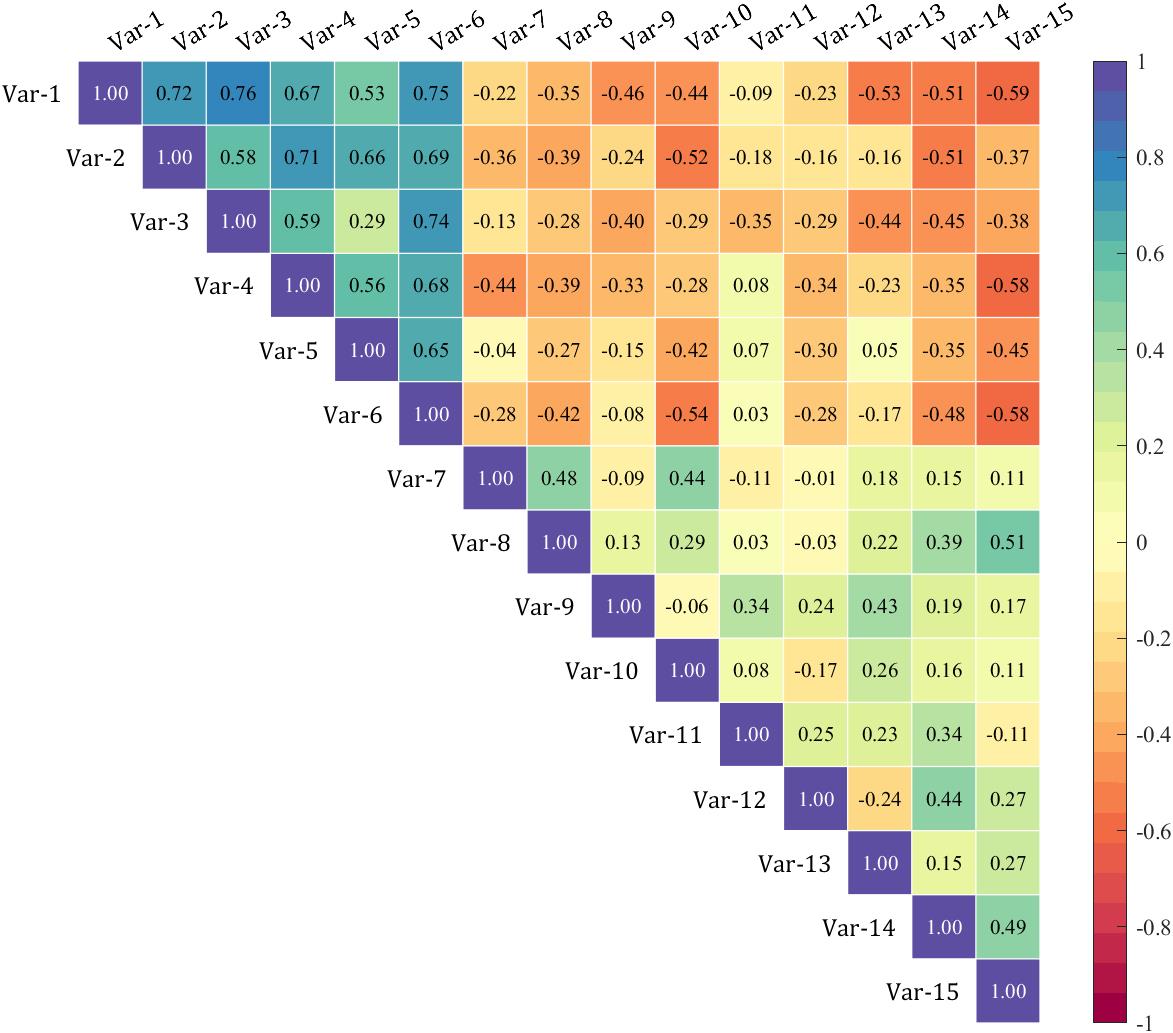
6.2 设置标签名称
figure()
SHM_s2=SHeatmap(Data,'Format','sq');
SHM_s2=SHM_s2.draw();
SHM_s2.setType('tril');

varName='A1','A2','A3','A4','A5','B1','B2','B3','B4','B5','C1','C2','C3','C4','C5';
SHM_s2.setVarName(varName)

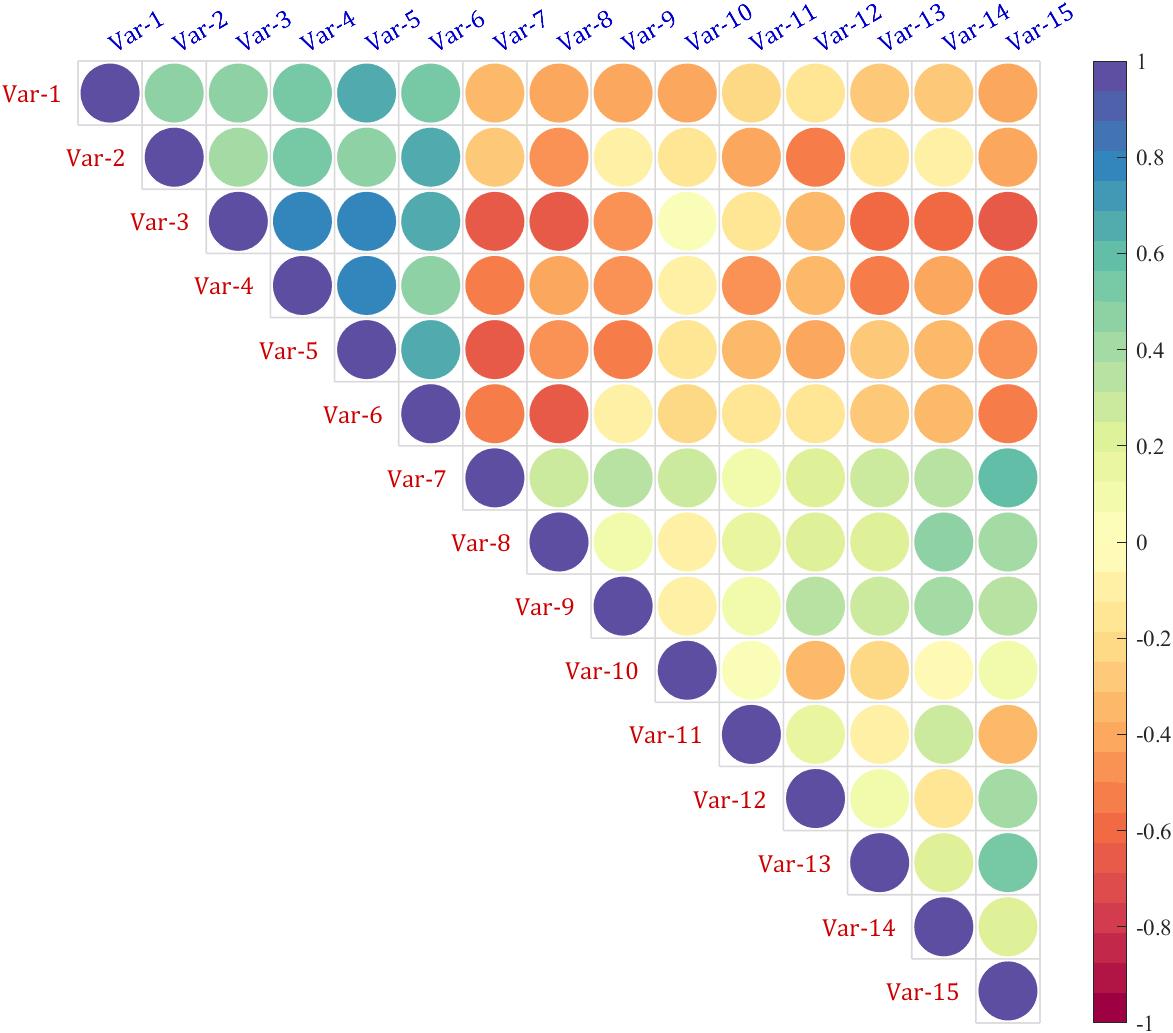
6.3 设置标签字体
figure()
SHM_s5=SHeatmap(Data,'Format','circ');
SHM_s5=SHM_s5.draw();
SHM_s5.setType('triu');
% 设置标签颜色(Set Font Color)
SHM_s5.setRowLabel('Color',[.8,0,0])
SHM_s5.setColLabel('Color',[0,0,.8])
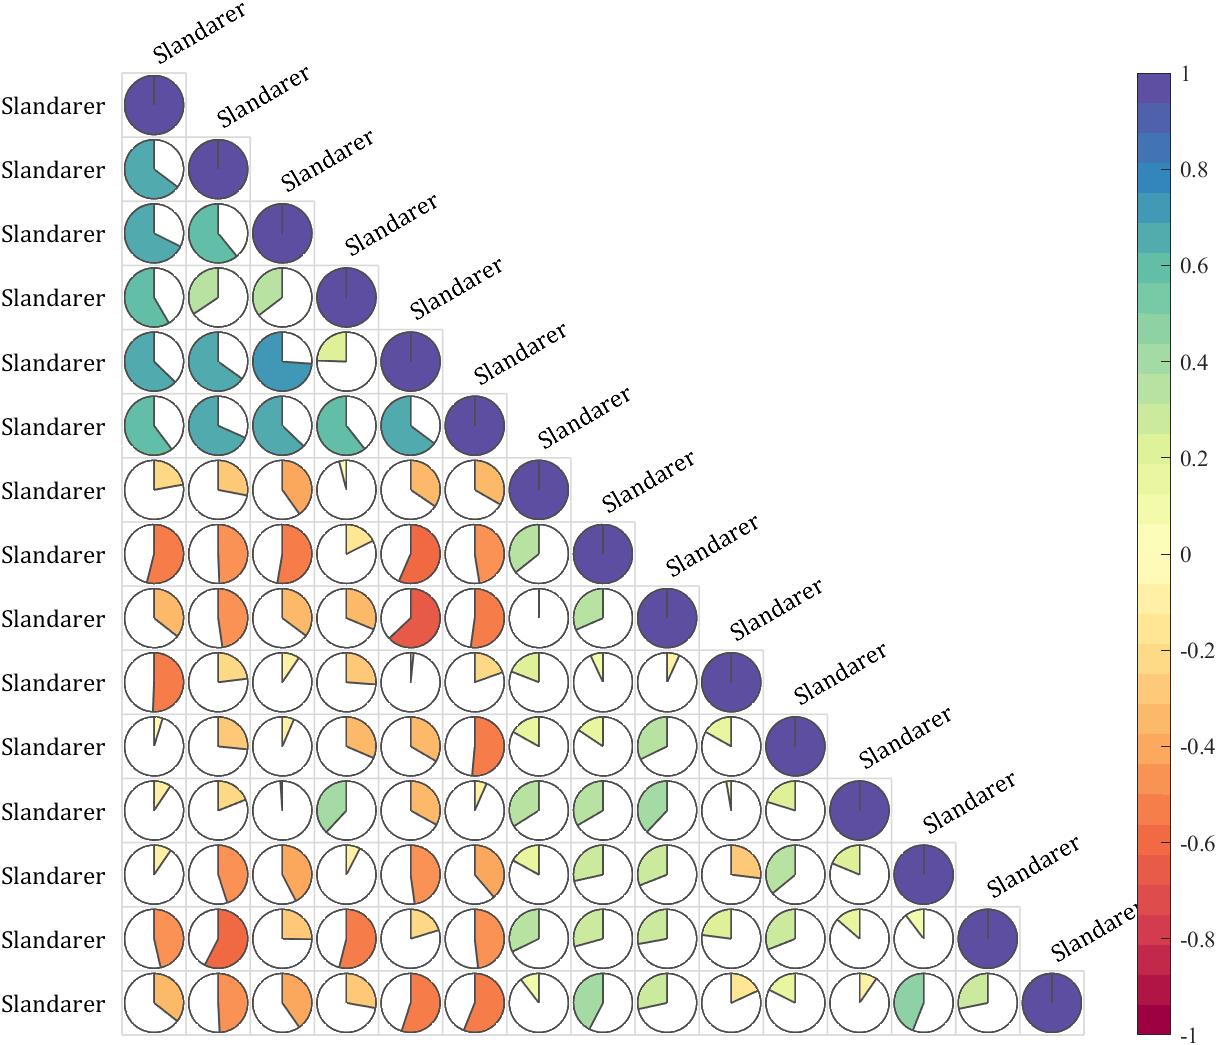
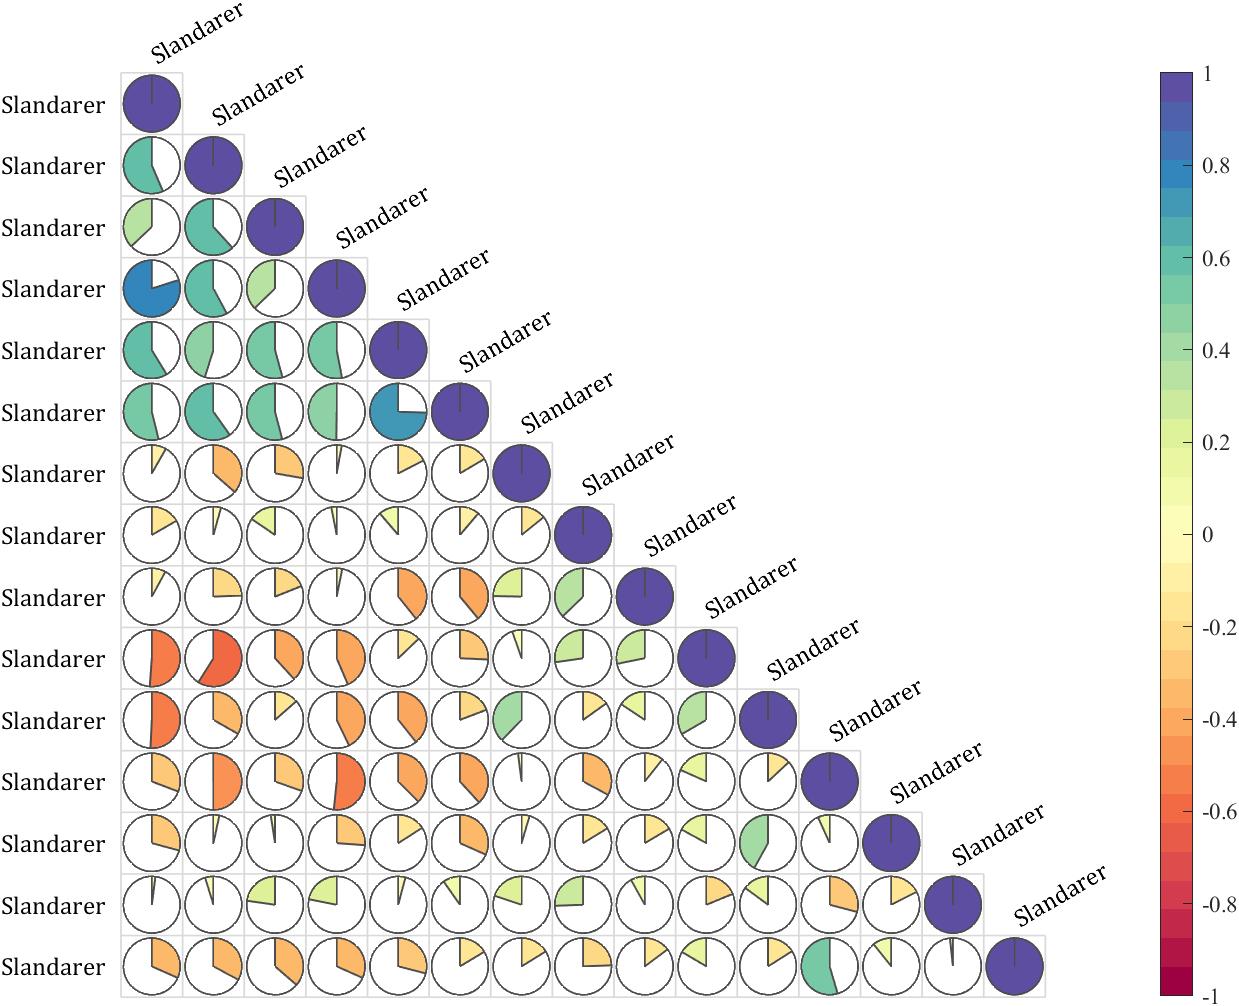
6.4 调整轴范围以避免遮挡
figure()
SHM_s3=SHeatmap(Data,'Format','pie');
SHM_s3=SHM_s3.draw();
SHM_s3.setType('tril');
SHM_s3.setVarName('Slandarer')
ax=gca;
ax.XLim(2)=ax.XLim(2)+1;
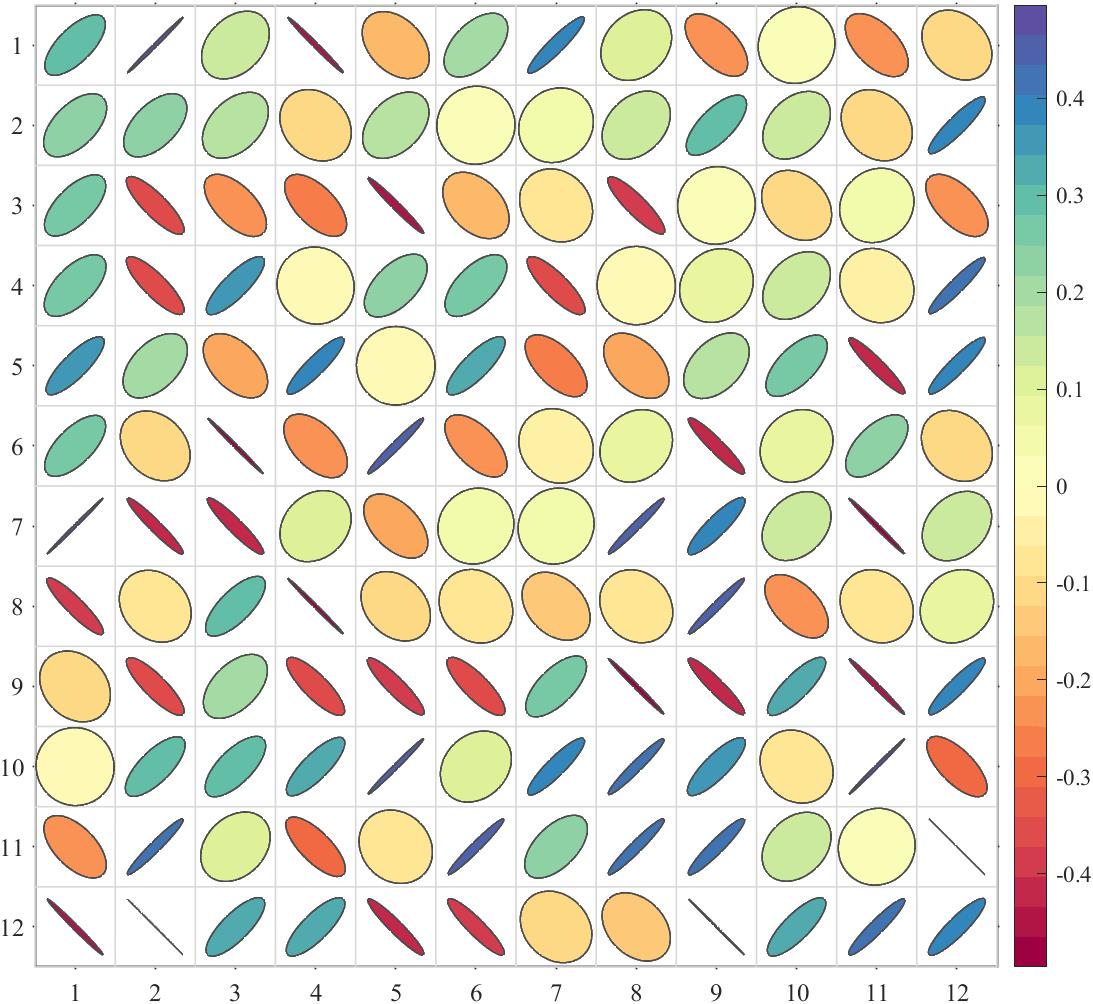
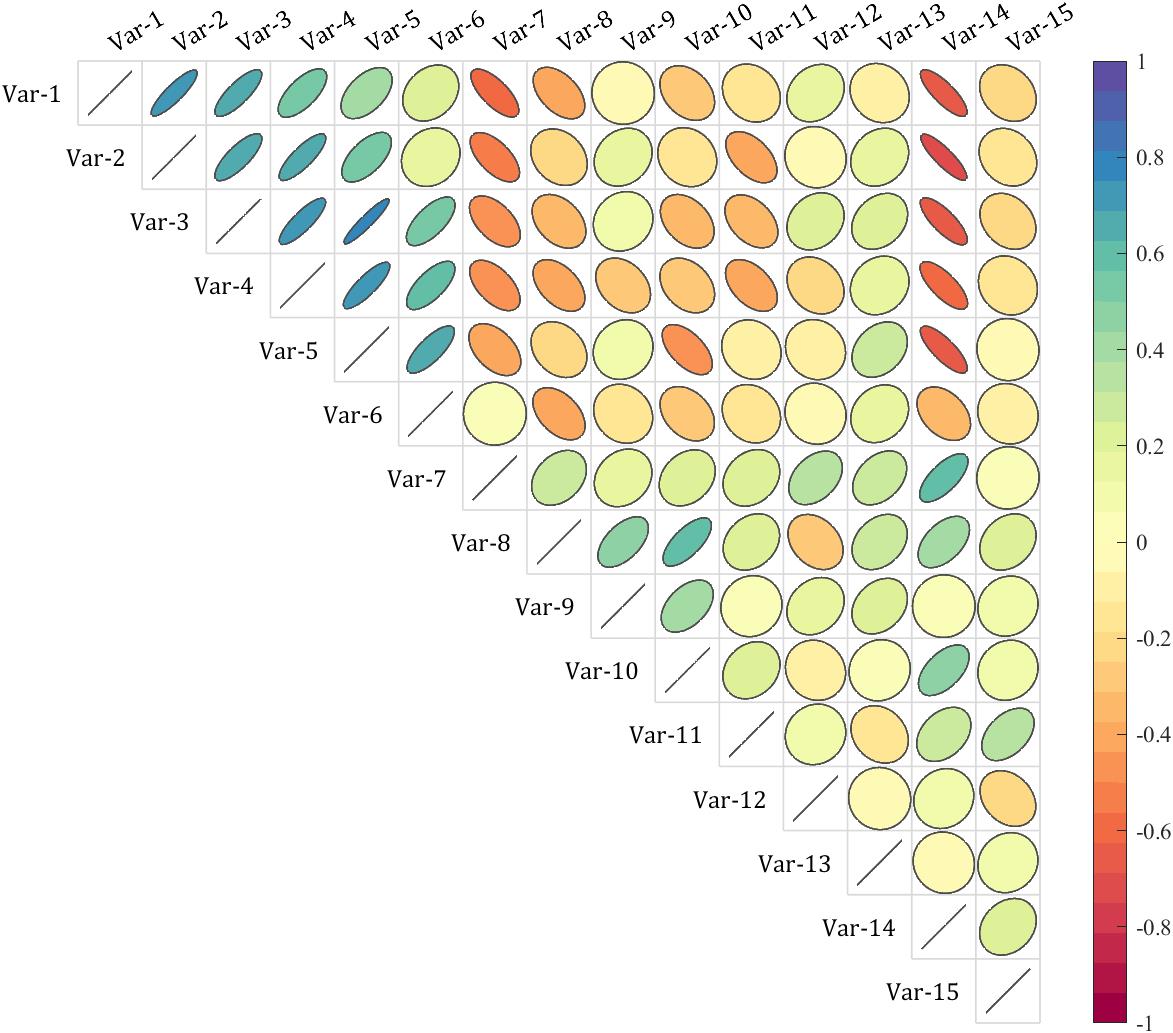
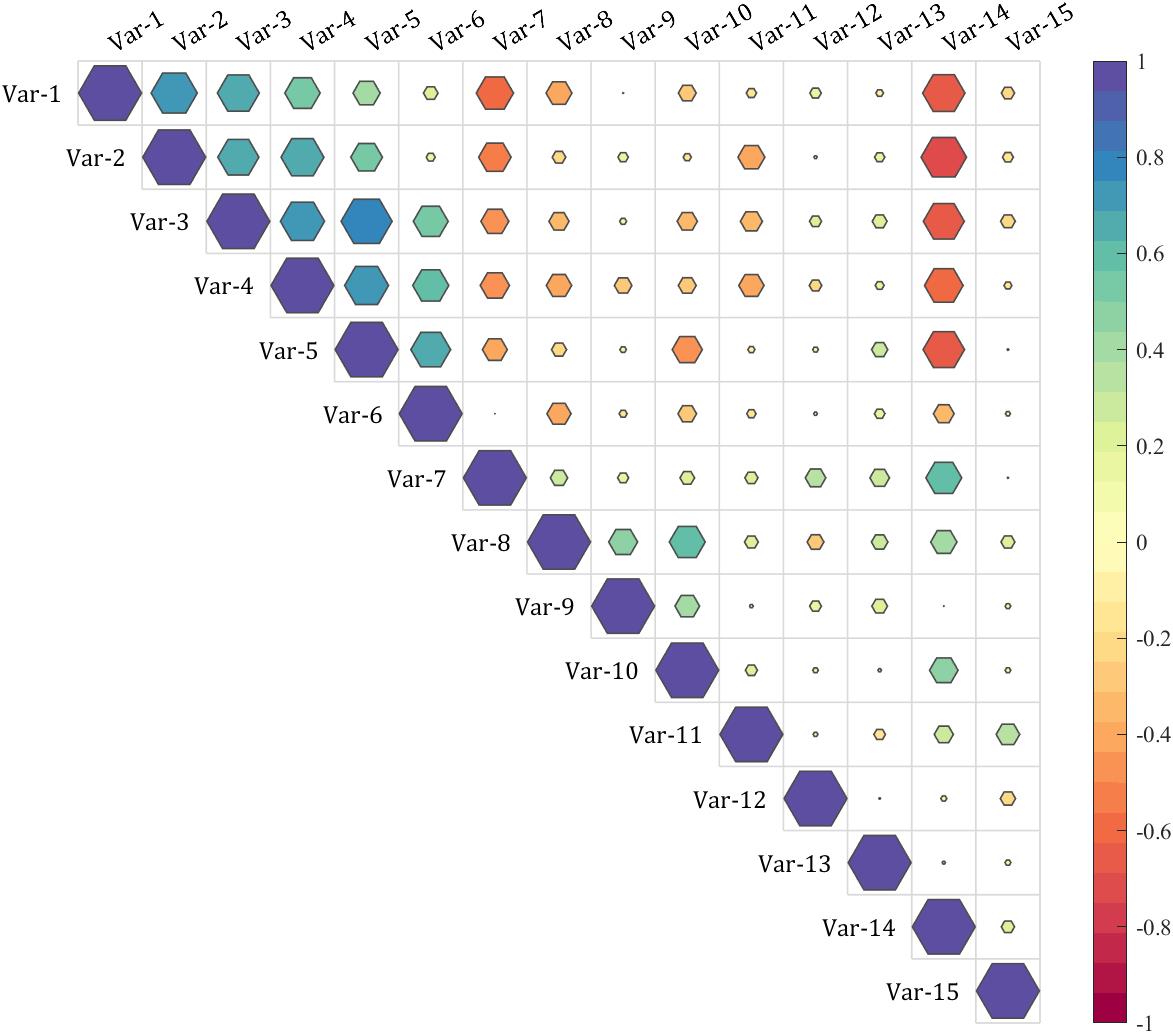
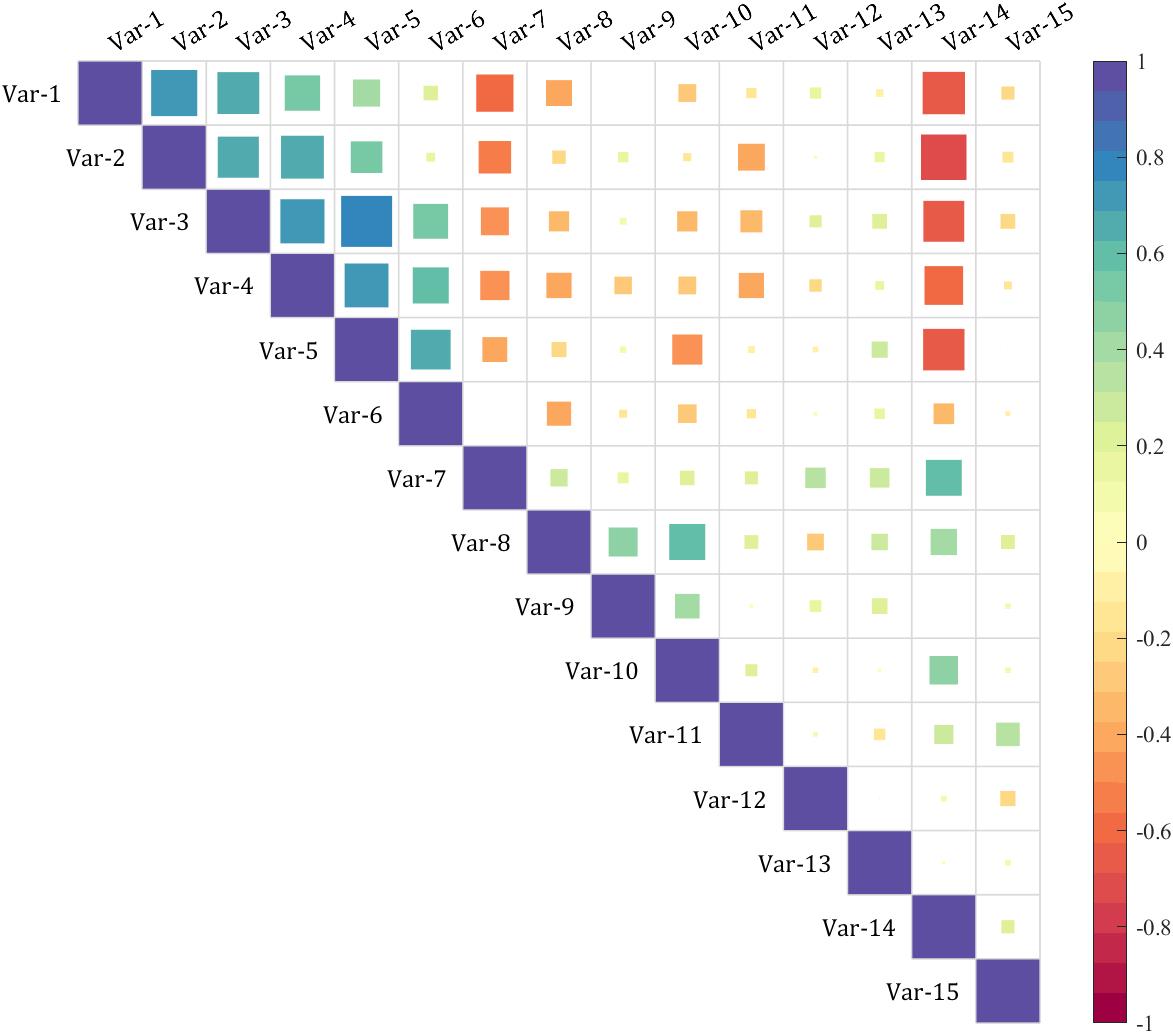
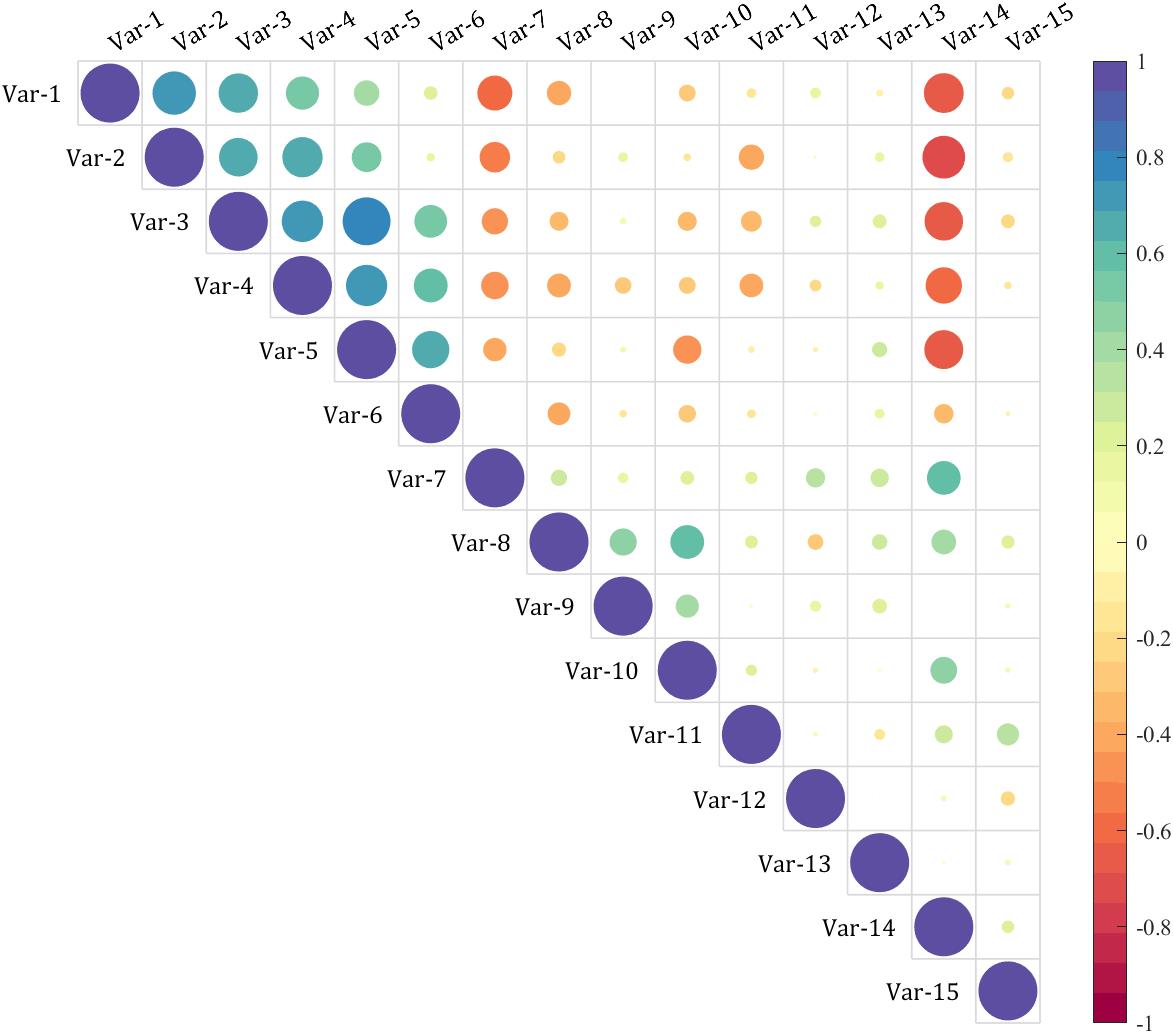
6.5 展示所有样式的上三角化
Format='sq','pie','circ','oval','hex','asq','acirc';
for i=1:length(Format)
    figure()
    SHM_s4=SHeatmap(Data,'Format',Formati);
    SHM_s4=SHM_s4.draw();
    % 设置格式(set Type)
    SHM_s4.setType('triu');
    % exportgraphics(gca,['gallery\\Type_triu',Formati,'.png'])
end

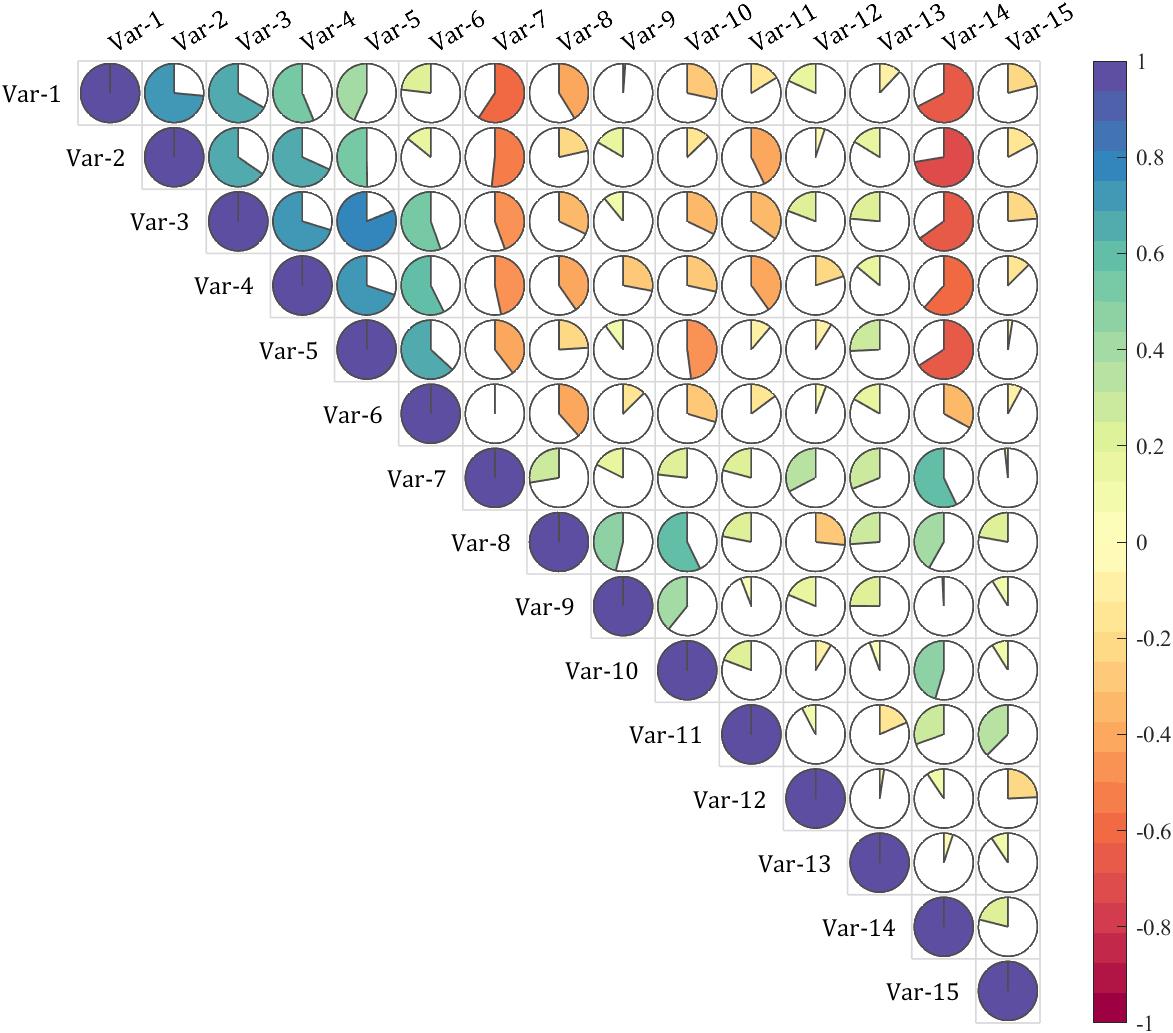
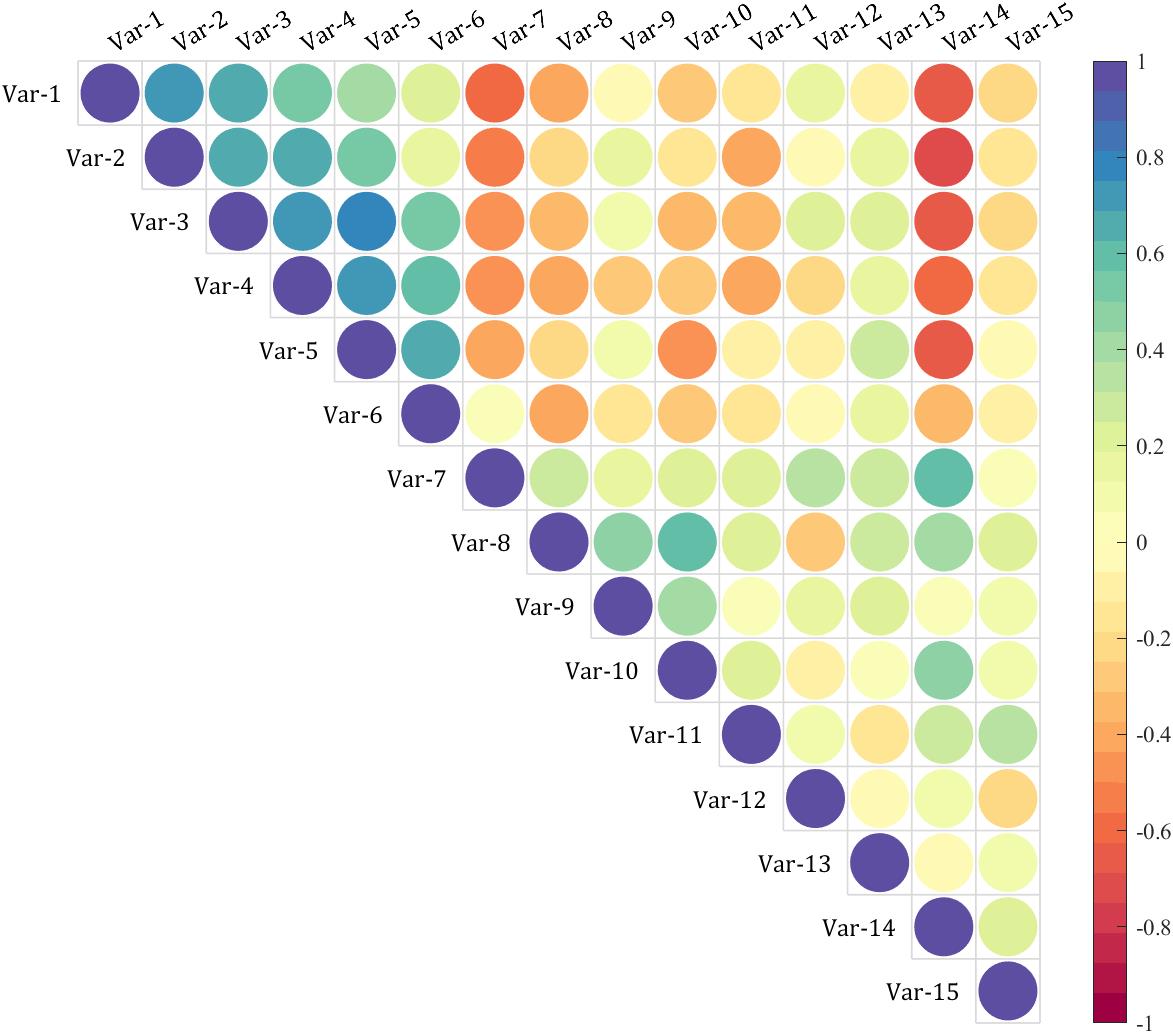
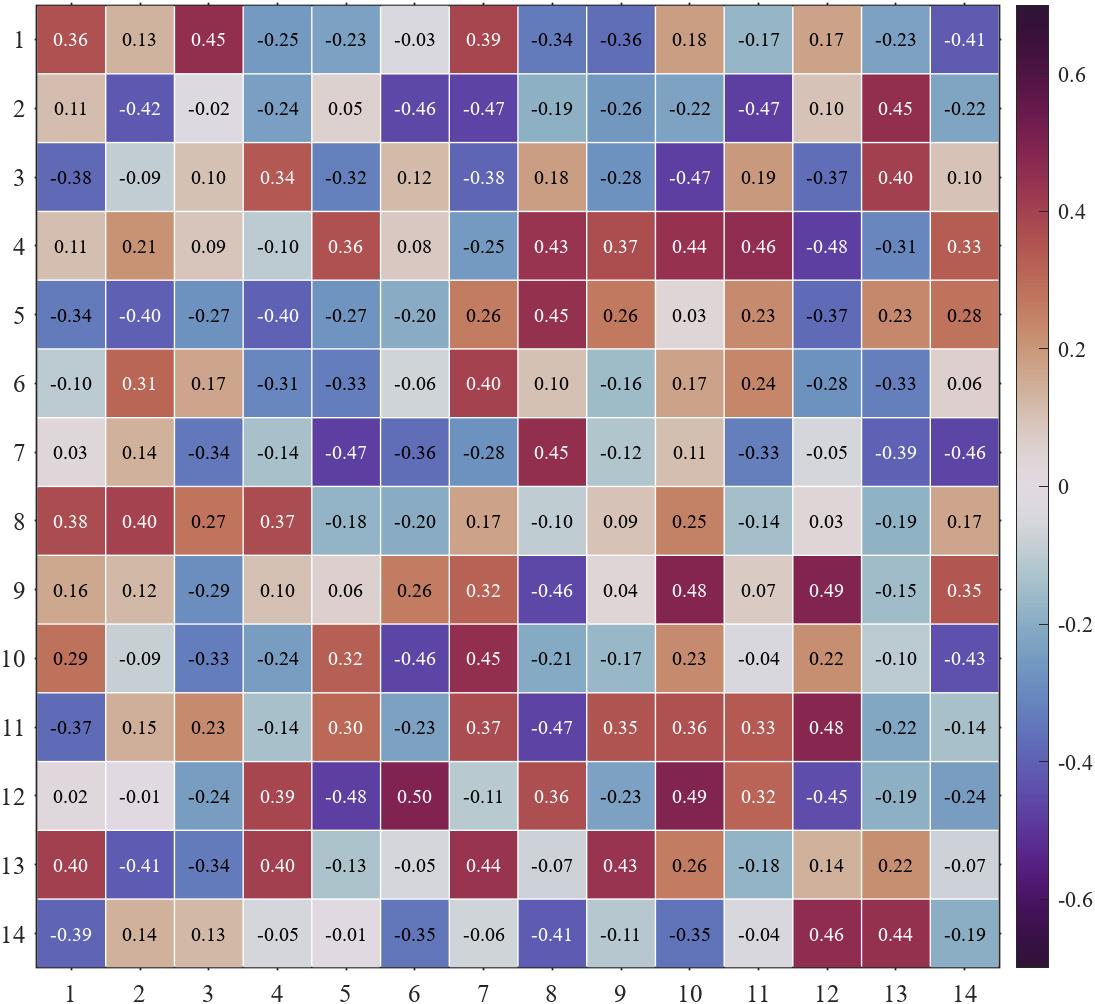
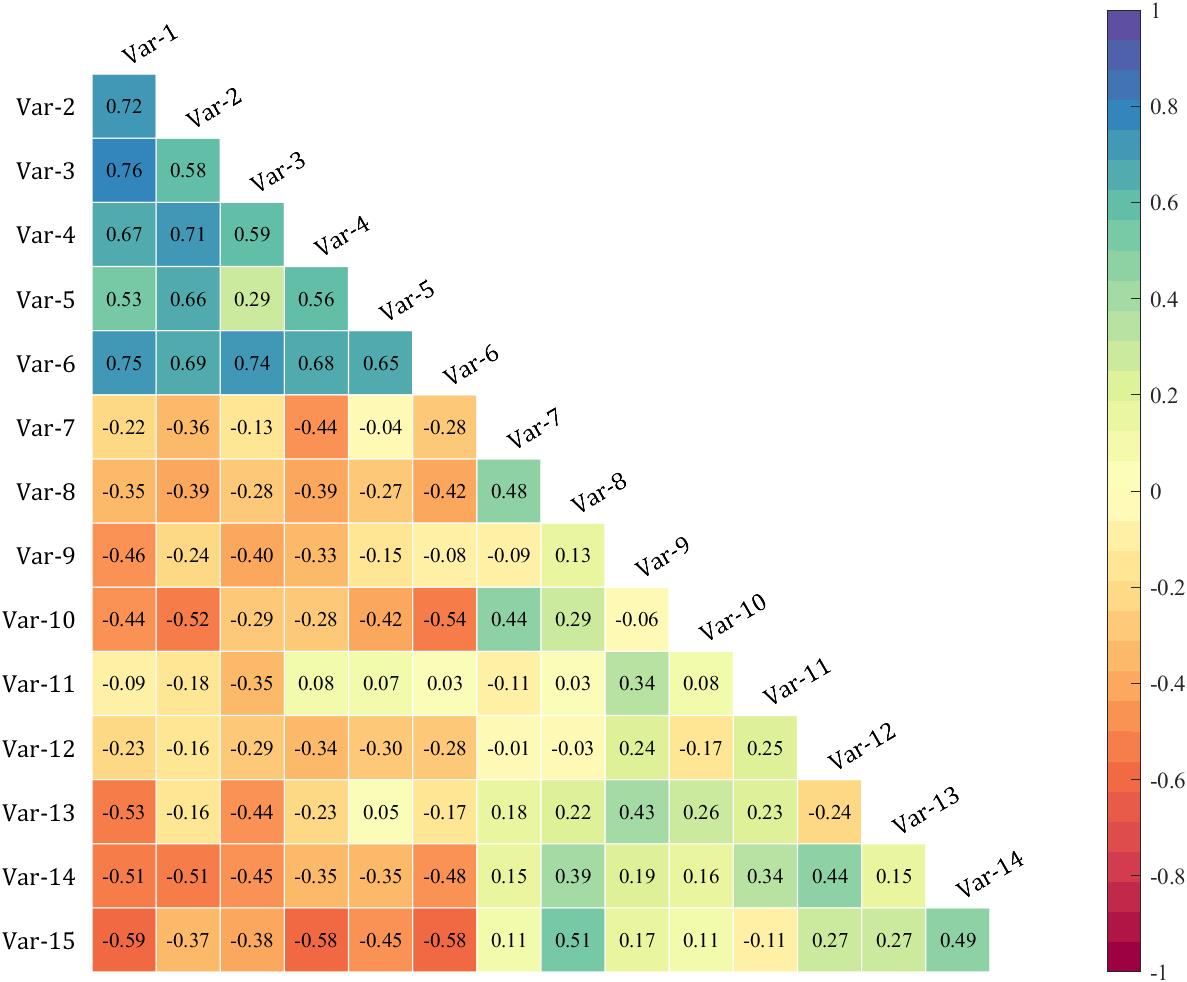
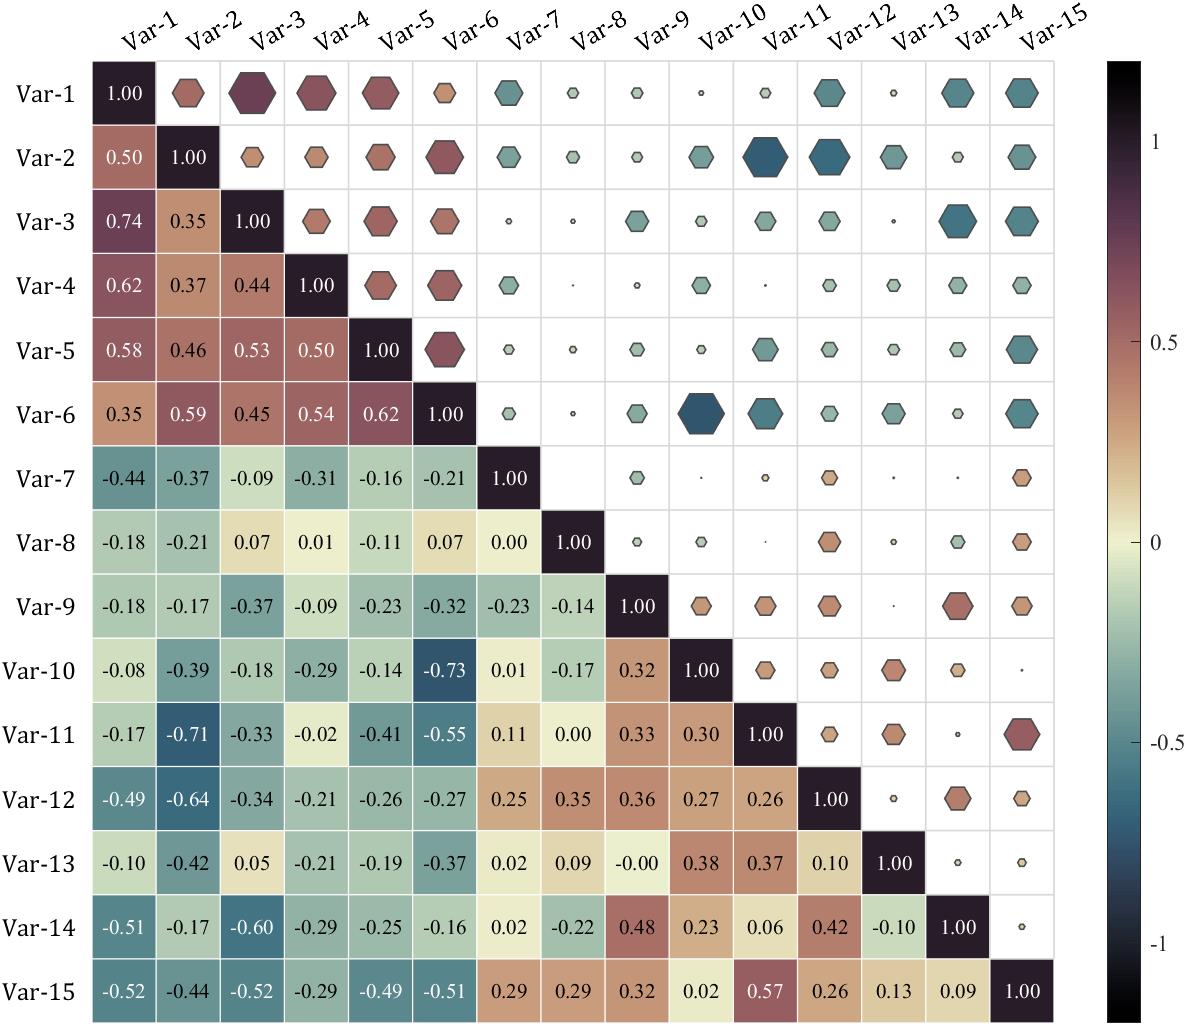
7 合并两个三角热图
就画两次并隐藏部分字体:
% 随便捏造了点数据(Made up some data casually)
X=randn(20,15)+[(linspace(-1,2.5,20)').*ones(1,6),(linspace(.5,-.7,20)').*ones(1,5),(linspace(.9,-.2,20)').*ones(1,4)];
% 求相关系数矩阵(Get the correlation matrix)
Data=corr(X);


figure()
SHM_m1=SHeatmap(Data,'Format','sq');
SHM_m1=SHM_m1.draw();
SHM_m1=SHM_m1.setType('tril');  % 这个等号因为要增添文字很必要(This equal sign is necessary for adding text)
SHM_m1.setColLabel('Visible','off')

SHM_m2=SHeatmap(Data,'Format','hex');
SHM_m2=SHM_m2.draw();
SHM_m2.setType('triu0');
SHM_m2.setRowLabel('Visible','off')
SHM_m2.setColLabel('Visible','on') % 显示隐藏的Var-1标签(Show the hidden Var-1 label)

clim([-1.2,1.2])
colormap(slanCM(141))

SHM_m1.setText();
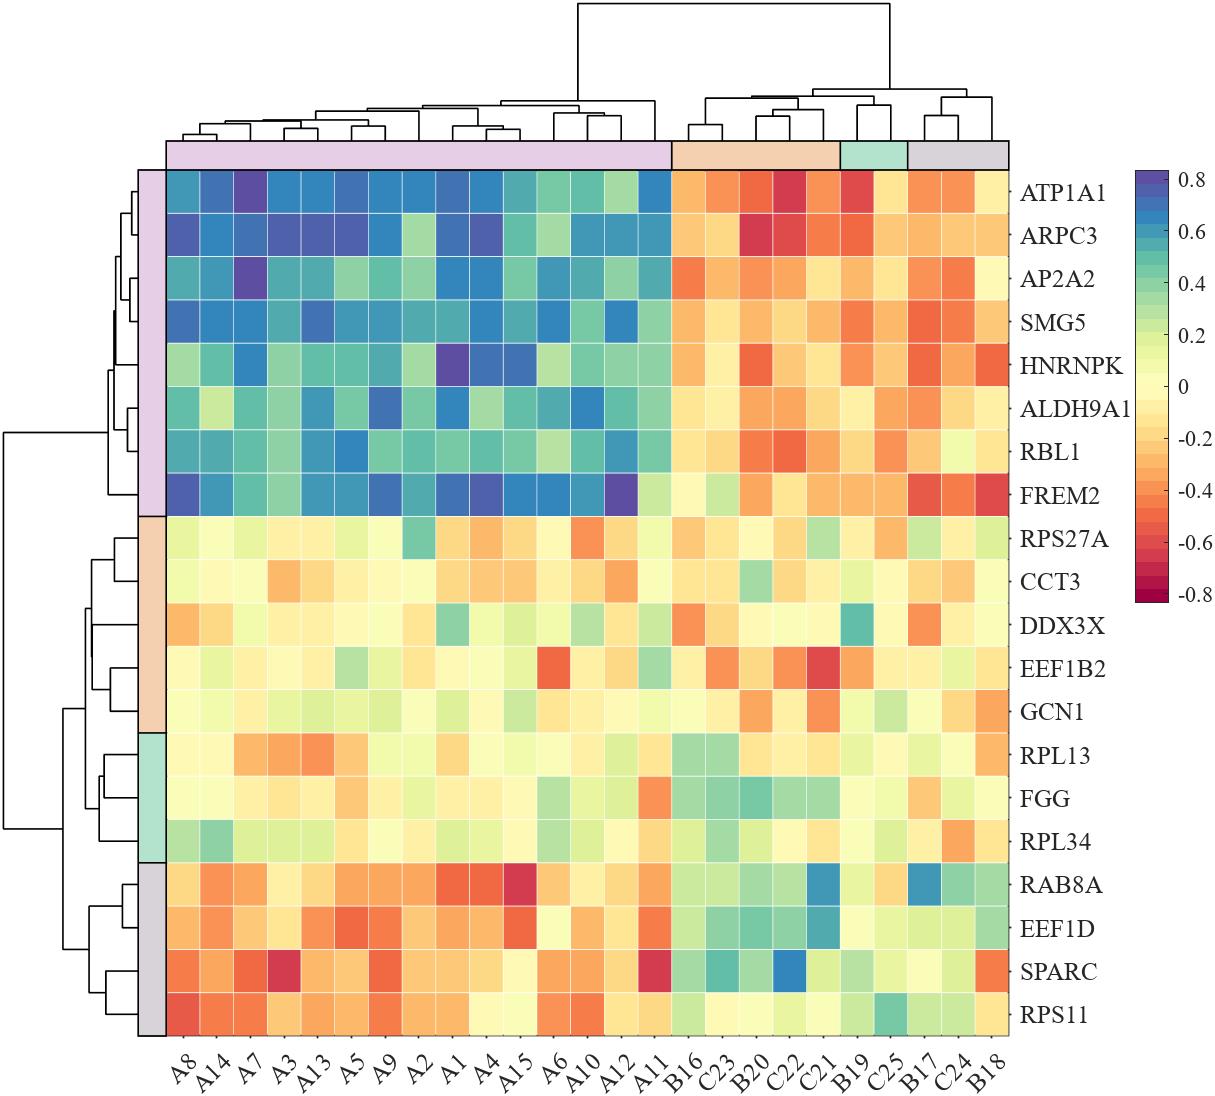
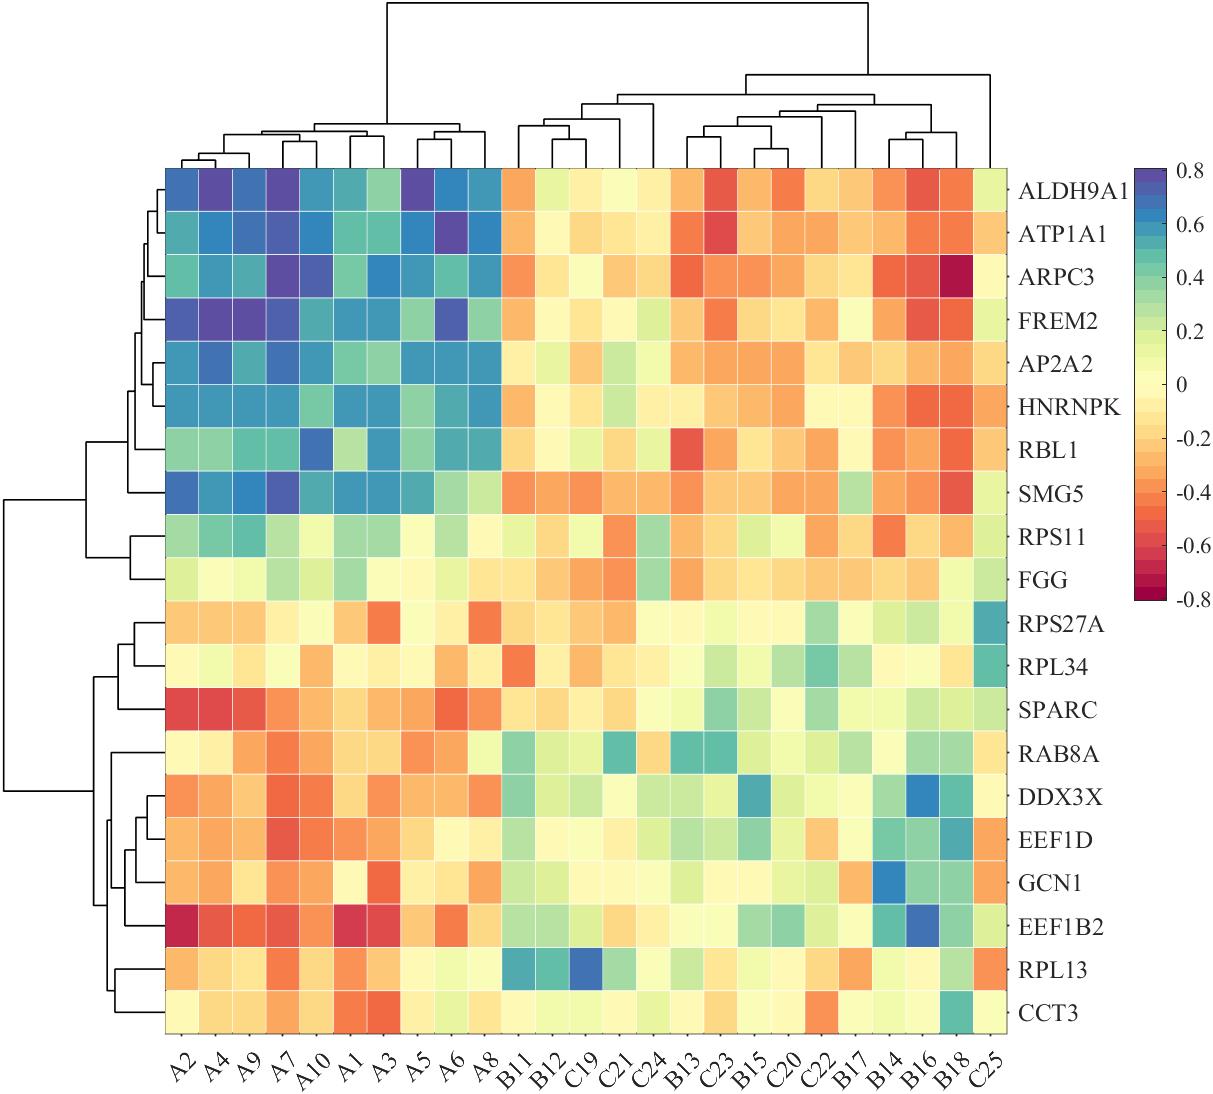
8 带树状图热图
有点麻烦但一点点画吧,需要用到SDendrogram函数,这个函数最后会给出,这个函数有三个可用的参数:
'Orientation’横向树状图还是竖着,'Parent’画在哪个坐标区域,'Method’聚类方法,返回值是新的排序:
% 随便捏造了点数据(Made up some data casually)
X1=randn(20,20)+[(linspace(-1,2.5,20)').*ones(1,8),(linspace(.5,-.7,20)').*ones(1,5),(linspace(.9,-.2,20)').*ones(1,7)];
X2=randn(20,25)+[(linspace(-1,2.5,20)').*ones(1,10),(linspace(.5,-.7,20)').*ones(1,8),(linspace(.9,-.2,20)').*ones(1,7)];
% 求相关系数矩阵(Get the correlation matrix)
Data=corr(X1,X2);
% rowName and colName
rowName='FREM2','ALDH9A1','RBL1','AP2A2','HNRNPK','ATP1A1','ARPC3','SMG5','RPS27A',...
          'RAB8A','SPARC','DDX3X','EEF1D','EEF1B2','RPS11','RPL13','RPL34','GCN1','FGG','CCT3';
colName='A1','A2','A3','A4','A5','A6','A7','A8','A9','A10','B11','B12','B13',...
         'B14','B15','B16','B17','B18','C19','C20','C21','C22','C23','C24','C25';

% 图窗创建(create figure)
fig=figure('Position',[100,100,870,720]);

% 调整主坐标区域位置并将Y轴置于右侧
% Adjust the position of the main coordinate area
% and place the Y axis to the right
axMain=axes('Parent',fig);
axMain.Position=[.18,.07,.62,.77];
P=axMain.Position;
axMain.YAxisLocation='right';

% 绘制左侧树状图(Draw the left dendrogram)
axTreeL=axes('Parent',fig);
axTreeL.Position=[P(1)-P(3)/5,P(2),P(3)/5,P(4)];
orderL=SDendrogram(Data,'Orientation','left','Parent',axTreeL);

% 绘制顶部树状图(Draw the top dendrogram)
axTreeT=axes('Parent',fig);
axTreeT.Position=[P(1),P(2)+P(4),.62,P(4)/5];
orderT=SDendrogram(Data,'Orientation','top','Parent',axTreeT);

% 交换数据顺序(Exchange data order)
Data=Data(orderL,:);
Data=Data(:,orderT);

% 绘制热图(Draw Heatmap)
SHM_t1=SHeatmap(Data,'Format','sq','Parent',axMain);
SHM_t1=SHM_t1.draw();
axMain.DataAspectRatioMode='auto';
axMain.XTickLabel=colName(orderT);
axMain.YTickLabel=rowName(orderL);
CB=colorbar(axMain);
CB.Position=[P(1)+P(3)*1.15,P(2)+P(4)/2,P(3)/25,P(4)/2];
9 分组热图
需要使用SClusterBlock函数,主要的参数有:
'Orientation’横向还是竖着,'MinLim’绘制的位置下限,'Parent’画在哪个坐标区域,'ColorList’配色列表,返回值X,Y是每一个块的中心坐标,为了方便之后添加文本:
% 随便捏造了点数据(Made up some data casually)
ClassCol=[1,1,1,1,2,1,2,2,2,2,3,3,3,3,3,4,4,4,4,4,5,5,5,5,5];
ClassRow=[1,1,1,1,1,2,2,2,2,2,3,3,3,3,3,4,4,4,4,4];
Data=rand(20,25);

% 图窗创建(create figure)
fig=figure('Position',[100,100,800,800]);

% 调整主坐标区域位置并将Y轴置于右侧
% Adjust the position of the main coordinate area
% and place the Y axis to the right
axMain=axes('Parent',fig);
axMain.Position=[.1,.05,.85,.85];
P=axMain.Position;
axMain.YAxisLocation='right';

% 绘制左侧分组方块(Draw the left Block)
axBlockL=axes('Parent',fig);
axBlockL.Position=[P(1)-P(3)/20-P(3)*.01,P(2),P(3)/20,P(4)];
SClusterBlock(ClassRow,'Orientation','left','Parent',axBlockL);

% 绘制上侧分组方块(Draw the top Block)
axBlockT=axes('Parent',fig);
axBlockT.Position=[P(1),P(2)+P(4)*1.01,P(3),P(4)/20];
SClusterBlock(ClassCol,'Orientation','top','Parent',axBlockT);

% 绘制热图(Draw Heatmap)
SHM_b1=SHeatmap(Data,'Format','sq','Parent',axMain);
SHM_b1=SHM_b1.draw();
axMain.DataAspectRatioMode='auto';
colorbar(axMain,'off');
clim(axMain,[-.2,1])

10 多层分组热图
绘制多次的同时改一下MinLim属性,同时下面这个例子利用了返回值填上了标签:
Data=rand(3,16);

Class1=[1,1,1,1,2,2,2,2,3,3,3,3,4,4,4,4];
Class2=[1,2,3,4,1,2,3,4,1,2,3,4,1,2,3,4];
ClassName1='AAAAA','BBBBB','CCCCC','DDDDD';
ClassName2='A1','A2','A3','A4','B1','B2','B3','B4','C1','C2','C3','C4','D1','D2','D3','D4';

% 设置颜色(Set Color)
CList1=[0.7020    0.8863    0.8039
    0.9559    0.8142    0.6907
    0.8451    0.8275    0.8510
    0.8966    0.8083    0.9000];
CList2=[0.4588    0.4196    0.6941
    0.6196    0.6039    0.7843
    0.7373    0.7412    0.8627
    0.8549    0.8549    0.9216];

% 图窗及坐标区域创建(create figure and axes)
fig=figure('Position',[100,100,1000,320]);
axMain=axes('Parent',fig);
ax以上是关于MATLAB | 给热图整点花哨操作(三角,树状图,分组图)的主要内容,如果未能解决你的问题,请参考以下文章