- 第四节:微积分
Posted 海轰Pro
tags:
篇首语:本文由小常识网(cha138.com)小编为大家整理,主要介绍了- 第四节:微积分相关的知识,希望对你有一定的参考价值。
目录

前言
Hello!
非常感谢您阅读海轰的文章,倘若文中有错误的地方,欢迎您指出~
自我介绍 ଘ(੭ˊᵕˋ)੭
昵称:海轰
标签:程序猿|C++选手|学生
简介:因C语言结识编程,随后转入计算机专业,获得过国家奖学金,有幸在竞赛中拿过一些国奖、省奖…已保研。
学习经验:扎实基础 + 多做笔记 + 多敲代码 + 多思考 + 学好英语!
唯有努力💪
知其然 知其所以然!
本文仅记录自己感兴趣的内容
2.4 微积分
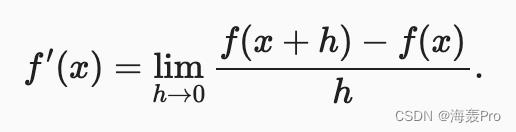
2.4.1. 导数和微分
求 f ( x ) = 3 x 2 − 4 x f(x) = 3x^2-4x f(x)=3x2−4x在 x = 1 x=1 x=1时的导数
利用下面公式
import numpy as np
from matplotlib_inline import backend_inline
from d2l import torch as d2l

# 定义f(x)函数
def f(x):
    return 3 * x ** 2 - 4 * x
# 求导数(依据上面的公式)
def numerical_lim(f, x, h):
    return (f(x + h) - f(x)) / h

# 观察h的大小对导数的影响
h = 0.1
for i in range(5):
    print(f'h=h:.5f, numerical limit=numerical_lim(f, 1, h):.5f')
    h *= 0.1

# ans
h=0.10000, numerical limit=2.30000
h=0.01000, numerical limit=2.03000
h=0.00100, numerical limit=2.00300
h=0.00010, numerical limit=2.00030
h=0.00001, numerical limit=2.00003
发现随着h逐渐减小,结果越来越靠近2(理论值在x=1的导数为2)
绘制 f ( x ) = 3 x 2 − 4 x f(x) = 3x^2-4x f(x)=3x2−4x在 x = 1 x=1 x=1时的切线
封装绘图函数
def use_svg_display():  #@save
    """使用svg格式在Jupyter中显示绘图"""
    # 设置图片格式为svg
    backend_inline.set_matplotlib_formats('svg')
def set_figsize(figsize=(3.5, 2.5)):  #@save
    """设置matplotlib的图表大小"""
    use_svg_display()
    d2l.plt.rcParams['figure.figsize'] = figsize
#@save
def set_axes(axes, xlabel, ylabel, xlim, ylim, xscale, yscale, legend):
    """设置matplotlib的轴"""
    axes.set_xlabel(xlabel) # 横坐标 label
    axes.set_ylabel(ylabel)# 纵坐标 label
    axes.set_xscale(xscale) # x轴比例类型
    axes.set_yscale(yscale) # y轴比例类型
    axes.set_xlim(xlim) # x轴范围
    axes.set_ylim(ylim)# y轴范围
    # legend 设置图例的位置 比如左上、右下等
    if legend:
        axes.legend(legend)
    axes.grid()
#@save
def plot(X, Y=None, xlabel=None, ylabel=None, legend=None, xlim=None,
         ylim=None, xscale='linear', yscale='linear',
         fmts=('-', 'm--', 'g-.', 'r:'), figsize=(3.5, 2.5), axes=None):
    """绘制数据点"""
    if legend is None:
        legend = []

    set_figsize(figsize)
    # plt.gca():获取坐标轴
    axes = axes if axes else d2l.plt.gca()

    # 如果X有一个轴,输出True
    def has_one_axis(X):
        return (hasattr(X, "ndim") and X.ndim == 1 or isinstance(X, list)
                and not hasattr(X[0], "__len__"))

    if has_one_axis(X):
        X = [X]
    if Y is None:
        X, Y = [[]] * len(X), X
    elif has_one_axis(Y):
        Y = [Y]
    if len(X) != len(Y):
        X = X * len(Y)
    axes.cla()
    for x, y, fmt in zip(X, Y, fmts):
        if len(x):
            axes.plot(x, y, fmt)
        else:
            axes.plot(y, fmt)
    set_axes(axes, xlabel, ylabel, xlim, ylim, xscale, yscale, legend)
绘图
x = np.arange(0, 3, 0.1)
plot(x, [f(x), 2 * x - 3], 'x', 'f(x)', legend=['f(x)', 'Tangent line (x=1)'])
zip()
与 zip 相反,zip(*) 可理解为解压,返回二维矩阵式
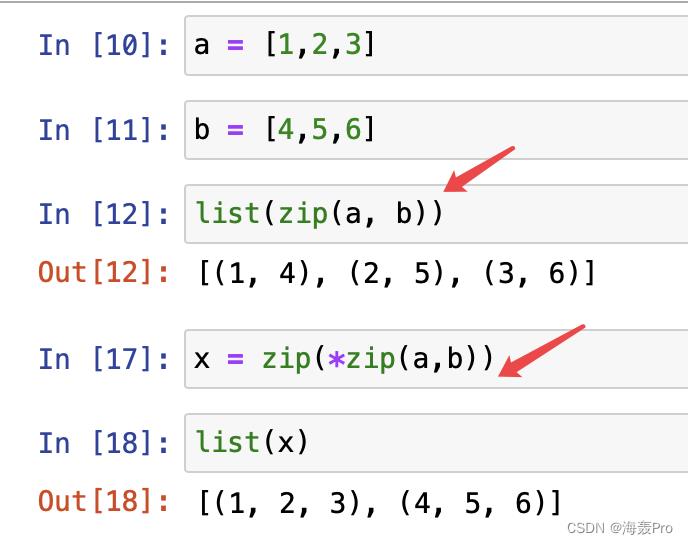
zip(*zip(a, b)) 先进行zip(a, b)运算,得到 [(1,4), (2, 5), (3, 6)], 再进行zip(*),也就是还原
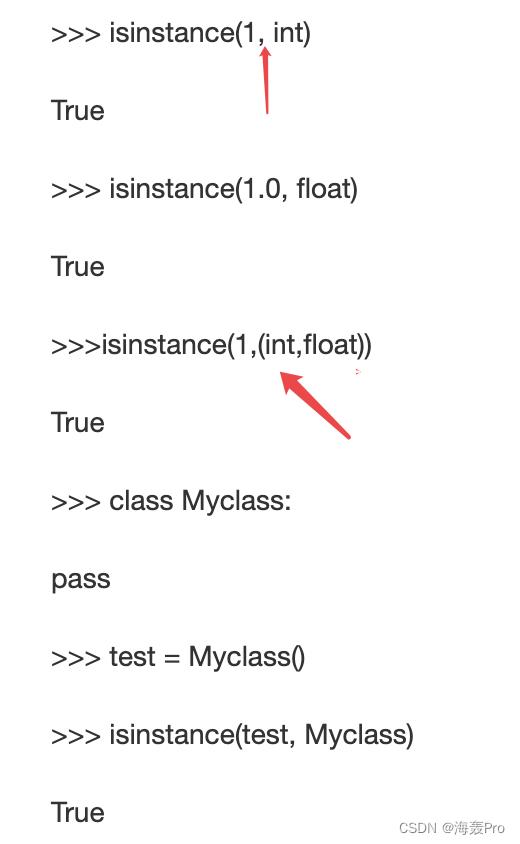
isinstance(object, classinfo)
判断变量类型
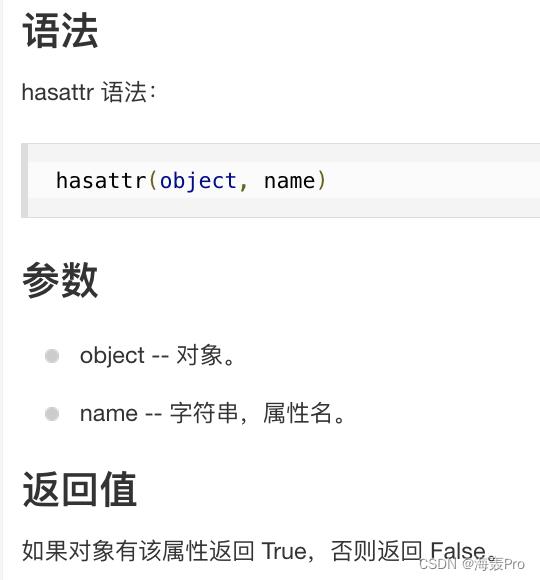
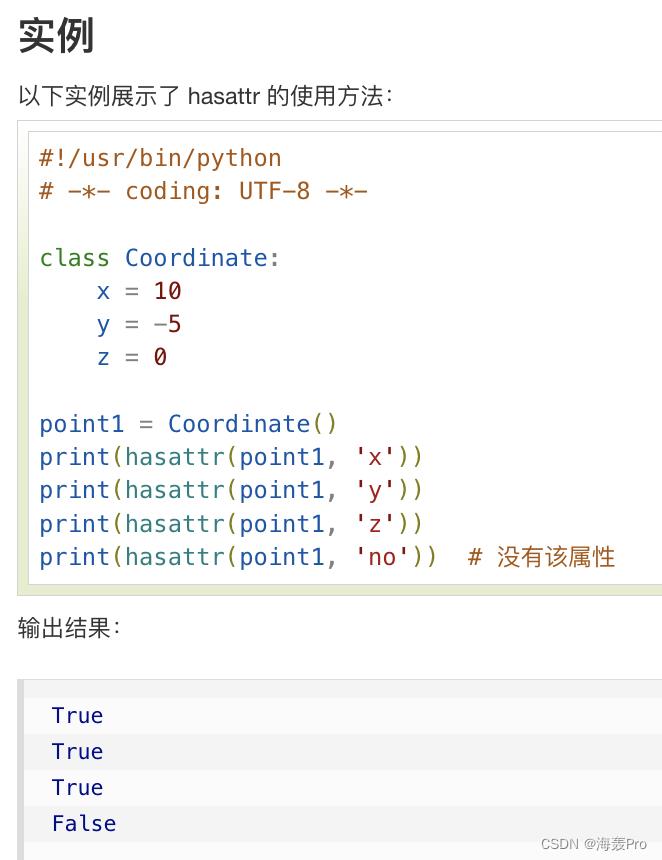
hasattr()
判断对象是否包含对应的属性
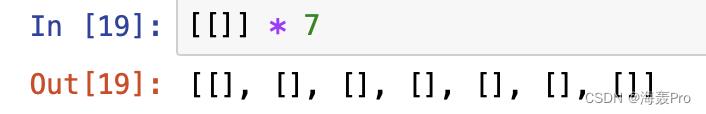
[[]] * len(X)
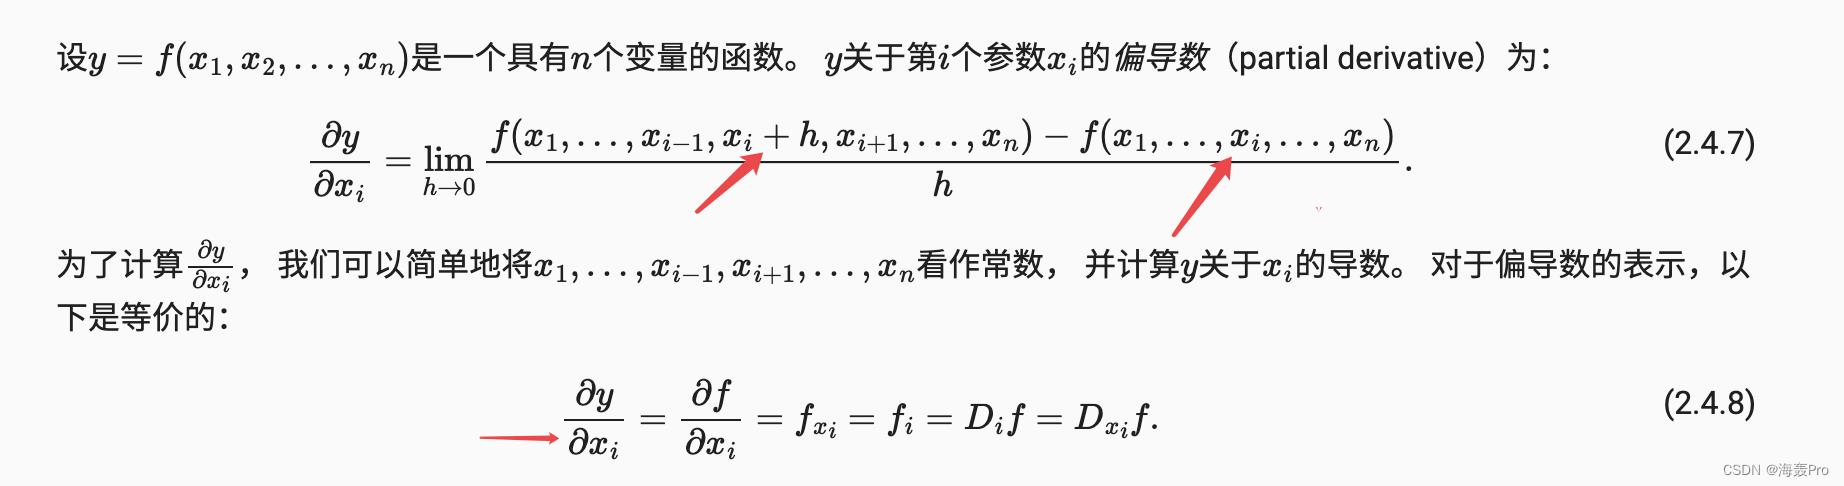
2.4.2. 偏导数
2.4.3. 梯度


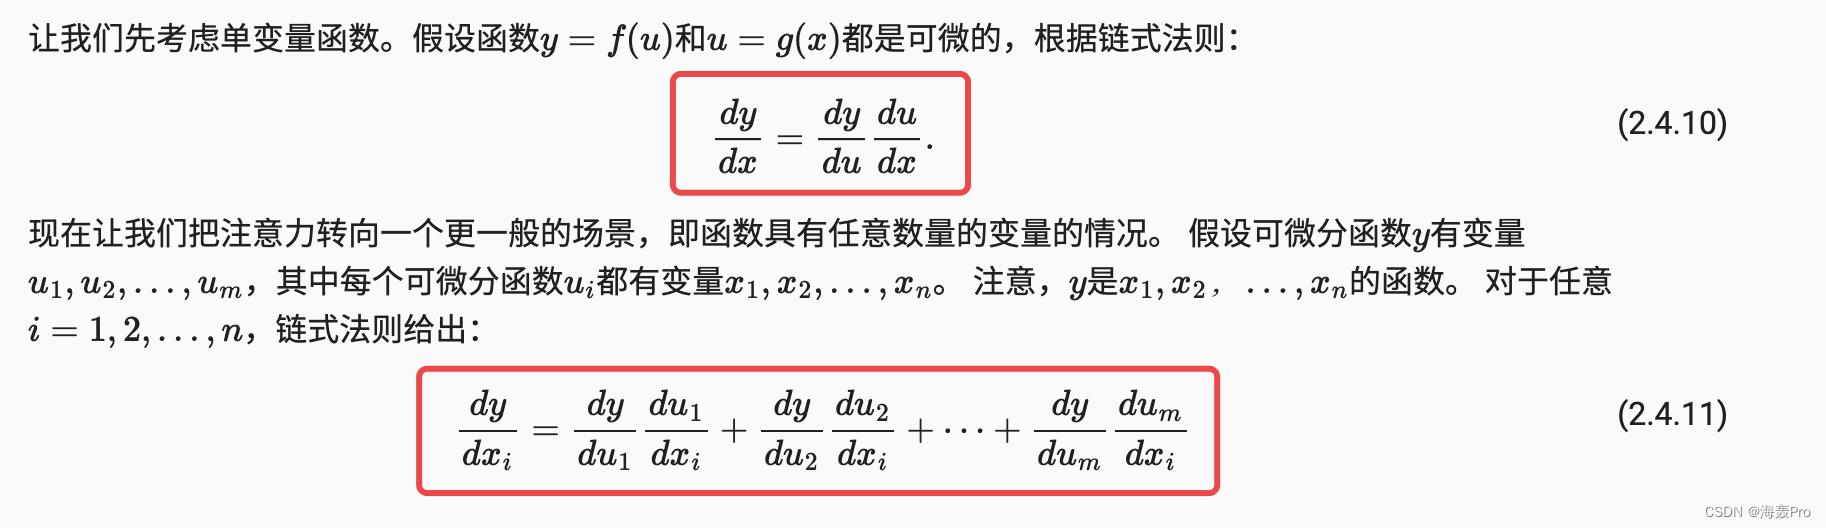
2.4.4. 链式法则
练习

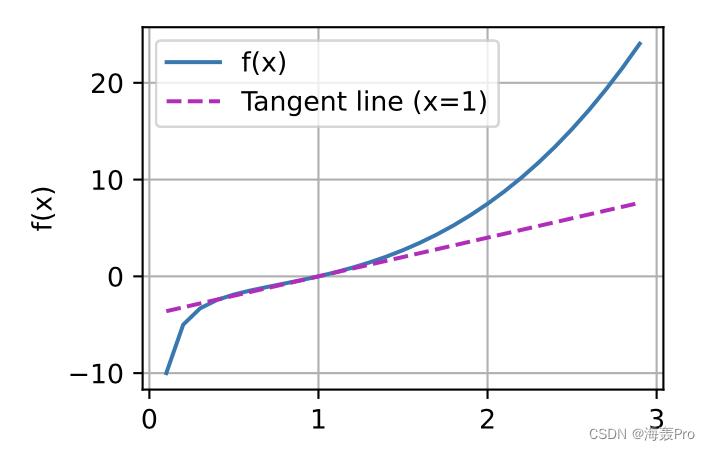
def f(x):
    return x ** 3 - 1 / x
x = np.arange(0.1, 3, 0.1)
plot(x, [f(x), 4 * (x - 1)], 'x', 'f(x)', legend=['f(x)', 'Tangent line (x=1)'])
结语
学习资料:http://zh.d2l.ai/
文章仅作为个人学习笔记记录,记录从0到1的一个过程
希望对您有一点点帮助,如有错误欢迎小伙伴指正

 创作打卡挑战赛
 赢取流量/现金/CSDN周边激励大奖
以上是关于- 第四节:微积分的主要内容,如果未能解决你的问题,请参考以下文章