[机器学习与scikit-learn-21]:算法-逻辑回归-多项式非线性回归PolynomialFeatures与代码实现
Posted 文火冰糖的硅基工坊
tags:
篇首语:本文由小常识网(cha138.com)小编为大家整理,主要介绍了[机器学习与scikit-learn-21]:算法-逻辑回归-多项式非线性回归PolynomialFeatures与代码实现相关的知识,希望对你有一定的参考价值。
作者主页(文火冰糖的硅基工坊):文火冰糖(王文兵)的博客_文火冰糖的硅基工坊_CSDN博客
本文网址:https://blog.csdn.net/HiWangWenBing/article/details/123447272
目录
2.1 PolynomialFeatures 这个类有 3 个参数:
第1章 scikit-learn对逻辑回归的支持
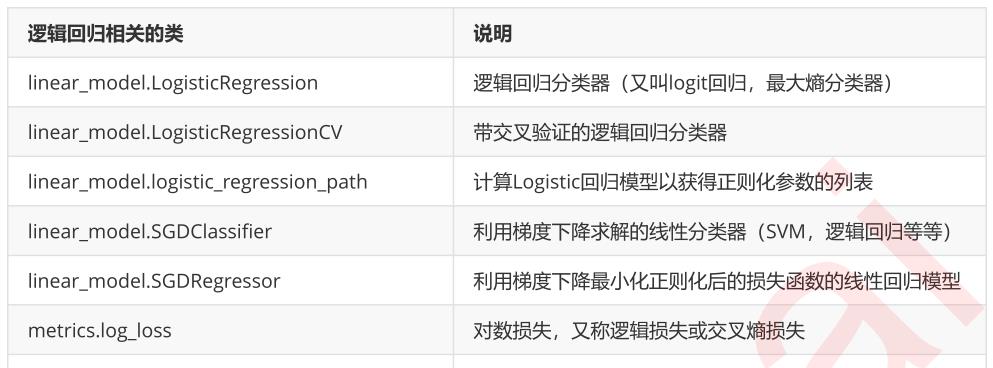
scikit-learn只提供了对线性逻辑回归模型,对于非线性分布的样本,可以通过PolynomialFeatures变换,扩展成维度更高的向量点,最后通过线性模型进行拟合,体现的过程如下:
- PolynomialFeatures
- StandardScaler
- LogisticRegression
非线性回归是指模型是用“n次函数”拟合,然后分类。
适合于数据的分布界限是:非直线,如曲线,抛物线,甚至是圆的情形。
不同的曲线,需要的多项式的次数不同 。
第2章 PolynomialFeatures 类参数详解
2.1 PolynomialFeatures 这个类有 3 个参数:
- degree:控制多项式的次数;
- interaction_only:默认为 False,如果指定为 True,那么就不会有特征自己和自己结合的项,组合的特征中没有 a2a2 和 b2b2;
- include_bias:默认为 True 。如果为 True 的话,那么结果中就会有 0 次幂项,即全为 1 这一列。
2.2 代码演示
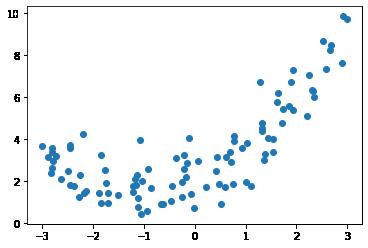
(1)样本数据
import numpy as np
import matplotlib.pyplot as plt
%matplotlib inline

#x从[-3, 3]均匀取值
x = np.random.uniform(-3, 3 ,size=100)

#y是二次方程
y = 0.5 * x**2 + x +2 + np.random.normal(0, 1, size = 100)

print(x.shape)
print(y.shape)

plt.scatter(x, y )
(100,) (100,)
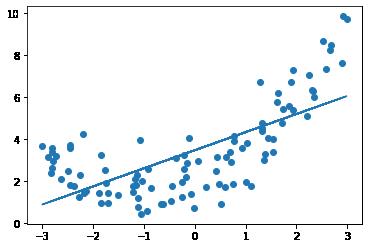
(2)直接线性拟合
from sklearn.linear_model import LinearRegression

#实例化线性模型
line_reg = LinearRegression()

# 扩展成二维矩阵形式
X = x.reshape(-1, 1)

#进行模型的拟合训练
line_reg.fit(X, y)

print("x.shape", x.shape)
print("X.shape", X.shape)

# 进行模型预测
y_predict = line_reg.predict(X)

# 样本图像
plt.scatter(x, y)

# 模型预测图像
plt.plot(x, y_predict)
x.shape (100,) X.shape (100, 1)
(3)二次多项式特征维度扩展
from sklearn.preprocessing import PolynomialFeatures

#degree=2 生成2次特征,可以调整
poly = PolynomialFeatures(degree=2)

# 模型训练拟合
poly.fit(X)

# 多项式维度扩展
X2 = poly.transform(X)

print("X.shape ",X.shape)
print('X2.shape',X2.shape)

X2[0:5, :]
X.shape (100, 1) X2.shape (100, 3)
Out[51]:
array([[ 1.        , -0.47192077,  0.22270922],
       [ 1.        ,  1.43906254,  2.07090101],
       [ 1.        , -1.83938929,  3.38335295],
       [ 1.        , -2.79565518,  7.81568791],
       [ 1.        , -1.75660839,  3.08567303]])
(4)用扩展维度后的特征数据训练线性模型
# 用扩展样本向量维度后的数据进行训练
print("X2.shape", X2.shape)
print(" y.shape", y.shape)
line_reg.fit(X2, y)
X2.shape (100, 3)
 y.shape (100,)

(5)用新训练的模型预测
# 用新的训练后的模型进行预测,得到新的预测数据
y_predict2 = line_reg.predict(X2)
print("y_predict2.shape", y_predict2.shape)

# 画出样本图像
plt.scatter(x, y)

# 画出新的图像
plt.plot(np.sort(x), y_predict2[np.argsort(x)] )
# plt.plot(x, y_predict)

# 对比原来的图,可以发现这次我们的直接很好的拟合了y这个分布。
y_predict2.shape (100,)

第3章 回归代码实现案例
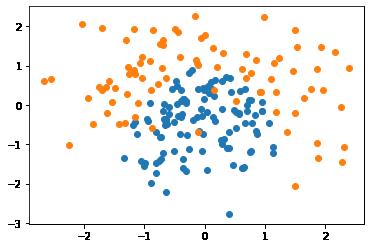
(1)生成、构建训练数据集
# 导入库
import numpy as np
import matplotlib.pyplot as plt

# 创建自动生成的数据集
np.random.seed(0)

# 生成二维随机向量点(X1,X2)
X = np.random.normal(0, 1, size=(200, 2))
X1 = X[:,0]
X2 = X[:,1]
print(X.shape)
print(X1.shape)
print(X2.shape)

# 生成样本二分类的标签:
# 2X+X2  > 1的点标签为1
# 2X+X2 =< 1的点标签为0
# 边界:抛物线边界:x1^2 + x2
Y = np.array((X1**2 + X2) > 1, dtype='int')
print(Y.shape)
print(Y)

# 随机抽取 20个样本,强制其分类为 1,
# 相当于更改数据,添加噪音
for _ in range(10):
    Y[np.random.randint(200)] = 1


# 所有标签y=0的点
plt.scatter(X[Y==0, 0], X[Y==0, 1])

# 所有标签y=1的点
plt.scatter(X[Y==1, 0], X[Y==1, 1])

plt.show()
(200, 2) (200,) (200,) (200,) [1 1 1 0 0 1 0 0 1 0 1 0 1 0 1 0 0 0 1 0 0 1 0 1 1 1 0 0 0 0 0 0 0 1 0 0 0 0 0 0 1 0 1 1 1 1 1 0 1 0 1 1 1 0 1 1 1 0 0 1 0 1 0 1 0 1 0 1 0 0 1 0 1 1 1 1 0 0 0 0 1 0 1 0 1 1 0 1 0 0 0 0 0 1 1 1 0 0 1 1 0 1 0 0 0 1 0 0 0 1 0 0 1 0 0 1 0 1 0 0 0 0 0 1 0 0 0 1 0 1 0 0 1 0 0 0 1 0 0 1 1 1 0 1 1 0 1 1 0 0 1 0 0 0 0 1 0 0 0 0 0 0 1 1 1 0 0 1 1 1 0 0 0 0 0 0 1 0 1 0 0 1 0 0 0 0 0 0 0 0 1 1 0 0 1 0 0 0 1 1]
(2)构建模型并训练模型
# 构建模型并训练模型
from sklearn.model_selection import train_test_split
from sklearn.pipeline import Pipeline
from sklearn.linear_model import LogisticRegression
from sklearn.preprocessing import PolynomialFeatures
from sklearn.preprocessing import StandardScaler

X_train, X_test, Y_train, Y_test = train_test_split(X, Y, random_state=0)


def PolynomialLogisticRegression(degree, penalty='l2',C=1):
    # PolynomialFeatures: 对样本进行多项式变换,把线性样本转换为多项式样本
    # StandardScaler:对样本进行标准化变换
    # LogisticRegression:对样本进行线性逻辑回归
    return Pipeline([
        ('poly',PolynomialFeatures(degree=degree)),
        ('stand_scalor',StandardScaler()),
        ('log_reg',LogisticRegression(penalty=penalty,C=C))
    ])

# 说明:degree决定了多项式的最高次数,这可以是2次,3次,4次。。。。。。
degree = 20
penalty = "l2"
C = 1
poly_log_reg = PolynomialLogisticRegression(degree, penalty, C)

poly_log_reg.fit(X_train, Y_train)

score_train = poly_log_reg.score(X_train, Y_train)
score_test = poly_log_reg.score(X_test, Y_test)

print("训练集分数",score_train)
print("测试集分数:",score_test)
训练集分数 0.96 测试集分数: 0.96
从分数上看,多项式回归预测对二次区分分布的向量点的预测边界要比线性回归要好很多。
(3)可视化模型预测的分类边界
# 可视化训练结果

#可视化决策边界:通过两种预测分类的颜色不同来展示决策的边界
# 背景数据:为二维网格数据点:meshgrid
# 所有用模型预测为1的点,标注红色
# 所有用模型预测为0的点,标注为蓝色
def plot_decision_boundary(model, axis):
    # 生成二维度的网格数据
    x1, x2 = np.meshgrid(
            np.linspace(axis[0], axis[1], int((axis[1]-axis[0])*100)).reshape(-1,1),
            np.linspace(axis[2], axis[3], int((axis[3]-axis[2])*100)).reshape(-1,1)
    )
    print("x1.shape", x1.shape)
    print("x2.shape", x2.shape)

    # 组合X1,X2, 得到(X1,X2)向量点
    X = np.c_[x1.ravel(), x2.ravel()]
    print("X.shape", X.shape)

    # 模型预测分类
    y_predict = model.predict(X)
    print("y_predict.shape=", y_predict.shape)

    # 把一维预测值转换成网格上的点的分类类型
    y = y_predict.reshape(x1.shape)
    print("y.shape=", y.shape)
    print(y)

    from matplotlib.colors import ListedColormap
    custom_cmap = ListedColormap(['#EF9A9A','#FFF59D','#90CAF9'])

    # 彩色打印网格点,网格点的颜色由y的类型确定
    # y的类型,由模型对网格点的预测得到
    plt.contourf(x1, x2, y, linewidth=5, cmap=custom_cmap)

plot_decision_boundary(poly_log_reg, axis=[-3, 3, -3, 3])

# 可视化源样本点
plt.scatter(X[Y==0,0], X[Y==0,1])
plt.scatter(X[Y==1,0], X[Y==1,1])

plt.show()
x1.shape (600, 600) x2.shape (600, 600) X.shape (360000, 2) y_predict.shape= (360000,) y.shape= (600, 600) [[0 0 0 ... 1 1 1] [0 0 0 ... 1 1 1] [0 0 0 ... 1 1 1] ... [1 1 1 ... 1 1 1] [1 1 1 ... 1 1 1] [1 1 1 ... 1 1 1]]
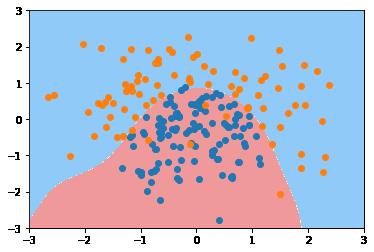
从图形上看,多项式回归预测对二次区分分布的向量点的预测边界要比线性回归要好很多。
作者主页(文火冰糖的硅基工坊):文火冰糖(王文兵)的博客_文火冰糖的硅基工坊_CSDN博客
本文网址:https://blog.csdn.net/HiWangWenBing/article/details/123447272
以上是关于[机器学习与scikit-learn-21]:算法-逻辑回归-多项式非线性回归PolynomialFeatures与代码实现的主要内容,如果未能解决你的问题,请参考以下文章