Google 因果推断的CausalImpact 贝叶斯结构时间序列模型(二十二)
Posted 悟乙己
tags:
篇首语:本文由小常识网(cha138.com)小编为大家整理,主要介绍了Google 因果推断的CausalImpact 贝叶斯结构时间序列模型(二十二)相关的知识,希望对你有一定的参考价值。
之前一篇:跟着开源项目学因果推断——CausalImpact 贝叶斯结构时间序列模型(二十一)
这里另外写一篇来继续研究一下CausalImpact这个开源库的一些细节的
1 CausalImpact 一些可调参数
1.1 CausalImpact默认的两种算法
CausalImpact默认使用TensorFlow Probability来求的两种算法,分别是Variational Inference和Hamiltonian Monte Carlo
- VI,变分推断,变分推断(Variational Inference)进展简述
- HMC,哈密尔顿蒙特卡洛 (HMC) ,参考:如何简单地理解「哈密尔顿蒙特卡洛 (HMC)」?
其中都可以使用GPU来加速,因为使用的是Tensorflow,但是HMC非常慢,复杂一些的算法很容易超过1H
切换的方式:
# HMC
ci = CausalImpact(data, pre_period, post_period, model_args='fit_method': 'hmc')

# VI
ci = CausalImpact(data, pre_period, post_period, model_args='fit_method': 'vi')
1.2 model_args的可调节模型参数
CausalImpact中,model_args还可以做几种修改:
standardize: bool
   If `True`, standardizes data to have zero mean and unitary standard
   deviation.
prior_level_sd: Optional[float]
   Prior value for the local level standard deviation. If `None` then an
   automatic optimization of the local level is performed. This is
   recommended when there's uncertainty about what prior value is
   appropriate for the data.
   In general, if the covariates are expected to be good descriptors of the
   observed response then this value can be low (such as the default of
   0.01). In cases when the linear regression is not quite expected to fully
   explain the observed data, the value 0.1 can be used.
fit_method: str
   Which method to use for the Bayesian algorithm. Can be either 'vi'
   (default) or 'hmc' (more precision but much slower).
nseasons: int
 Specifies the duration of the period of the seasonal component; if input
 data is specified in terms of days, then choosing nseasons=7 adds a weekly
 seasonal effect.
season_duration: int
 Specifies how many data points each value in season spans over. A good
 example to understand this argument is to consider a hourly data as input.
 For modeling a weekly season on this data, one can specify `nseasons=7` and
 season_duration=24 which means each value that builds the season component
 is repeated for 24 data points. Default value is 1 which means the season
 component spans over just 1 point (this in practice doesn't change
 anything). If this value is specified and bigger than 1 then `nseasons`
 must be specified and bigger than 1 as well.
其中,
standardize = True,需要给入的数据就是标准化过的;nseasons: int,如果想by week来看影响,可以设置为:
ci = CausalImpact(data, pre_period, post_period,nseasons=['period': 7],trend=True)
prior_level_sd,设定先验标准差season_duration: int,这个要与nseasons联合来看
举一个例子,比如我们现在有by hour的数据,然后我们希望By week来看效果,那么需要设定为:
df = pd.DataFrame('tests/fixtures/arma_data.csv')
df = df.set_index(pd.date_range(start='20200101', periods=len(data), freq='H'))
pre_period = ['20200101 00:00:00', '20200311 23:00:00']
post_period = ['20200312 00:00:00', '20200410 23:00:00']
ci = CausalImpact(df, pre_period, post_period, model_args='nseasons': 7,   'season_duration': 24)
print(ci.summary())
这里可以这么理解,如果是Hour粒度数据需要By week看,那就需要每隔 7*24个数据点作为一个batch,所以这里就是nseasons * season_duration
1.3 CausalImpact自定义模型
如果除了提供的VI / HMC都不满足,自己可以自定义:
      import tensorflow_probability as tfp


      pre_y = data[:70, 0]
      pre_X = data[:70, 1:]
      obs_series = data.iloc[:, 0]
      local_linear = tfp.sts.LocalLinearTrend(observed_time_series=obs_series)
      seasonal = tfp.sts.Seasonal(nseasons=7, observed_time_series=obs_series)
      model = tfp.sts.Sum([local_linear, seasonal], observed_time_series=obs_series)

      ci = CausalImpact(data, pre_period, post_period, model=model)
      print(ci.summary())
分别在3.7.4 和 2.3的案例中都会采用自定义
1.4 CausalImpact如何数据标准化
来看一个来自[test_main.py ],数据是官方项目里面的数据,例子:
import numpy as np
import pandas as pd
import pytest
import tensorflow as tf
import tensorflow_probability as tfp
from numpy.testing import assert_array_equal
from pandas.util.testing import assert_frame_equal

from causalimpact import CausalImpact
from causalimpact.misc import standardize

data = pd.read_csv('tests/fixtures/btc.csv', parse_dates=True, index_col='Date')
training_start = "2020-12-01"
training_end = "2021-02-05"
treatment_start = "2021-02-08"
treatment_end = "2021-02-09"
pre_period = [training_start, training_end]
post_period = [treatment_start, treatment_end]

pre_data = rand_data.loc[pre_int_period[0]: pre_int_period[1], :]
# 标准化
normed_pre_data, (mu, sig) = standardize(pre_data)
# mu / sig如何让原数据post_data  ->  标准化之后的normed_post_data

normed_post_data = (post_data - mu) / sig
使用causalimpact.misc进行标准化;
如果你自行标准化之后,在训练模型的时候,需要:
model_args == 'fit_method': 'hmc', 'niter': 1000, 'prior_level_sd': 0.01, 'season_duration': 1, 'nseasons': 1, 'standardize': True
2 协变量回归系数解读
在整个模型中会有:
y
t
=
Z
t
T
α
t
+
β
X
t
+
G
t
ϵ
t
y_t = Z^T_t\\alpha_t + \\beta X_t + G_t\\epsilon_t
yt=ZtTαt+βXt+Gtϵt
其中线性部分,拆出来单独理解
2.1 Horseshoe prior的Bayes回归
来自统计之都的一篇文章先认识一下Horseshoe prior:
使用Horseshoe 先验的Bayes回归及代码解析
以及:
稀疏数据分析:马蹄估计量及其理论性质
也贴一段,tensorflow_probability感觉写的很好:
  The Cauchy scale parameters puts substantial mass near zero, encouraging
  weights to be sparse, but their heavy tails allow weights far from zero to be
  estimated without excessive shrinkage. The horseshoe can be thought of as a
  continuous relaxation of a traditional 'spike-and-slab' discrete sparsity
  prior, in which the latent Cauchy scale mixes between 'spike'
  (`scales[i] ~= 0`) and 'slab' (`scales[i] >> 0`) regimes.
  Following the recommendations in [2], `SparseLinearRegression` implements
  a horseshoe with the following adaptations:
  - The Cauchy prior on `scales[i]` is represented as an InverseGamma-Normal
    compound.
  - The `global_scale` parameter is integrated out following a `Cauchy(0.,
    scale=weights_prior_scale)` hyperprior, which is also represented as an
    InverseGamma-Normal compound.
  - All compound distributions are implemented using a non-centered
    parameterization.
  The compound, non-centered representation defines the same marginal prior as
  the original horseshoe (up to integrating out the global scale),
  but allows samplers to mix more efficiently through the heavy tails; for
  variational inference, the compound representation implicity expands the
  representational power of the variational model.
  Note that we do not yet implement the regularized ('Finnish') horseshoe,
  proposed in [2] for models with weak likelihoods, because the likelihood
  in STS models is typically Gaussian, where it's not clear that additional
  regularization is appropriate. If you need this functionality, please
  email tfprobability@tensorflow.org.
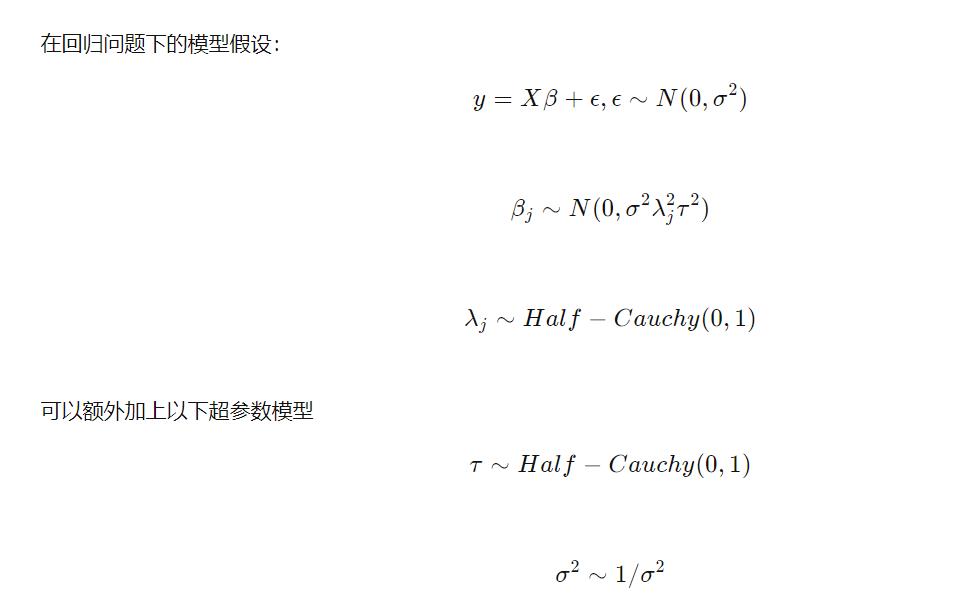
Horseshoe prior是一种稀疏bayes监督学习的方法。通过对模型参数的先验分布中加入稀疏特征,从而得到稀疏的估计。
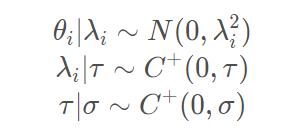
horseshoe prior属于multivariate scale mixtures of normals的分布族。所以和其他常用的稀疏bayes学习方法,Laplacian prior, (Lasso), Student-t prior,非常类似。

其中
λ
j
\\lambda_j
λj 叫做local shrinkage parameter,局部压缩参数,对于不同的
θ
j
\\theta_j
θj 可以有不同的压缩系数,
τ
\\tau
τ 叫做global shrinkage parameter
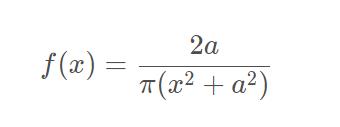
其中,half-Cauchy分布的概率密度函数:

回看上面三层先验,上面
a
a
a就可以带入各自的先验:

考虑
λ
i
\\lambda_i
λi 的边缘先验分布

定义
κ
i
=
1
/
(
1
+
λ
i
2
)
\\kappa_i=1/(1+\\lambda_i^2)
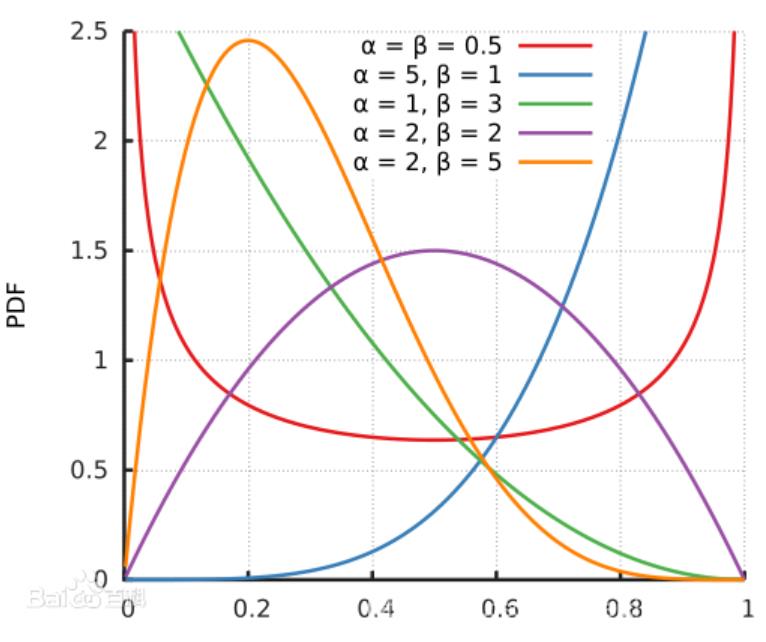
κi=1/(1+λi2)这个量在Bayesian shrinkage中非常重要,我们在下一个小标题介绍它的意义,但我们可以先分析它的先验分布。现在我们只想做一点定性分析,了解一下
κ
i
\\kappa_i
κi 的先验的形状,所以简单起见假设
σ
=
τ
=
1
\\sigma=\\tau=1
σ=τ=1,于是

因此
k
i
∼
B
e
t
a
(
1
/
2
,
1
/
2
)
ki \\sim Beta(1/2,1/2)
ki∼Beta(1/2,1/2),来看
k
i
ki
ki的先验分布,这里可以看到
a
a
a=
β
\\beta
β=0.5的时候,就会出现马蹄状,基于这种先验的贝叶斯方法被称为马蹄估计。

这里有一段tensorflow_probability 中的评价:
The Cauchy scale parameters puts substantial mass near zero, encouraging   weights to be sparse, but their heavy tails allow weights far from zero to be   estimated without excessive shrinkage.
The horseshoe can be thought of as a   continuous relaxation of a traditional 'spike-and-slab' discrete sparsity   prior, in which the latent Cauchy scale mixes between 'spike'   (`scales[i] ~= 0`) and 'slab' (`scales[i] >> 0`) regimes.
2.2 SparseLinearRegression的weight计算逻辑
因为在CausalImpact 会使用SparseLinearRegression,我来看一下回归部分的系数weight求解,参考下面公式:

来到tensorflow_probability的源代码中看到:
This is identical to `tfp.sts.LinearRegression`, except that `SparseLinearRegression` uses a parameterization of a Horseshoe prior [1][2] to encode the assumption that many of the `weights` are zero, i.e., many of the covariate time series are irrelevant.
可以看到local scales 是服从HalfCauchy分布:
scales[i] ~ HalfCauchy(loc=0, scale=1)
weights[i] ~ Normal(loc=0., scale=scales[i] * global_scale)`
由伪代码来看整个回归系数计算过程:
# Sample global_scale from Cauchy(0, scale=weights_prior_scale).
global_scale_variance ~ InverseGamma(alpha=0.5, beta=0.5)
global_scale_noncentered ~ HalfNormal(loc=0, scale=1)
global_scale = (global_scale_noncentered *
               sqrt(global_scale_variance) *
               weights_prior_scale)
# Sample local_scales from Cauchy(0, 1).
local_scale_variances[i] ~ InverseGamma(alpha=0.5, beta=0.5)
local_scales_noncentered[i] ~ HalfNormal(loc=0, scale=1)
local_scales[i] = local_scales_noncentered[i] * sqrt(local_scale_variances[i])
weights[i] ~ Normal(loc=0., scale=local_scales[i] * global_scale)
从weights[i] ~ Normal(loc=0., scale=local_scales[i] * global_scale)开始反着看,weight = local的
λ
j
\\lambda_j
λj 和 global的
τ
\\tau
τ 的相乘。
2.3 案例推导回归系数的计算
如果默认VI算法的情况下:
import numpy as np
import pandas as pd
import pytest
import tensorflow as tf
import tensorflow_probability as tfp
from numpy.testing import assert_array_equal
from pandas.util.testing import assert_frame_equal

from causalimpact import CausalImpact
from causalimpact.misc import standardize

data = pd.read_csv('../tests/fixtures/btc.csv', parse_dates=True, index_col='Date')
training_start = "2020-12-01"
training_end = "2021-02-05"
treatment_start = "2021-02-08"
treatment_end = "2021-02-09"
pre_period = [training_start, training_end]
post_period = [treatment_start, treatment_end]


rand_data = data
pre_int_period = pre_period
post_int_period = post_period
ci = CausalImpact(rand_data, pre_int_period, post_int_period)


for name, values in ci.model_samples.items():
    print(f'name: values.numpy().mean(axis=0)')
本来官方教程里面默认算法下的一些标准差为:
print('Mean value of noise observation std: ', ci.model_samples[0].numpy().mean())
print('Mean value of level std: ', ci.model_samples[1].numpy().mean())
print('Mean value of linear regression x0, x1: ', ci.model_samples[2].numpy().mean(axis=0))
可以看到三个比较明显的指标,noise std,level std,回归系数。
那么现在的版本,可以看到ci.model_samples是一个dict形,然后得出有,
observation_noise_scale: 0.455566942691803
LocalLevel/_level_scale: 0.01129493024200201
SparseLinearRegression/_global_scale_variance: 0.8674567341804504
SparseLinearRegression/_global_scale_noncentered: 0.9352844953536987
SparseLinearRegression/_local_scale_variances: [1.4979423  1.3915676  2.5401886  0.82398146 1.3655316  1.3455669
 1.2680935  0.9430675  2.4824152 ]
SparseLinearRegression/_local_scales_noncentered: [0.6454335  1.1153866  1.5575289  0.39585915 0.85925627 0.964816
 0.7337909  0.7373393  1.4985642 ]
SparseLinearRegression/_weights_noncentered: [-0.31404912  1.3935399   1.904644   -0.769298    0.7848593   0.53083557
  0.9080193   0.37757748  1.6231401 ]
observation_noise_scale 和 LocalLevel/_level_scale 与之前一样,这里LR改成了,特有的SparseLinearRegression
再返回CausalImpact 的输出结果:
- causalimpact 的issue
- tensorflow_probability
先来看tensorflow_probability 的源码,可以从Line298开始看:
  def params_to_weights(
                        global_scale_variance,
                        global_scale_noncentered,
                        local_scale_variances,
                        local_scales_noncentered,
                        weights_noncentered,
  weights_prior_scale = 0.1):
    """Build regression weights from model parameters."""
    global_scale = (global_scale_noncentered *
                    tf.sqrt(global_scale_variance) *
                    weights_prior_scale)

    local_scales = local_scales_noncentered * tf.sqrt(local_scale_variances)
    return weights_noncentered * local_scales * global_scale[..., tf.newaxis]
其中weights_prior_scale是The weights_prior_scale determines the level of sparsity; small scales encourage the weights to be sparse. 是先验分布的参数,决定稀疏程度,一般默认为0.1
再来看一下weight输出的结果,是weights.shape == [num_users, num_features],不像之前
再是causalimpact 的issue,参考 :
Printing averages of the posterior does not work #24
import tensorflow as tf


weights_prior_scale = 0.1
global_scale_nonentered = param_samples['SparseLinearRegression/_global_scale_noncentered']
global_scale_variance = param_samples['SparseLinearRegression/_global_scale_variance']
local_scales_noncentered = param_samples['SparseLinearRegression/_local_scales_noncentered']
local_scale_variances = param_samples['SparseLinearRegression/_local_scale_variances']
global_scale = global_scale_nonentered * tf.sqrt(global_scale_variance) * weights_prior_scale
weights_noncented = param_samples['SparseLinearRegression/_weights_noncentered']
local_scales = local_scales_noncentered * tf.sqrt(local_scale_variances)

weights = weights_noncented * local_scales * global_scale[..., tf.newaxis]

# 按样本的权重,100个
weights.numpy().mean(axis=1)

# 按特征的权重 ,2个
weights.numpy().mean(axis=0)

# 所有的平均权重,1个
weights.numpy().mean(axis=1).mean()
如果有了weight,那如何进行预测,可以简单看一下预测的逻辑:
predicted_timeseries = self.design_matrix.matmul(weights[..., tf.newaxis])
以上是关于Google 因果推断的CausalImpact 贝叶斯结构时间序列模型(二十二)的主要内容,如果未能解决你的问题,请参考以下文章