如何将D3.js的酷炫延续到Python中?
Posted qq_21478261
tags:
篇首语:本文由小常识网(cha138.com)小编为大家整理,主要介绍了如何将D3.js的酷炫延续到Python中?相关的知识,希望对你有一定的参考价值。
Python的Matplotlib可视化库与javascript的D3js强交互可视化库结合后,mpld3诞生,mpld3弥补Matplotlib的弱交互能力,可将matplotlib图像导出为html代码,进而运用于浏览器网页、博客等中。
安装
pip install mpld3mpld3常规交互
Matplotlib案例
mpld3辅助Matplotlib开启交互模式,仅需一行代码mpld3.enable_notebook()或者mpld3.display()
import matplotlib.pyplot as plt
import mpld3  #导入mpld3
import numpy as np

plt.style.use('bmh')
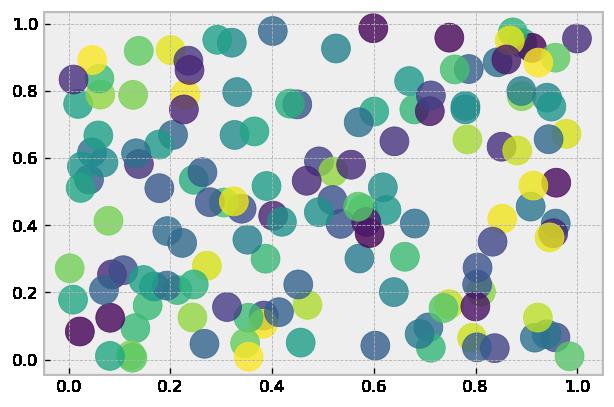
plt.figure(dpi=120)
plt.scatter(np.random.random(150),
            np.random.random(150),
            s=300,
            c=np.random.random(150),
            alpha=0.8)

mpld3.enable_notebook()  #jupyter notebook中渲染图形
#mpld3.display() #同上,jupyter notebook中渲染图形 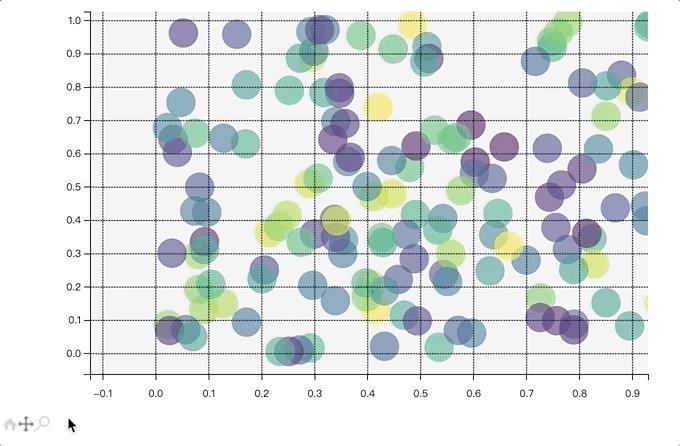
mpld3.disable_notebook() 关闭交互模式,
import matplotlib.pyplot as plt
import mpld3  #导入mpld3
import numpy as np

plt.style.use('bmh')
plt.figure(dpi=120)
plt.scatter(np.random.random(150),
            np.random.random(150),
            s=300,
            c=np.random.random(150),
            alpha=0.8)

mpld3.disable_notebook() #关闭mpld3交互,恢复默认matplotlib样式
Seaborn案例
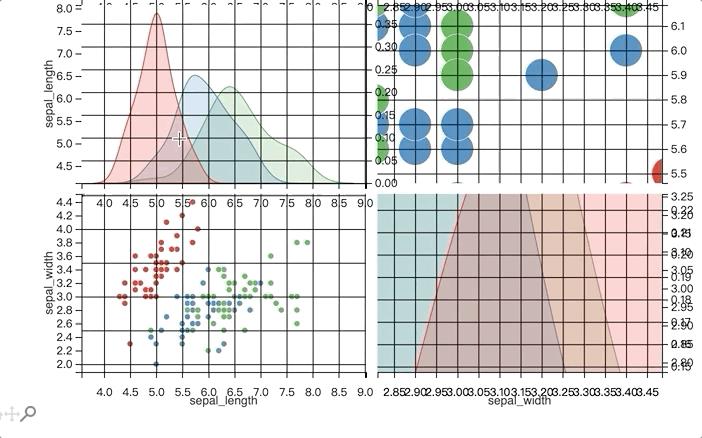
Seaborn底层是Matplotlib,所以mpld3对Seaborn同样奏效,拿矩阵图为例,
import seaborn as sns
iris_sns = sns.load_dataset("iris")
g = sns.pairplot(
    iris_sns,
    hue='species',
    palette='Set1',  #使用传入的颜色list
    vars=['sepal_length', 'sepal_width'])
g.fig.set_size_inches(12,6)
mpld3.enable_notebook()
mpld3的Plugins特性
mpld3除了常规交互能力,另一个重要特性就是插件功能,插件功能可为绘图定制额外交互功能,
刷选联动插件案例
from mpld3 import plugins

fig, ax = plt.subplots(3, 3, dpi=150)
fig.subplots_adjust()
ax = ax[::-1]

X = np.random.normal(size=(3, 100))
for i in range(3):
    for j in range(3):
        ax[i, j].xaxis.set_major_formatter(plt.NullFormatter())
        ax[i, j].yaxis.set_major_formatter(plt.NullFormatter())
        points = ax[i, j].scatter(X[j], X[i], c=np.random.random(100))

plugins.connect(fig, plugins.LinkedBrush(points))
mpld3.enable_notebook()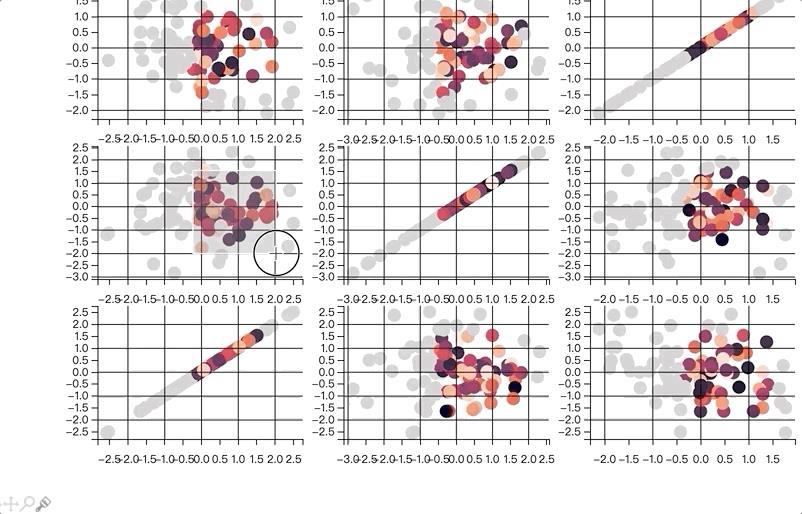
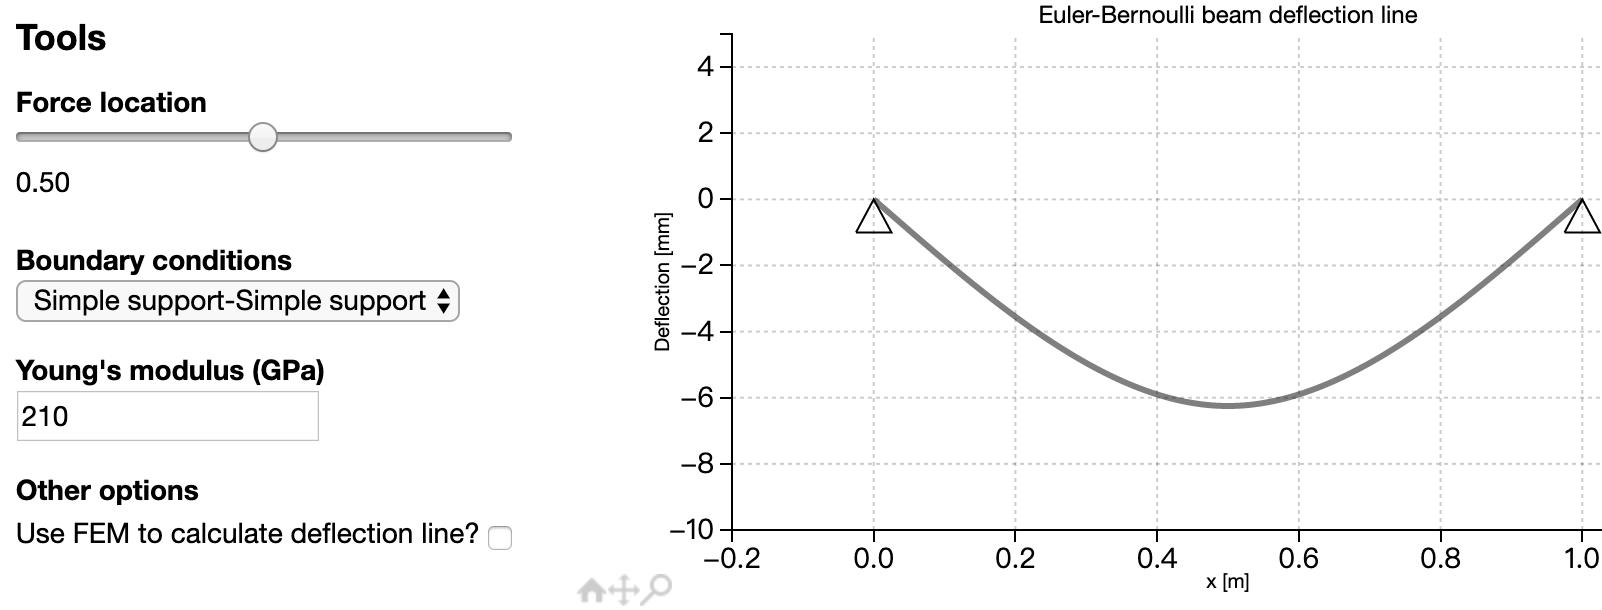
滚动插件案例
以上是关于如何将D3.js的酷炫延续到Python中?的主要内容,如果未能解决你的问题,请参考以下文章
