SpringCloud H版 Hystrix dashboard 可视化监控使用
Posted 小毕超
tags:
篇首语:本文由小常识网(cha138.com)小编为大家整理,主要介绍了SpringCloud H版 Hystrix dashboard 可视化监控使用相关的知识,希望对你有一定的参考价值。
一、hystrix dashboard
在前面的文章中我们介绍了 hystrix 的服务降级、熔断、限流等,但是对比alibaba cloud 的Sentinel 框架,Sentinel 可是有可视化的页面做规则动态修改,虽然 hystrix 已经比不上Sentinel ,但hystrix 也是有可视化页面的,不过只能进行监控。
上篇文章地址:https://blog.csdn.net/qq_43692950/article/details/121998205
Hystrix会持续地记录所有通过Hystrix发起的请求的执行信息,并以统计报表和图形的形式展示给用户,包括每秒执行多少请求多少成功,多少失败等。Netflix通过hystrix-metrics-event-stream项目实现了对以上指标的监控。Spring Cloud也提供了Hystrix Dashboard的整合,对监控内容转化成可视化界面。
二、创建 hystrix dashboard
我们还是根据前面的文章中的项目继续,这里还是使用的SpringCloud H版的SR9:
    <properties>
        <java.version>1.8</java.version>
        <project.build.sourceEncoding>UTF-8</project.build.sourceEncoding>
        <project.reporting.outputEncoding>UTF-8</project.reporting.outputEncoding>
        <spring-boot.version>2.3.7.RELEASE</spring-boot.version>
        <spring-cloud.version>Hoxton.SR9</spring-cloud.version>
        <model.version>0.0.1-SNAPSHOT</model.version>
    </properties>
<dependencyManagement>
    <dependencies>
        <dependency>
            <groupId>org.springframework.boot</groupId>
            <artifactId>spring-boot-dependencies</artifactId>
            <version>$spring-boot.version</version>
            <type>pom</type>
            <scope>import</scope>
        </dependency>

        <dependency>
            <groupId>org.springframework.cloud</groupId>
            <artifactId>spring-cloud-dependencies</artifactId>
            <version>$spring-cloud.version</version>
            <type>pom</type>
            <scope>import</scope>
        </dependency>

    </dependencies>
</dependencyManagement>
下面在dashboard项目中的pom中引入依赖:
<dependency>
    <groupId>org.springframework.cloud</groupId>
    <artifactId>spring-cloud-starter-netflix-hystrix-dashboard</artifactId>
</dependency>

<dependency>
    <groupId>org.springframework.boot</groupId>
    <artifactId>spring-boot-starter-actuator</artifactId>
</dependency>
配置文件内容:
server:
  port: 9091
spring:
  application:
    name: hystrix-dashboard
hystrix:
  dashboard:
    proxy-stream-allow-list: "localhost"
主启动类,添加@EnableHystrixDashboard注解
@SpringBootApplication
@EnableHystrixDashboard
public class HystrixDashBoardApplication
    public static void main(String[] args)
        SpringApplication.run(HystrixDashBoardApplication.class, args);
下面启动项目,浏览器输入http://localhost:9091/hystrix 即可进入dashboard页面。
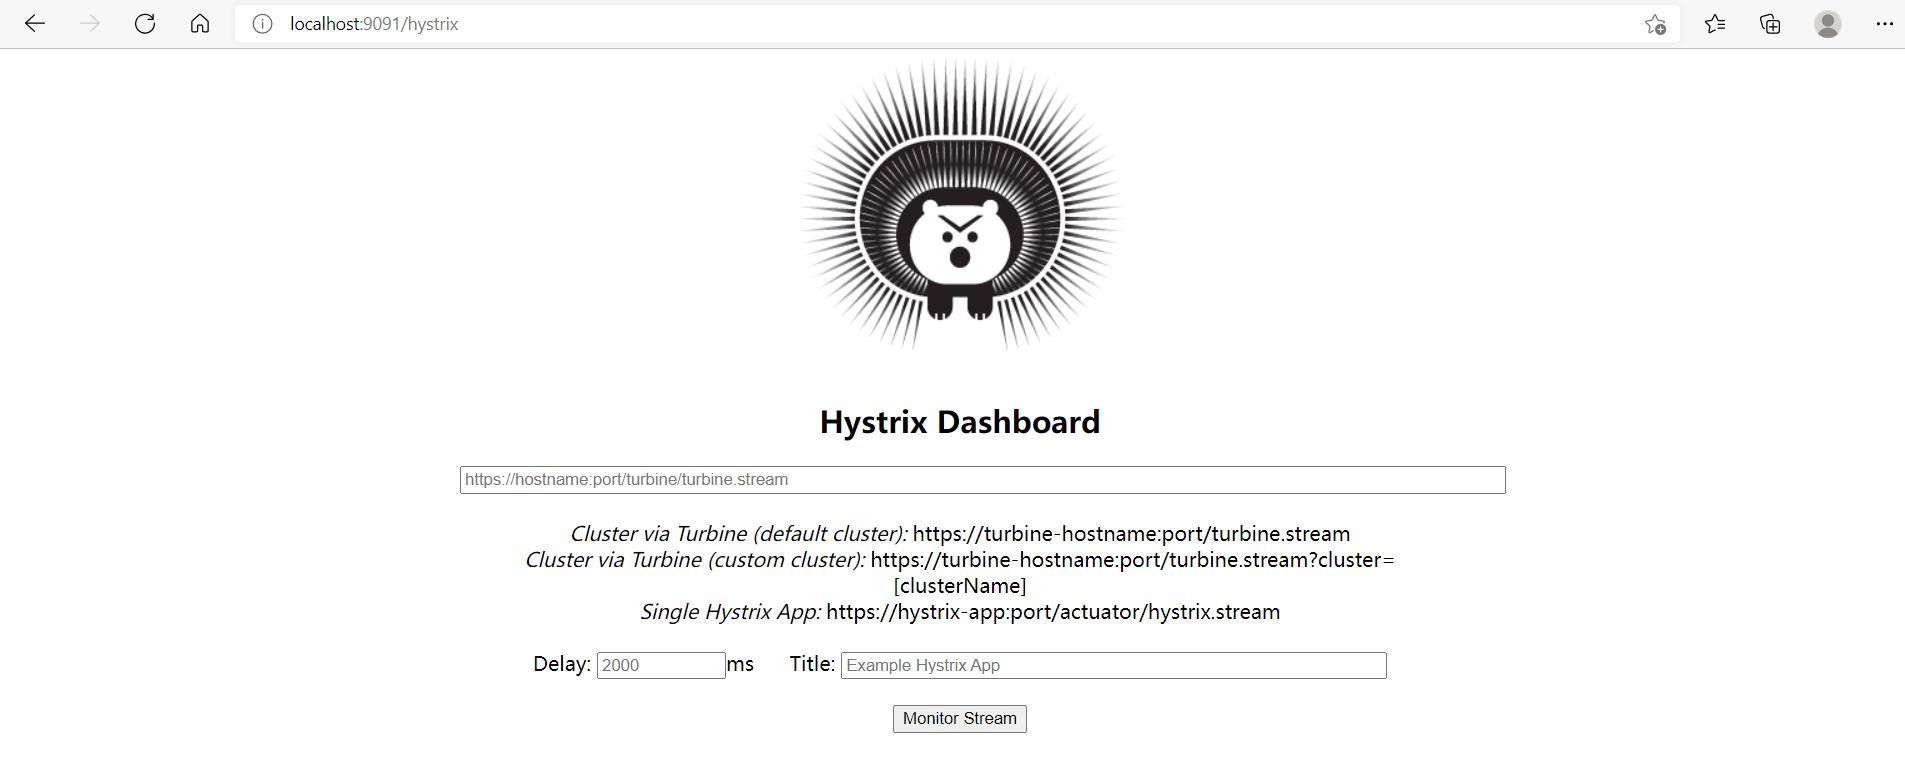
中间的输入框就代表要监控那个节点的数据,我们可以选择上篇文章我们演示的项目 ,输入:http://localhost:8080/hystrix.stream 点击下面的 Monitor Stream
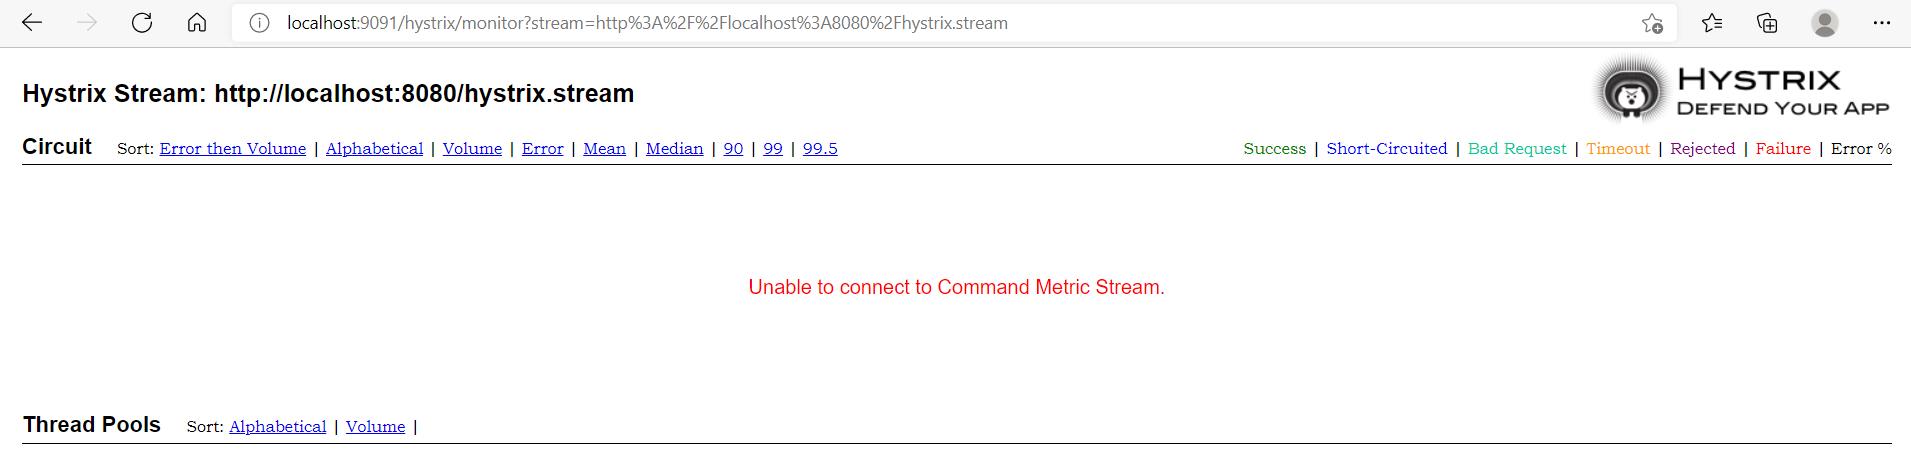
可以看到并没有连接上,被监控端需要添加一个配置:
 /**
  *此配置是为了服务监控而配置,与服务容错本身无关,springcloud升级后的坑
  *ServletRegistrationBean因为springboot的默认路径不是"/hystrix.stream",
  *只要在自己的项目里配置上下面的servlet就可以了
  */
 @Bean
 public ServletRegistrationBean getServlet()
     HystrixMetricsStreamServlet streamServlet = new HystrixMetricsStreamServlet();
     ServletRegistrationBean registrationBean = new ServletRegistrationBean(streamServlet);
     registrationBean.setLoadOnStartup(1);
     registrationBean.addUrlMappings("/hystrix.stream");
     registrationBean.setName("HystrixMetricsStreamServlet");
     return registrationBean;
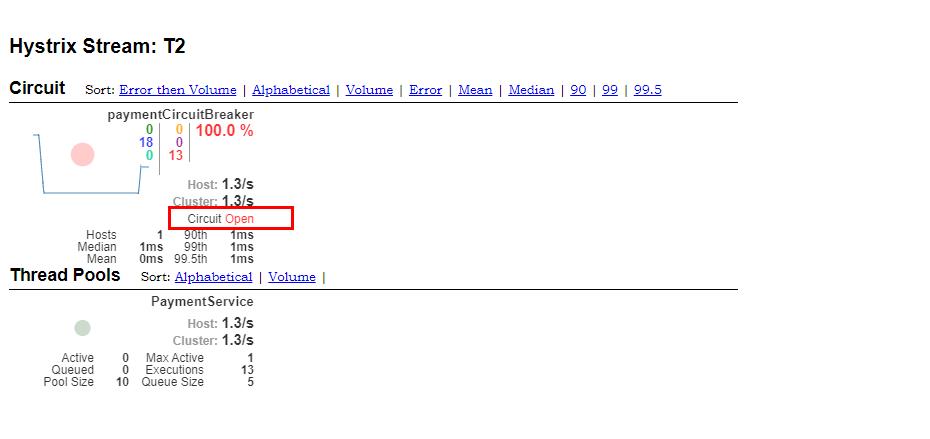
重启被监控端,再次查看,即可看到监控信息。

喜欢的小伙伴可以关注我的个人微信公众号,获取更多学习资料!
以上是关于SpringCloud H版 Hystrix dashboard 可视化监控使用的主要内容,如果未能解决你的问题,请参考以下文章