Python绘制概率分布直方图
Posted hhh江月
tags:
篇首语:本文由小常识网(cha138.com)小编为大家整理,主要介绍了Python绘制概率分布直方图相关的知识,希望对你有一定的参考价值。
Python绘制概率分布直方图
一、代码
1、案例一
import random
import numpy as np
import matplotlib.pyplot as plt

X = np.random.normal(loc=10, scale=2, size=(1, 1000))[0]

Y = np.random.normal(loc=10, scale=1.0, size=(1, 1000))[0]

P = np.ones(1000)
P[:600] = 0
np.random.shuffle(P)
# print(P)

Z = X + Y * P

plt.hist(Z, density=True, bins=150)
plt.show()
2、案例二
import random
import numpy as np
import matplotlib.pyplot as plt

n = 1000
# p = 0.4
U = []

for i in range(1000):


    X = np.random.normal(loc=10, scale=2, size=(1, n))[0]

    Y = np.random.normal(loc=10, scale=1.0, size=(1, n))[0]

    P = np.ones(n)
    P[:600] = 0
    np.random.shuffle(P)

    Z = X + Y * P

    a = 1 / pow(n * np.var(Z), 1/2)

    b = sum(Z) - n * np.mean(Z)

    u = a * b

    U.append(u)

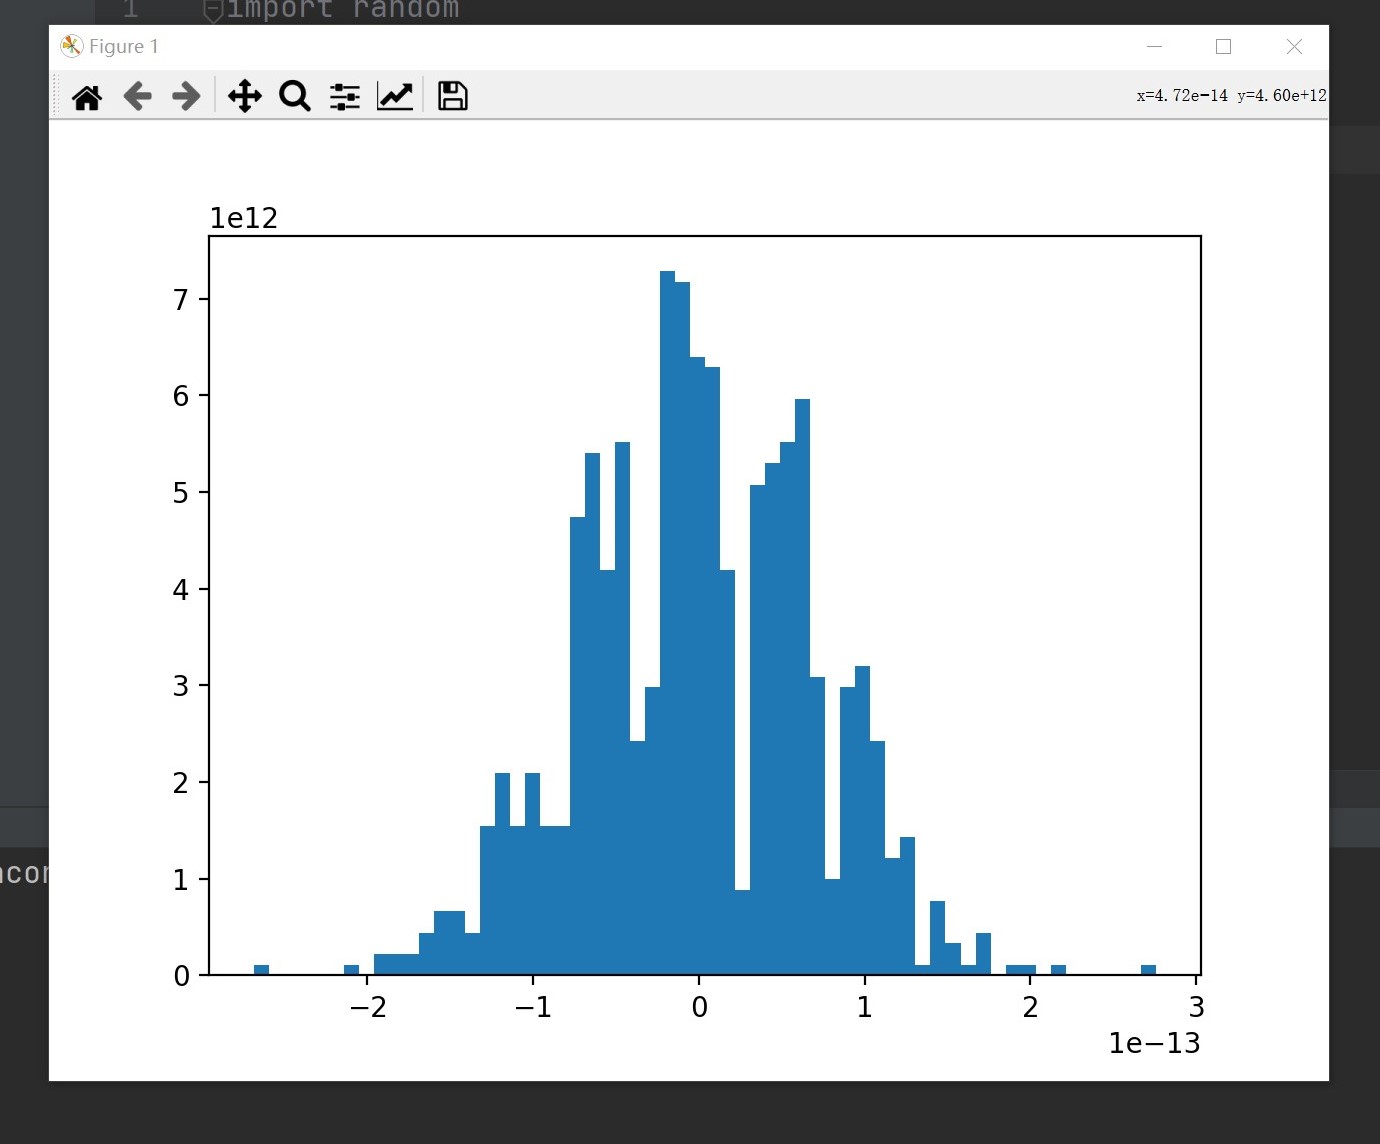
plt.hist(U, density=True, bins=60)
plt.show()
二、运行效果
1、案例一

2、案例二

最后,感谢大家的阅读与支持,谢谢大家了啦。
以上是关于Python绘制概率分布直方图的主要内容,如果未能解决你的问题,请参考以下文章