Python数据分析与可视化Seaborn数据可视化(实训五)
Posted ZSYL
tags:
篇首语:本文由小常识网(cha138.com)小编为大家整理,主要介绍了Python数据分析与可视化Seaborn数据可视化(实训五)相关的知识,希望对你有一定的参考价值。
泰坦尼克号幸存者数据分析与可视化
Seaborn初探
import pandas as pd
import numpy as np
import seaborn as sns
import matplotlib.pyplot as plt
plt.rcParams['font.sans-serif']=['simhei']
plt.rcParams['font.serif'] = ['simhei']

import warnings
warnings.filterwarnings('ignore')
from matplotlib.font_manager import FontProperties
myfont=FontProperties(fname=r'C:\\Windows\\Fonts\\SimHei.ttf',size=12)
sns.set(font=myfont.get_name())
df = pd.read_csv('.\\data\\StudentPerformance.csv')
df.head(4)
| gender | NationalITy | PlaceofBirth | StageID | GradeID | SectionID | Topic | Semester | Relation | raisedhands | VisITedResources | AnnouncementsView | Discussion | ParentAnsweringSurvey | ParentschoolSatisfaction | StudentAbsenceDays | Class | |
|---|---|---|---|---|---|---|---|---|---|---|---|---|---|---|---|---|---|
| 0 | M | KW | KuwaIT | lowerlevel | G-04 | A | IT | F | Father | 15 | 16 | 2 | 20 | Yes | Good | Under-7 | M |
| 1 | M | KW | KuwaIT | lowerlevel | G-04 | A | IT | F | Father | 20 | 20 | 3 | 25 | Yes | Good | Under-7 | M |
| 2 | M | KW | KuwaIT | lowerlevel | G-04 | A | IT | F | Father | 10 | 7 | 0 | 30 | No | Bad | Above-7 | L |
| 3 | M | KW | KuwaIT | lowerlevel | G-04 | A | IT | F | Father | 30 | 25 | 5 | 35 | No | Bad | Above-7 | L |
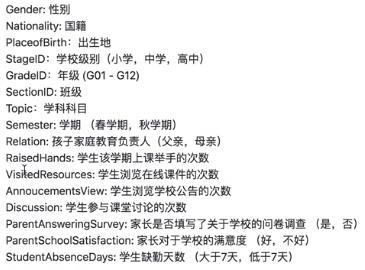
df.rename(columns='gender':'性别','NationalITy':'国籍','PlaceofBirth':'出生地',
                   'StageID':'学段','GradeID':'年级','SectionID':'班级','Topic':'科目',
                  'Semester':'学期','Relation':'监管人','raisedhands':'举手次数',
                  'VisITedResources':'浏览课件次数','AnnouncementsView':'浏览公告次数',
                  'Discussion':'讨论次数','ParentAnsweringSurvey':'父母问卷',
                  'ParentschoolSatisfaction':'家长满意度','StudentAbsenceDays':'缺勤次数',
                   'Class':'成绩',inplace=True)
df.replace('lowerlevel':'小学','MiddleSchool':'中学','HighSchool':'高中',inplace=True)
df.columns
Index(['性别', '国籍', '出生地', '学段', '年级', '班级', '科目', '学期', '监管人', '举手次数',
       '浏览课件次数', '浏览公告次数', '讨论次数', '父母问卷', '家长满意度', '缺勤次数', '成绩'],
      dtype='object')
print('学段取值:',df['学段'].unique())
print('学期取值:',df['学期'].unique())
学段取值: ['小学' '中学' '高中']
学期取值: ['F' 'S']
df.replace('lowerlevel':'小学','MiddleSchool':'中学','HighSchool':'高中',inplace=True)
df['性别'].replace('M':'男','F':'女',inplace=True)
df['学期'].replace('S':'春季','F':'秋季',inplace=True)
df.head(4)
| 性别 | 国籍 | 出生地 | 学段 | 年级 | 班级 | 科目 | 学期 | 监管人 | 举手次数 | 浏览课件次数 | 浏览公告次数 | 讨论次数 | 父母问卷 | 家长满意度 | 缺勤次数 | 成绩 | |
|---|---|---|---|---|---|---|---|---|---|---|---|---|---|---|---|---|---|
| 0 | 男 | KW | KuwaIT | 小学 | G-04 | A | IT | 秋季 | Father | 15 | 16 | 2 | 20 | Yes | Good | Under-7 | M |
| 1 | 男 | KW | KuwaIT | 小学 | G-04 | A | IT | 秋季 | Father | 20 | 20 | 3 | 25 | Yes | Good | Under-7 | M |
| 2 | 男 | KW | KuwaIT | 小学 | G-04 | A | IT | 秋季 | Father | 10 | 7 | 0 | 30 | No | Bad | Above-7 | L |
| 3 | 男 | KW | KuwaIT | 小学 | G-04 | A | IT | 秋季 | Father | 30 | 25 | 5 | 35 | No | Bad | Above-7 | L |
print(df.shape)
(480, 17)
df.isnull().sum()
性别        0
国籍        0
出生地       0
学段        0
年级        0
班级        0
科目        0
学期        0
监管人       0
举手次数      0
浏览课件次数    0
浏览公告次数    0
讨论次数      0
父母问卷      0
家长满意度     0
缺勤次数      0
成绩        0
dtype: int64
df.describe()
# df.describe(include='all')
| 举手次数 | 浏览课件次数 | 浏览公告次数 | 讨论次数 | |
|---|---|---|---|---|
| count | 480.000000 | 480.000000 | 480.000000 | 480.000000 |
| mean | 46.775000 | 54.797917 | 37.918750 | 43.283333 |
| std | 30.779223 | 33.080007 | 26.611244 | 27.637735 |
| min | 0.000000 | 0.000000 | 0.000000 | 1.000000 |
| 25% | 15.750000 | 20.000000 | 14.000000 | 20.000000 |
| 50% | 50.000000 | 65.000000 | 33.000000 | 39.000000 |
| 75% | 75.000000 | 84.000000 | 58.000000 | 70.000000 |
| max | 100.000000 | 99.000000 | 98.000000 | 99.000000 |
df.info()
<class 'pandas.core.frame.DataFrame'>
RangeIndex: 480 entries, 0 to 479
Data columns (total 17 columns):
性别        480 non-null object
国籍        480 non-null object
出生地       480 non-null object
学段        480 non-null object
年级        480 non-null object
班级        480 non-null object
科目        480 non-null object
学期        480 non-null object
监管人       480 non-null object
举手次数      480 non-null int64
浏览课件次数    480 non-null int64
浏览公告次数    480 non-null int64
讨论次数      480 non-null int64
父母问卷      480 non-null object
家长满意度     480 non-null object
缺勤次数      480 non-null object
成绩        480 non-null object
dtypes: int64(4), object(13)
memory usage: 63.9+ KB
df['监管人'].unique()
array(['Father', 'Mum'], dtype=object)
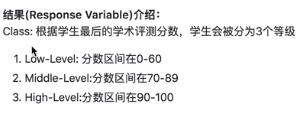
df['成绩'].unique()
array(['M', 'L', 'H'], dtype=object)
# sns.countplot?
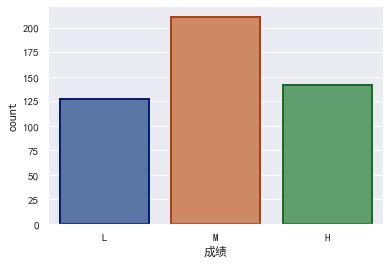
sns.countplot(x = '成绩', order = ['L', 'M', 'H'], data = df, linewidth=2,edgecolor=sns.color_palette("dark",4))
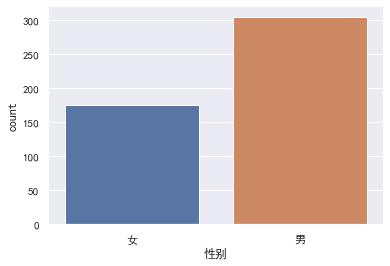
sns.countplot(x = '性别', order = ['女', '男'],data = df)
sns.set_style('whitegrid')
sns.set(rc='figure.figsize':(16,8),font=myfont.get_name(),font_scale=1.5)
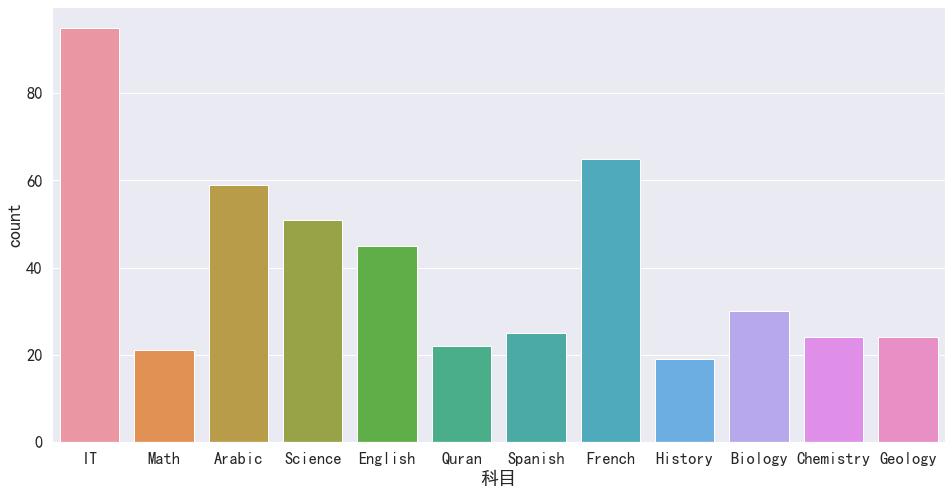
sns.countplot(x = '科目', data = df)
sns.set(rc='figure.figsize':(20,10),font=myfont.get_name(),font_scale=1.5)
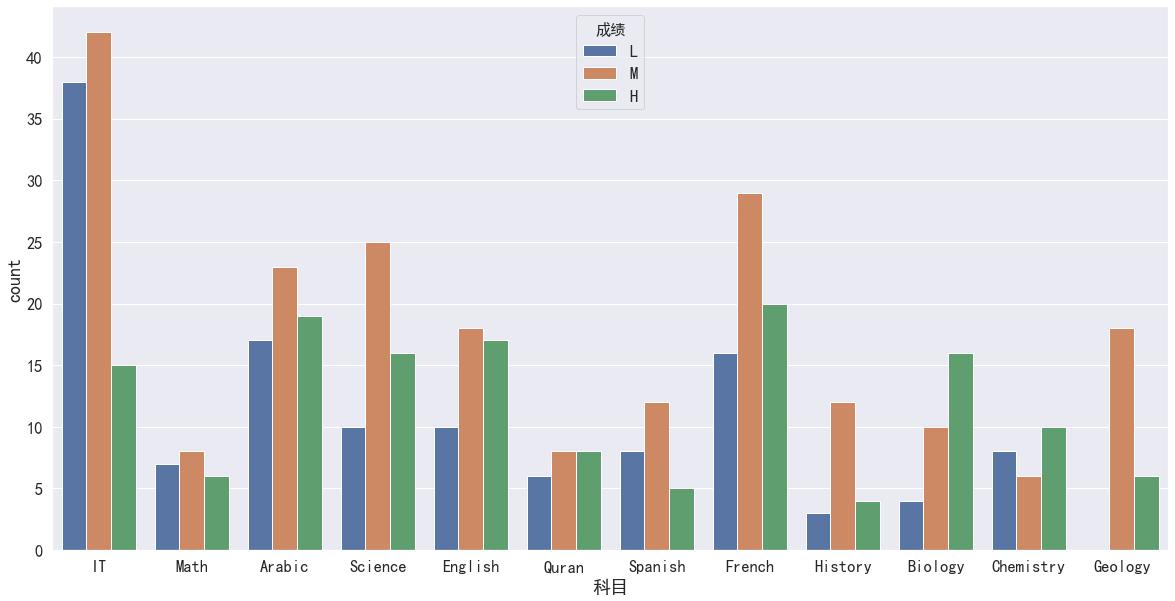
sns.countplot(x = '科目', hue = '成绩', hue_order = ['L', 'M', 'H'], data = df)
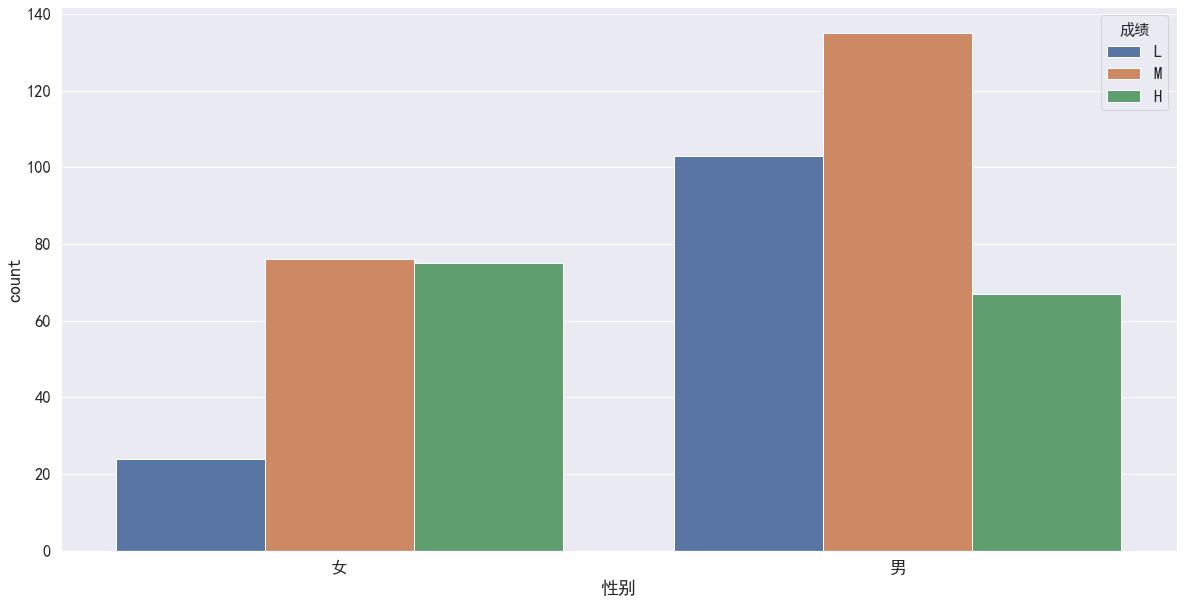
sns.countplot(x = '性别', hue = '成绩',data = df, order = ['女', '男'], hue_order = ['L', 'M', 'H'])
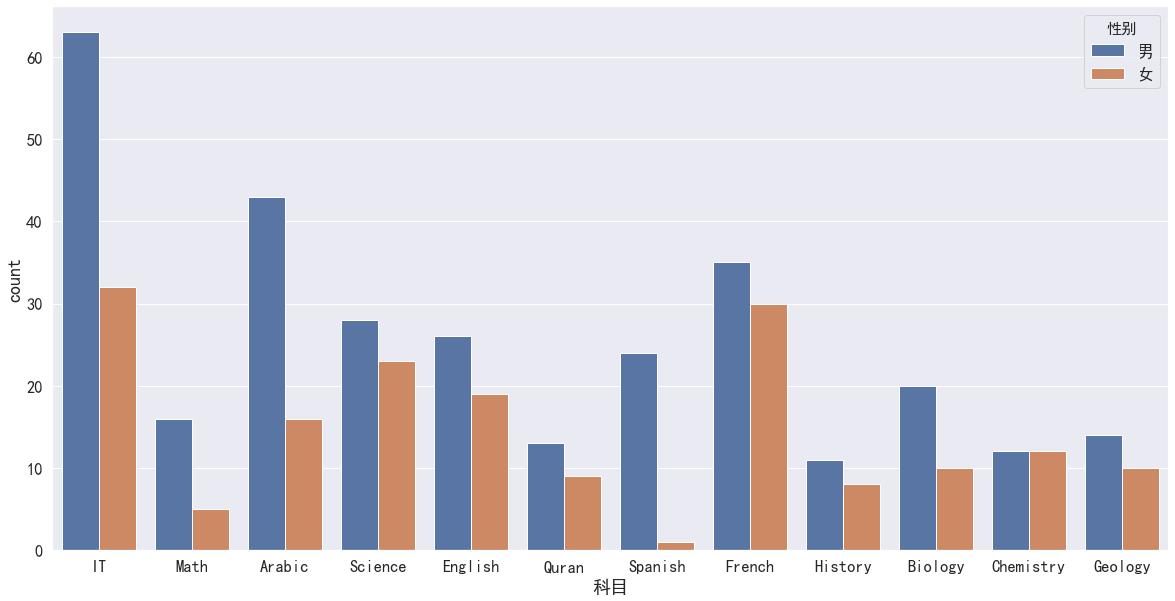
sns.countplot(x = '科目', hue = '性别', data = df)
df_temp = df[['科目', '性别']]
df_temp['count'] = 1
df_temp = df_temp.groupby(['科目', '性别']).agg('sum').reset_index()
df_temp.head(4)
| 科目 | 性别 | count | |
|---|---|---|---|
| 0 | Arabic | 女 | 16 |
| 1 | Arabic | 男 | 43 |
| 2 | Biology | 女 | 10 |
| 3 | Biology | 男 | 20 |
df_temp1 = df_temp
df_temp1 = df_temp1.groupby('科目').agg('sum').reset_index()
df_temp1.head(4)
| 科目 | count | |
|---|---|---|
| 0 | Arabic | 59 |
| 1 | Biology | 30 |
| 2 | Chemistry | 24 |
| 3 | English | 45 |
df_temp.head()
| 科目 | 性别 | count | |
|---|---|---|---|
| 0 | Arabic | 女 | 16 |
| 1 | Arabic | 男 | 43 |
| 2 | Biology | 女 | 10 |
| 3 | Biology | 男 | 20 |
| 4 | Chemistry | 女 | 12 |
df_temp = pd.merge(df_temp, df_temp1, on=('科目'))
df_temp.head(5)
| 科目 | 性别 | count_x | count_y | |
|---|---|---|---|---|
| 0 | Arabic | 女 | 16 | 59 |
| 1 | Arabic | 男 | 43 | 59 |
| 2 | Biology | 女 | 10 | 30 |
| 3 | Biology | 男 | 20 | 30 |
| 4 | Chemistry | 女 | 12 | 24 |
df_temp['gender proportion in topic'] = df_temp['count_x']/df_temp['count_y']
df_temp.head(5)
| 科目 | 性别 | count_x | count_y | gender proportion in topic | |
|---|---|---|---|---|---|
| 0 | Arabic | 女 | 16 | 59 | 0.271186 |
| 1 | Arabic | 男 | 43 | 59 | 0.728814 |
| 2 | Biology | 女 | 10 | 30 | 0.333333 |
| 3 | Biology | 男 | 20 | 30 | 0.666667 |
| 4 | Chemistry | 女 | 12 | 24 | 0.500000 |
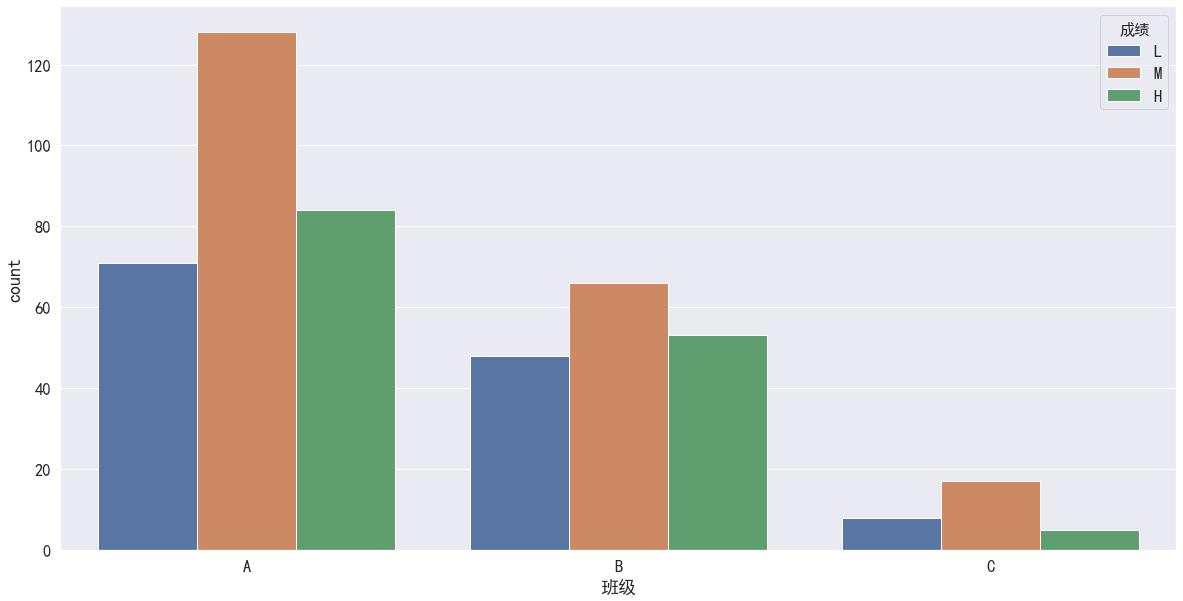
sns.countplot(x = '班级', hue='成绩', data=df, hue_order = ['L','M','H'])
# 从这里可以看出虽然每个班人数较少,但是没有那个班优秀的人数的比例比较突出,这个特征可以删除
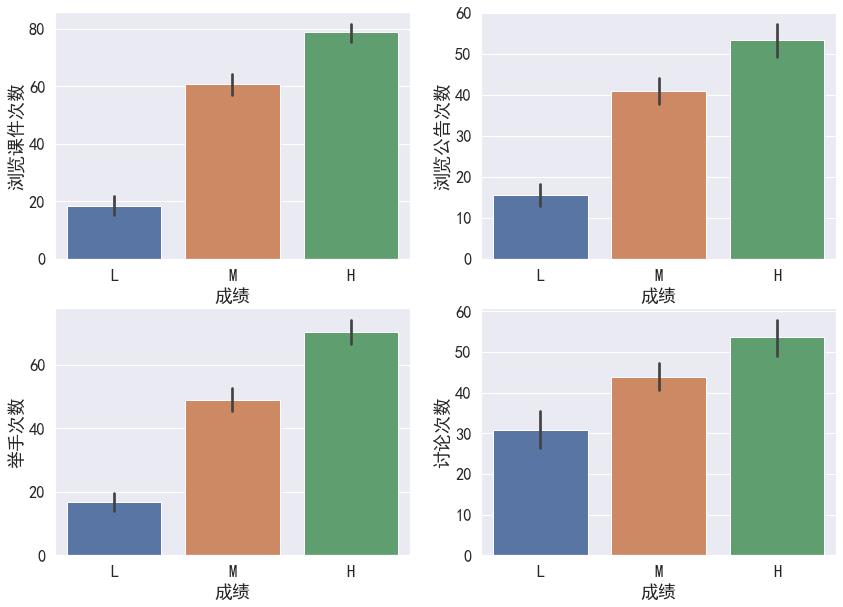
# 了解四个课堂和课后表现与成绩的相关性
fig, axes = plt.subplots(2,2,figsize=(14,10))
sns.barplot(x='成绩', y='浏览课件次数',data=df,order=['L','M','H'],ax=axes[0,0])
sns.barplot(x='成绩', y='浏览公告次数',data=df,order=['L','M','H'],ax=axes[0,1])
sns.barplot(x='成绩', y='举手次数',data=df,order=['L','M','H'],ax=axes[1,0])
sns.barplot(x='成绩', y='讨论次数',data=df,order=['L','M','H'],ax=axes[1,1])
# 在sns.barplot中,默认的计算方式为计算平均值
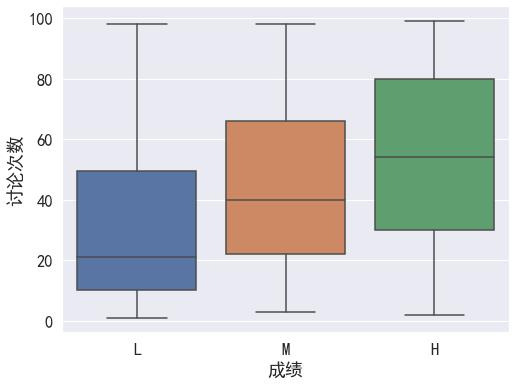
# 了解不同性别的情况下,举手次数和成绩的相关性
# sns.swarmplot(x='Class',y='举手次数',hue='gender',data=df,palette='coolwarm',order=['L','M','H'])
# 了解举手次数与成绩之间的相关性
sns.set(rc='figure.figsize':(8,6),font=myfont.get_name(),font_scale=1.5)
sns.boxplot(x='成绩',y='讨论次数',data=df,order=['L','M','H'])
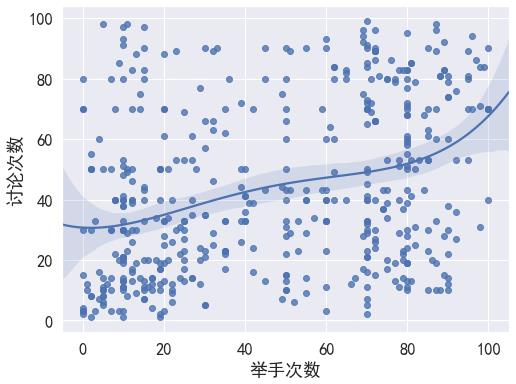
# 了解四个课堂后量化表现之间的相关性
# fig,axes = plt.subplots(2,1,figsize=(10,10))
sns.regplot(x='举手次数',y='讨论次数',order =4,data=df)
# sns.regplot(x='浏览公告次数',y='浏览课件次数',order=4,data=df,ax=axes[1])   ,ax=axes[0]
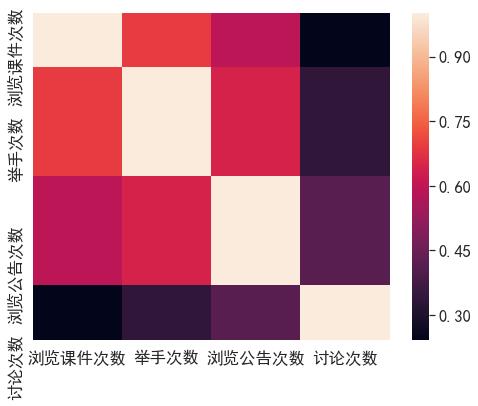
# Correlation Matrix 相关性矩阵
corr = df[['浏览课件次数','举手次数','浏览公告次数','讨论次数']].corr()
corr
| 浏览课件次数 | 举手次数 | 浏览公告次数 | 讨论次数 | |
|---|---|---|---|---|
| 浏览课件次数 | 1.000000 | 0.691572 | 0.594500 | 0.243292 |
| 举手次数 | 0.691572 | 1.000000 | 0.643918 | 0.339386 |
| 浏览公告次数 | 0.594500 | 0.643918 | 1.000000 | 0.417290 |
| 讨论次数 | 0.243292 | 0.339386 | 0.417290 | 1.000000 |
# Correlation Matrix Visualization 相关性可视化
sns.heatmap(corr,xticklabels=corr.columns,yticklabels=corr.columns)
titanic数据分析与可视化
导入模块
import numpy as np
import pandas as pd
import seaborn as sns
import matplotlib.pyplot as plt
sns.set_context("paper",font_scale = 2.0)
# plt.rcParams['font.sans-serif'] = ['SimHei'] #用来正常显示中文标签
# plt.rcParams['axes.unicode_minus']=False #用来正常显示负号
%matplotlib inline
获取数据
titanic=sns.load_dataset('titanic')
titanic.head()
| survived | pclass | sex | age | sibsp | parch | fare | embarked | class | who | adult_male | deck | embark_town | alive | alone | |
|---|---|---|---|---|---|---|---|---|---|---|---|---|---|---|---|
| 0 | 0 | 3 | male | 22.0 | 1 | 0 | 7.2500 | S | Third | man | True | NaN | Southampton | no | False |
| 1 | 1 | 1 | female | 38.0 | 1 | 0 | 71.2833 | C | First | woman | False | C | Cherbourg | yes | False |
| 2 | 1 | 3 | female | 26.0 | 0 | 0 | 7.9250 | S | Third | woman | False | NaN | Southampton | yes | True |
| 3 | 1 | 1 | female | 35.0 | 1 | 0 | 53.1000 | S | First | woman | False | C | Southampton | yes | False |
| 4 | 0 | 3 | male | 35.0 | 0 | 0 | 8.0500 | S | Third | man | True | NaN | Southampton | no | True |
查看有无缺失值
titanic.isnull().sum()
survived         0
pclass           0
sex              0
age            177
sibsp            0
parch            0
fare             0
embarked         2
class            0
who              0
adult_male       0
deck           688
embark_town      2
alive            0
alone            0
dtype: int64
df = titanic
df = titanic
# 删除含有缺失年龄的观察
df.dropna(subset=['age'], inplace=True)
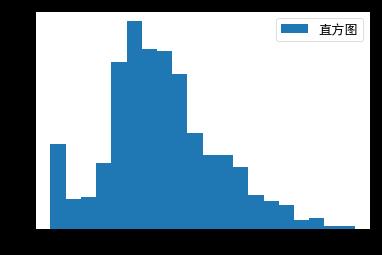
# 绘图:乘客年龄的频数直方图,绘图数据,指定直方图的条形数为20个
plt.hist(df["age"],bins = 20,label = '直方图' )
# 显示图例
plt.legend()
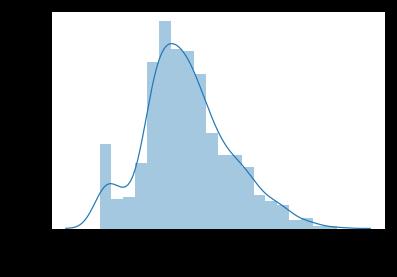
用年龄的均值进行缺失值的填充,再进行年龄分布的可视化;
mean =titanic['age'] .mean()
print(mean)
#用均值进行缺失值的填充
titanic['age'] = titanic['age'].fillna(mean)
titanic.isnull().sum()
29.69911764705882


survived         0
pclass           0
sex              0
age              0
sibsp            0
parch            0
fare             0
embarked         2
class            0
who              0
adult_male       0
deck           530
embark_town      2
alive            0
alone            0
dtype: int64
sns.distplot(titanic["age"])
4) 显示登船地点(S,C,Q)的人数;
titanic['embarked'].value_counts()
S    554
C    130
Q     28
Name: embarked, dtype: int64
5) 对登船地点进行缺失值的填充(填充为S);
titanic['embarked'].isnull().sum()
2
titanic['embarked'] = titanic['embarked'].fillna("S")
titanic['embarked'].isnull().sum()
0
6) 对于deck字段,由于缺失值太多,将其删除;
del titanic['deck']
titanic.head()
| survived | pclass | sex | age | sibsp | parch | fare | embarked | class | who | adult_male | embark_town | alive | alone | |
|---|---|---|---|---|---|---|---|---|---|---|---|---|---|---|
| 0 | 0 | 3 | male | 22.0 | 1 | 0 | 7.2500 | S | Third | man | True | Southampton | no | False |
| 1 | 1 | 1 | female | 38.0 | 1 | 0 | 71.2833 | C | First | woman | False | Cherbourg | yes | False |
| 2 | 1 | 3 | female | 26.0 | 0 | 0 | 7.9250 | S | Third | woman | False | Southampton | yes | True |
| 3 | 1 | 1 | female | 35.0 | 1 | 0 | 53.1000 | S | First | woman | False | Southampton | yes | False |
| 4 | 0 | 3 | male | 35.0 | 0 | 0 | 8.0500 | S | Third | man | True | Southampton | no | True |
# 方法一:直接del DF['column-name']
# 方法二:采用drop方法,有下面三种等价的表达式:
# 1. DF= DF.drop('column_name', 1);
数据探索
1) 可视化乘客的性别分布
sns.countplot(x="sex",data=titanic)

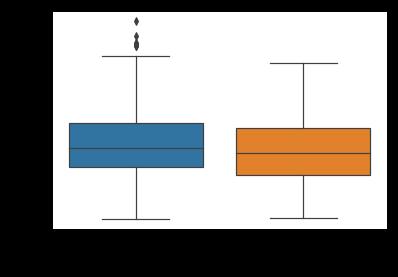
2) 基于性别,绘制乘客年龄分布箱线图
sns.boxplot(x="sex", y="age",data=titanic)
3) 对船舱等级进行计数
sns.countplot(x="class",data=titanic)

4) 结合船舱等级,绘制乘客年龄分布,绘制乘客年龄分布的琴图
sns.violinplot(y='age',x = 'class', data = titanic)

5) 对alone进行计数
sns.countplot(x='alone',data=titanic)

6) 对年龄进行分级,分开小孩和老人的数据
def agelevel(age):
    if age<=16:
        return 'child'
    elif age>=60:
        return 'old'
    else:
        return 'middle'
titanic['age_level']=titanic['age'].map(agelevel)
titanic.head()
| survived | pclass | sex | age | sibsp | parch | fare | embarked | class | who | adult_male | embark_town | alive | alone | age_level | |
|---|---|---|---|---|---|---|---|---|---|---|---|---|---|---|---|
| 0 | 0 | 3 | male | 22.0 | 1 | 0 | 7.2500 | S | Third | man | True | Southampton | no | False | middle |
| 1 | 1 | 1 | female | 38.0 | 1 | 0 | 71.2833 | C | First | woman | False | Cherbourg | yes | False | middle |
| 2 | 1 | 3 | female | 26.0 | 0 | 0 | 7.9250 | S | Third | woman | False | Southampton | yes | True | middle |
| 3 | 1 | 1 | female | 35.0 | 1 | 0 | 53.1000 | S | First | woman | False | Southampton | yes | False | middle |
| 4 | 0 | 3 | male | 35.0 | 0 | 0 | 8.0500 | S | Third | man | True | Southampton | no | True | middle |
对分级后的年龄可视化
sns.countplot(x='age_level',data=titanic)

分析乘客年龄与生还乘客之间的关系
sns.countplot(x以上是关于Python数据分析与可视化Seaborn数据可视化(实训五)的主要内容,如果未能解决你的问题,请参考以下文章
Python数据可视化三部曲之 Seaborn 从上手到上头