Python绘制高斯分布图像
Posted hhh江月
tags:
篇首语:本文由小常识网(cha138.com)小编为大家整理,主要介绍了Python绘制高斯分布图像相关的知识,希望对你有一定的参考价值。
Python绘制高斯分布图像
一、需求介绍
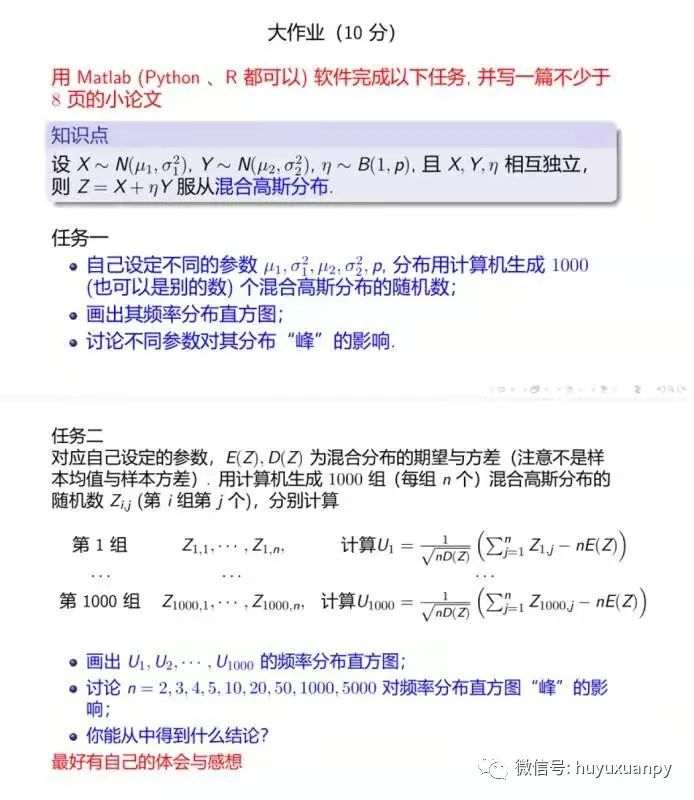
我们这里旨在使用Python来绘制图像,其他的操作一概先不管,绘制高斯分布的图像。

二、第一个任务

代码
import matplotlib.pyplot as plt
import numpy as np
from scipy.stats import beta
from mpl_toolkits.mplot3d import Axes3D
from matplotlib import cm
import math
import random


def x_gauss(mu=0, sigma=1):
    """
    x_gauss(you can change this method to make it can be input.)
    :param mu: mu_x
    :param sigma: sigma_x
    :return: mu, sigma
    """
    return mu, sigma
    # multiple variables.


def y_gauss(mu=0, sigma=1):
    """
    y_gauss(you can change this method to make it can be input.)
    :param mu: mu_y
    :param sigma: sigma_y
    :return: mu, sigma
    """
    return mu, sigma
    # multiple variables.


def z_beta(alpha0=1, p0=1):
    """
    z_beta(you can change this method to make it can be input.)
    :param alpha0: alpha0
    :param p0: p0
    :return: alpha0, p0
    """
    return alpha0, p0
    # p is a multiple variable, but alpha is not.


if __name__ == '__main__':
    mu_x, sigma_x = x_gauss()
    mu_y, sigma_y = y_gauss()
    # get the mu and sigma parameter of the gauss.

    X = np.arange(mu_x - 5 * sigma_x, mu_x + 5 * sigma_x, 10 * sigma_x / 100)
    # range is related with sigma_x.
    Y = np.arange(mu_y - 5 * sigma_y, mu_y + 5 * sigma_y, 10 * sigma_y / 100)
    # range is related with sigma_y.
    # X and Y are arrays, ranging from mu - 5 * sigma to mu + 5 * sigma.

    X, Y = np.meshgrid(X, Y)
    # make meshgrided.

    alpha, p = z_beta()
    eta = beta.pdf(Y, alpha, p)  # Beta.
    # the equation of the eta.(eta ~ B(1, p))
    # however, as i need a range, so i use the range of Y.

    Z = \\
        (1 / (pow(2 * math.pi, 1 / 2))) \\
        * np.exp(- ((X - mu_x) ** 2) / (2 * (sigma_x ** 2))) \\
        + eta * \\
        (1 / (pow(2 * math.pi, 1 / 2))) \\
        * np.exp(- ((Y - mu_y) ** 2) / (2 * (sigma_y ** 2)))
    # Z = X + eta * Y.

    list_z = []
    # hist list.
    for line in Z:  # 100 lines.
        appending = random.choices(line, k=10)
        # 100 lines, 10 choices => 100 * 10 = 1000.

        for data in appending:
            list_z.append(data)

    """
    two pictures => two windows.
    one is hist,
    the other is 3D.
    """

    # print(list_z, len(list_z))
    # 1000 points.
    plt.title('N~Z')
    # title.
    plt.xlabel('Z=X+η*Y')
    plt.ylabel('N')
    # labels.
    plt.hist(list_z)
    # draw the hist.

    fig = plt.figure()
    ax = Axes3D(fig)
    ax.plot_surface(X, Y, Z, rstride=1, cstride=1, alpha=0.5, cmap=cm.coolwarm)
    # draw the 3D function.
    plt.show()
    # show.
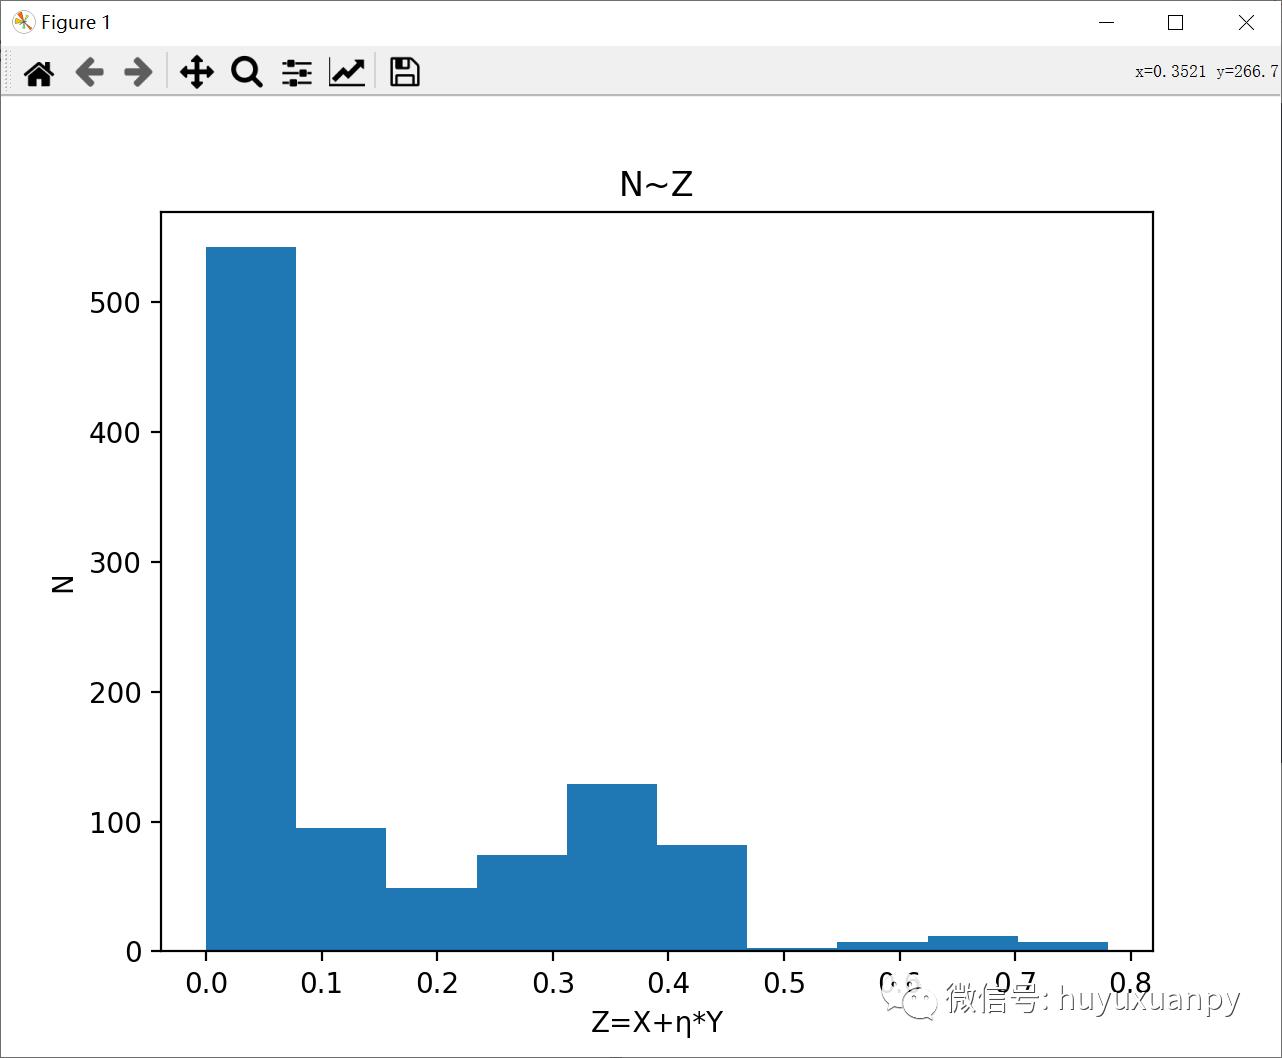
效果:

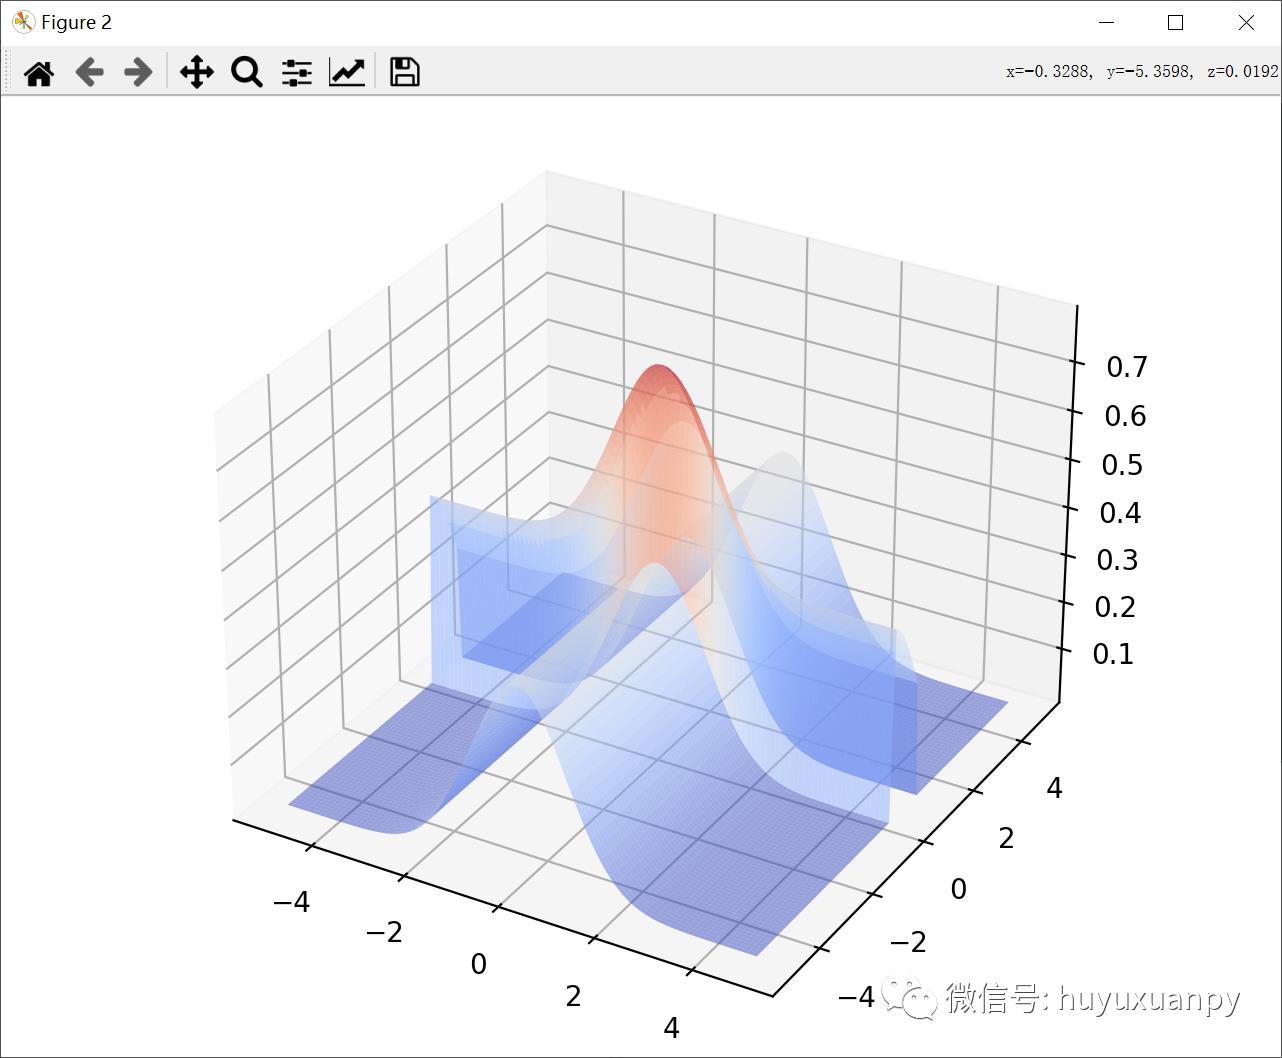
以及:

三、第二个任务
代码
import matplotlib.pyplot as plt
import numpy as np
from scipy.stats import beta
import math
import random


def x_gauss(mu=0, sigma=1):
    """
    x_gauss(you can change this method to make it can be input.)
    :param mu: mu_x
    :param sigma: sigma_x
    :return: mu, sigma
    """
    return mu, sigma
    # multiple variables.


def y_gauss(mu=0, sigma=1):
    """
    y_gauss(you can change this method to make it can be input.)
    :param mu: mu_y
    :param sigma: sigma_y
    :return: mu, sigma
    """
    return mu, sigma
    # multiple variables.


def z_beta(alpha0=1, p0=1):
    """
    z_beta(you can change this method to make it can be input.)
    :param alpha0: alpha0
    :param p0: p0
    :return: alpha0, p0
    """
    return alpha0, p0
    # p is a multiple variable, but alpha is not.


if __name__ == '__main__':
    """
    n is a multiple variable.
    """
    n = 100
    # multiple variable.

    mu_x, sigma_x = x_gauss()
    mu_y, sigma_y = y_gauss()
    # get the mu and sigma parameter of the gauss.

    X = np.arange(mu_x - 5 * sigma_x, mu_x + 5 * sigma_x, 10 * sigma_x / 5000)
    # range is related with sigma_x.
    Y = np.arange(mu_y - 5 * sigma_y, mu_y + 5 * sigma_y, 10 * sigma_y / 5000)
    # range is related with sigma_y.
    # X and Y are arrays, ranging from mu - 5 * sigma to mu + 5 * sigma.

    X, Y = np.meshgrid(X, Y)
    # make meshgrided.

    alpha, p = z_beta()
    eta = beta.pdf(Y, alpha, p)  # Beta.
    # the equation of the eta.(eta ~ B(1, p))
    # however, as i need a range, so i use the range of Y.

    Z = \\
        (1 / (pow(2 * math.pi, 1 / 2))) \\
        * np.exp(- ((X - mu_x) ** 2) / (2 * (sigma_x ** 2))) \\
        + eta * \\
        (1 / (pow(2 * math.pi, 1 / 2))) \\
        * np.exp(- ((Y - mu_y) ** 2) / (2 * (sigma_y ** 2)))
    # Z = X + eta * Y.

    u = []
    # calculate the u.(1000)
    for i in range(1000):  # 1000.
        z_i = random.choices(Z[i], k=n)  # k = n.
        # n z.

        # calculate the u.

        u.append((1 / pow(n * np.var(z_i), 1 / 2)) * (sum(z_i) - n * np.mean(z_i)))
        # Ui = (1 / pow(n * np.var(z_i), 1 / 2)) * (sum(z_i) - n * np.mean(z_i))
        # 1000 u.

    plt.title('N~Ui')
    # title.
    plt.xlabel('Ui')
    plt.ylabel('N')
    # labels.
    plt.hist(u)
    # show the u.
    plt.show()
    # show
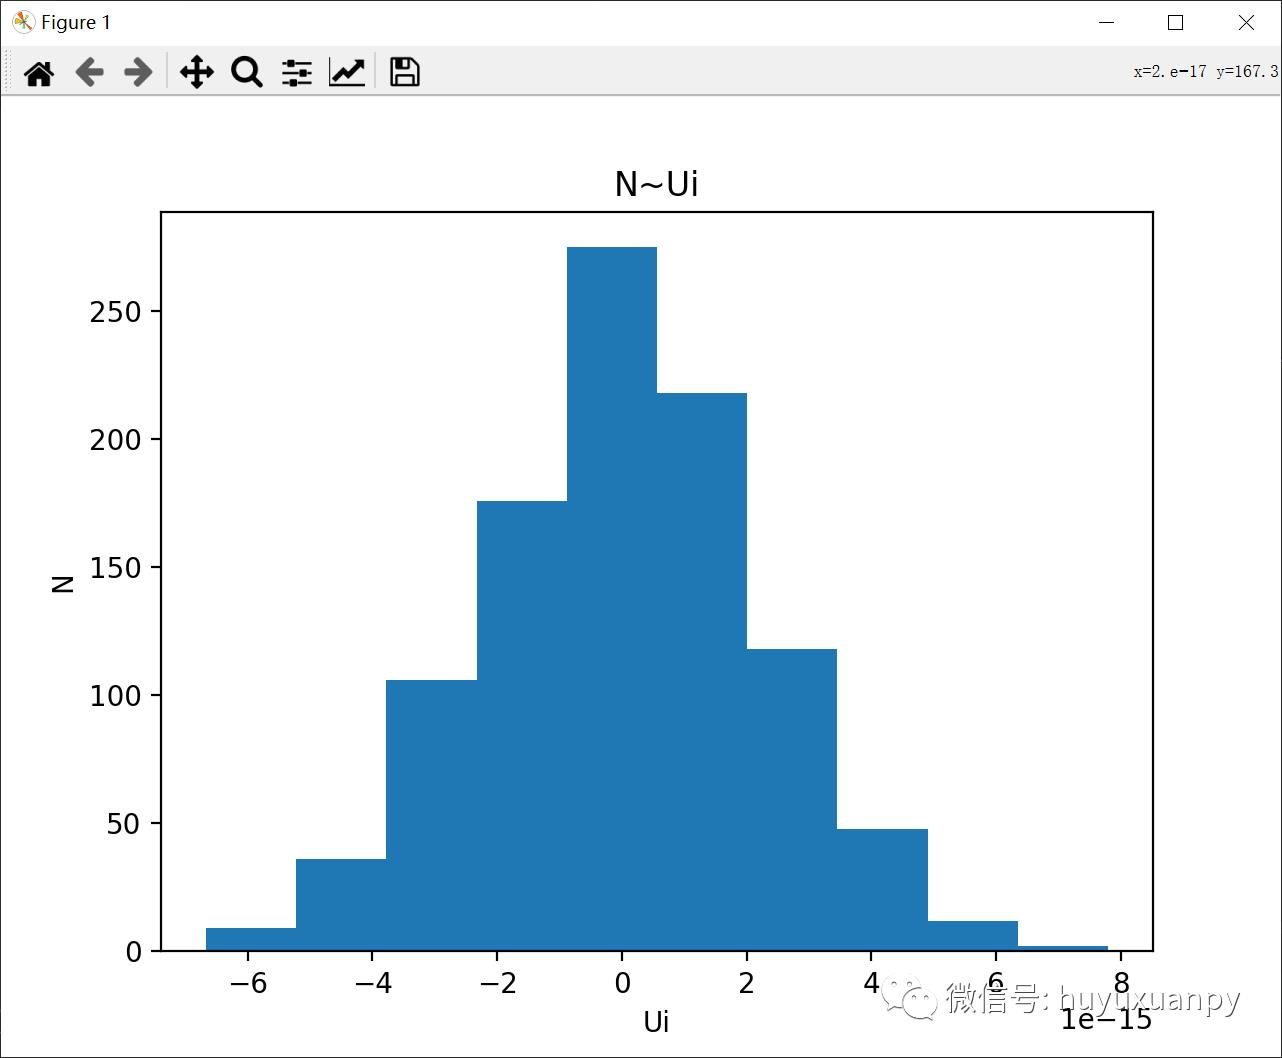
效果:

四、readme文件
This is the homework, there are two packages,
homework1 and homework2, homework1 is related
to work 1, and homework2 is related to work 2.

There may be some modules that you do not have
in your environment, so maybe you should install
those modules first, such as, numpy, scipy,
matplotlib, mpl_toolkits and so on.

After adding all the modules, you can change the
parameters like mu, sigma, p and so on, well,
you can also keep the parameters as you want,
and then,you can run the project and get the
results.

In fact, homework2 is related to homework1,
but, in order to make the question more clear,
i divide the whole question into two small
questions, all in all, they are the same.
以上就是使用Python绘制高斯分布图像的一个案例啦,希望对大家有一些帮助啦,最后感谢大家的阅读与支持了啦。
以上是关于Python绘制高斯分布图像的主要内容,如果未能解决你的问题,请参考以下文章