数学建模竞赛中的两个技巧
Posted 白水baishui
tags:
篇首语:本文由小常识网(cha138.com)小编为大家整理,主要介绍了数学建模竞赛中的两个技巧相关的知识,希望对你有一定的参考价值。
文章目录
1. 数据拟合与最优化方法
1.1. 数据拟合
数据拟合是为了连续化离散的数据,以方便微积分工具在数据上的使用。
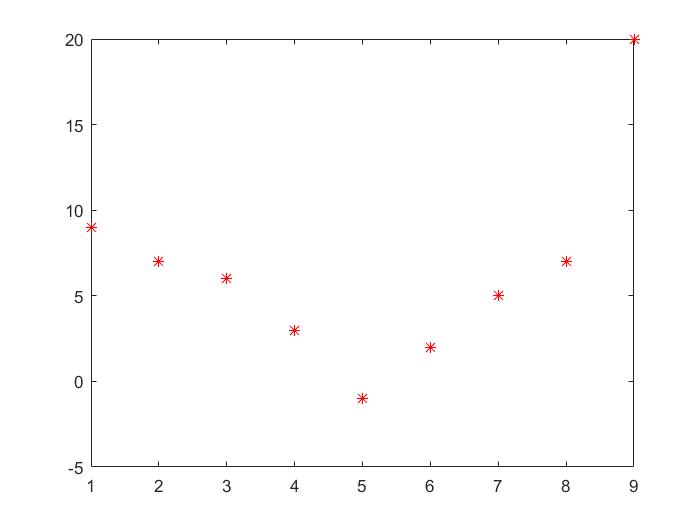
例如有数据x代表温度,y代表产量:
x1 = [1 2 3 4 5 6 7 8 9];
y = [9 7 6 3 -1 2 5 7 20];
如图:

怎么去计算温度
x
=
5.5
x=5.5
x=5.5时,产量
y
y
y的大小呢?这就需要用到数据拟合了,通过拟合来将离散的数据点串成连续的函数,就可以计算出函数上任意一点的值。当然拟合的作用不止于此。
下面我们用一组二维数据和一组三维数据来展示MatLab中多种回归拟合模型的使用。
二维数据
x1 = [1 2 3 4 5 6 7 8 9];
y = [9 7 6 3 -1 2 5 7 20];
三维数据
x1 = [1 2 3 4 5 6 7 8 9];
x2 = [5 4 3 2 0 9 10 15 19];
y = [9 7 6 3 -1 2 5 7 20];

1.1.1. 线性回归 fitlm
https://ww2.mathworks.cn/help/stats/fitlm.html?lang=en
film的输入:
- X,即自变量矩阵;
- Y,即因变量值。
film的输出:
- 回归表达式(Linear regression model),即线性回归表达式;
- 常数项(Intercept),即回归表达式中常数项的值;
- 系数估计值(Estimate),即回归表达式中的系数值;
- 标准误差(Standard Error, SE),即系数的标准误差;
- t统计量(tStat),即每个系数的 t 统计量,tStat = Estimate/SE;
- t 统计量的 p 值(pValue),即假设检验的 t 统计量的 p 值;
- 其余参数查看matlab官网 https://ww2.mathworks.cn/help/stats/fitlm.html?lang=en。
% 拟合x1与y
x1 = [1 2 3 4 5 6 7 8 9];
y = [9 7 6 3 -1 2 5 7 20];

mdl = fitlm(x1,y);
disp(mdl);
输出:
Linear regression model:
    y ~ 1 + x1

Estimated Coefficients:
                   Estimate      SE        tStat     pValue
                   ________    _______    _______    _______

    (Intercept)     3.0278      4.3607    0.69434    0.50985
    x1             0.68333     0.77491    0.88182    0.40713
表达式为: y = 3.0278 + 0.6833 x 1 y=3.0278+0.6833x_1 y=3.0278+0.6833x1
% 拟合x1、x2与y
x1 = [1 2 3 4 5 6 7 8 9];
x2 = [5 4 3 2 0 9 10 15 19];
y = [9 7 6 3 -1 2 5 7 20];

mdl = fitlm([x1', x2'],y); % x1'是x1向量转置的意思
disp(mdl);
输出:
Linear regression model:
    y ~ 1 + x1 + x2

Estimated Coefficients:
                   Estimate      SE        tStat      pValue
                   ________    _______    _______    ________

    (Intercept)     5.0714      2.7551     1.8407     0.11526
    x1             -1.4922      0.7824    -1.9072     0.10512
    x2              1.1866     0.33762     3.5147    0.012599


Number of observations: 9, Error degrees of freedom: 6
Root Mean Squared Error: 3.71
R-squared: 0.706,  Adjusted R-Squared 0.608
F-statistic vs. constant model: 7.2, p-value = 0.0255
表达式为:
y
=
5.0714
−
1.4922
x
1
+
1.1866
x
2
y=5.0714-1.4922x_1+1.1866x_2
y=5.0714−1.4922x1+1.1866x2

1.1.2. 多项式线性回归 regress
https://ww2.mathworks.cn/help/stats/regress.html?lang=en
regress的输入:
- Y,即因变量值;
- X_matrix,即自变量表达式矩阵,可自定义。
regress的输出:
- 系数估计值(b),即多元线性回归的系数估计值;
- 95% 置信区间(bint),即系数估计值的 95% 置信区间的矩阵;
- 其余参数查看matlab官网 https://ww2.mathworks.cn/help/stats/regress.html?lang=en。
```python
% 拟合x1与y
x1 = [1 2 3 4 5 6 7 8 9];
y = [9 7 6 3 -1 2 5 7 20];

X = [ones(size(x1')), x1'];
[b, bint] = regress(y', X);
disp(b);
输出:
b=
    3.0278
    0.6833
表达式为: y = 3.0278 + 0.6833 x 1 y=3.0278+0.6833x_1 y=3.0278+0.6833x1
% 拟合x1、x2与y
x1 = [1 2 3 4 5 6 7 8 9];
x2 = [5 4 3 2 0 9 10 15 19];
y = [9 7 6 3 -1 2 5 7 20];

X = [ones(size(x1')), x1'.^3, x2']; % 注意这里给自变量x1加上了3次方
[b, bint] = regress(y', X);
disp(b);
输出:
b=
    0.9233
   -0.0089
    1.0100
表达式为:
y
=
0.9233
−
0.0089
x
1
3
+
1.0100
x
2
y=0.9233-0.0089x_1^3+1.0100x_2
y=0.9233−0.0089x13+1.0100x2

1.1.3. 多项式非线性回归 polyfit
https://ww2.mathworks.cn/help/matlab/ref/polyfit.html?lang=en
polyfit的输入:
- X,即自变量值;
- Y,即因变量值;
- n,即多项式次数;
polyfit的输出:
- 系数估计值§,即次数为 n 的多项式 p(x) 的系数;
- 误差估计值(s),s是一个结构体,记录了误差估计值信息;
- 矩 μ \\mu μ,分别记录了一阶矩 μ ( 1 ) \\mu(1) μ(1)和二阶矩 μ ( 2 ) \\mu(2) μ(2);
- 其余参数查看matlab官网 https://ww2.mathworks.cn/help/matlab/ref/polyfit.html?lang=en。
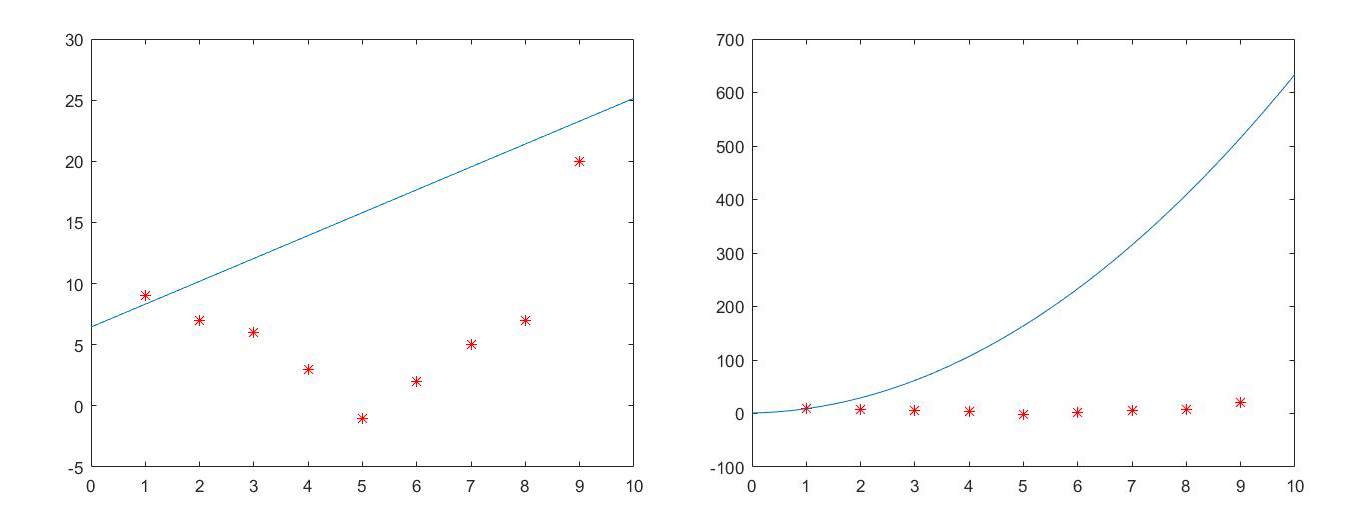
% 拟合x1与y
x1 = [1 2 3 4 5 6 7 8 9];
y = [9 7 6 3 -1 2 5 7 20];

[p, S, mu] = polyfit(x1, y, 1);
disp(p);
输出:
p=
1.8714    6.4444
表达式为: y = 1.8714 ∗ x 1 + 6.4444 ∗ x 0 y=1.8714*x^1+6.4444*x^0 y=1.8714∗x1+6.4444∗x0
% 拟合x1与y
x1 = [1 2 3 4 5 6 7 8 9];
y = [9 7 6 3 -1 2 5 7 20];

[p, S, mu] = polyfit(x2, y, 2); % 这里变成了2
disp(p);
输出:
p=
6.1445    1.8714    0.9827
表达式为:
y
=
6.1445
∗
x
1
2
+
1.8714
∗
x
1
1
+
0.9827
∗
x
1
0
y=6.1445*x_1^2+1.8714*x_1^1+0.9827*x_1^0
y=6.1445∗x12+1.8714∗x11+0.9827∗x10

1.1.4. 自定义非线性回归 fit
https://ww2.mathworks.cn/help/curvefit/fit.html
fit的输入:
- X,即自变量值;
- Y,即因变量值;
- fitType,即拟合函数;
fit的输出:
- 拟合模型(fitobject)
- 其余参数查看matlab官网 https://ww2.mathworks.cn/help/curvefit/fit.html。
% 拟合x1与y
x1 = [1 2 3 4 5 6 7 8 9];
y = [9 7 6 3 -1 2 5 7 20];

fitobject = fit(x1', y', 'poly2'); % ploy2表示x1的最高项次数为2
disp(fitobject);
输出:
Linear model Poly2:
     fitobject(x) = p1*x^2 + p2*x + p3
     Coefficients (with 95% confidence bounds):
       p1 =      0.8193  (0.4354, 1.203)
       p2 =      -7.509  (-11.45, -3.573)
       p3 =       18.05  (9.476, 26.62)
表达式为: y = 0.8193 ∗ x 1 2 − 7.509 ∗ x 1 1 + 18.05 y=0.8193*x_1^2-7.509*x_1^1+18.05 y=0.8193∗x12−7.509∗x11+18.05
% 拟合x1、x2与y
x1 = [1 2 3 4 5 6 7 8 9];
x2 = [5 4 3 2 0 9 10 15 19];
y = [9 7 6 3 -1 2 5 7 20];

fitobject = fit([x1', x2'], y', 'poly23'); % ploy23表示x1的最高项次数为2,x2的最高项次数为3
disp(fitobject);
输出:
     Linear model Poly23:
     fitobject(x,y) = p00 + p10*x + p01*y + p20*x^2 + p11*x*y + p02*y^2 + p21*x^2*y
                    + p12*x*y^2 + p03*y^3
     Coefficients:
       p00 =      -286.4
       p10 =       121.3
       p01 =       62.76
       p20 =      -12.85
       p11 =      -21.57
       p02 =     -0.4537
       p21 =       1.523
       p12 =      0.7509
       p03 =     -0.2724
表达式为: y = − 286.4 + 121.3 ∗ x 1 + 62.76 ∗ x 2 + − 12.85 ∗ x 2 + − 21.57 ∗ x 1 ∗ x 2 + − 0.4537 ∗ x 2 2 + 1.523 ∗ x 1 ∗ x 2 + 0.7509 ∗ x 1 ∗ x 2 2 + − 0.2724 ∗ x 2 3 y=-286.4 + 121.3*x_1 + 62.76*x_2 + -12.85*x^2 + -21.57*x_1*x_2 + -0.4537*x_2^2 + 1.523*x_1*x_2 + 0.7509*x_1*x_2^2 + -0.2724*x_2^3 y=−286.4+121.3∗x1+62.76∗x2+−12.85∗x2+−21.57∗x1∗x2+−0.4537∗x