数据可视化 之seaborn 热力图参数详解(很多例子)
Posted sereasuesue
tags:
篇首语:本文由小常识网(cha138.com)小编为大家整理,主要介绍了数据可视化 之seaborn 热力图参数详解(很多例子)相关的知识,希望对你有一定的参考价值。
def heatmap(data, vmin=None, vmax=None, cmap=None, center=None, robust=False,
            annot=None, fmt=".2g", annot_kws=None,
            linewidths=0, linecolor="white",
            cbar=True, cbar_kws=None, cbar_ax=None,
            square=False, xticklabels="auto", yticklabels="auto",
            mask=None, ax=None, **kwargs):
Parameters 含义
data : rectangular dataset
2D dataset that can be coerced into an ndarray. If a Pandas DataFrame
is provided, the index/column information will be used to label the
columns and rows.
vmin, vmax : floats, optional
Values to anchor the colormap, otherwise they are inferred from the
data and other keyword arguments.
cmap : matplotlib colormap name or object, or list of colors, optional
The mapping from data values to color space. If not provided, the
default will depend on whether ``center`` is set.
center : float, optional
The value at which to center the colormap when plotting divergant data.
Using this parameter will change the default ``cmap`` if none is
specified.
robust : bool, optional
If True and ``vmin`` or ``vmax`` are absent, the colormap range is
computed with robust quantiles instead of the extreme values.
annot : bool or rectangular dataset, optional
If True, write the data value in each cell. If an array-like with the
same shape as ``data``, then use this to annotate the heatmap instead
of the raw data.
fmt : string, optional
String formatting code to use when adding annotations.
annot_kws : dict of key, value mappings, optional
Keyword arguments for ``ax.text`` when ``annot`` is True.
linewidths : float, optional
Width of the lines that will divide each cell.
linecolor : color, optional
Color of the lines that will divide each cell.
cbar : boolean, optional
Whether to draw a colorbar.
cbar_kws : dict of key, value mappings, optional
Keyword arguments for `fig.colorbar`.
cbar_ax : matplotlib Axes, optional
Axes in which to draw the colorbar, otherwise take space from the
main Axes.
square : boolean, optional
If True, set the Axes aspect to "equal" so each cell will be
square-shaped.
xticklabels, yticklabels : "auto", bool, list-like, or int, optional
If True, plot the column names of the dataframe. If False, don't plot
the column names. If list-like, plot these alternate labels as the
xticklabels. If an integer, use the column names but plot only every
n label. If "auto", try to densely plot non-overlapping labels.
mask : boolean array or DataFrame, optional
If passed, data will not be shown in cells where ``mask`` is True.
Cells with missing values are automatically masked.
ax : matplotlib Axes, optional
Axes in which to draw the plot, otherwise use the currently-active
Axes.
kwargs : other keyword arguments
All other keyword arguments are passed to ``ax.pcolormesh``.
举例
import matplotlib.pyplot as plt
%matplotlib inline
import seaborn as sns
import pandas as pd

sns.set()
import numpy as np; np.random.seed(0)
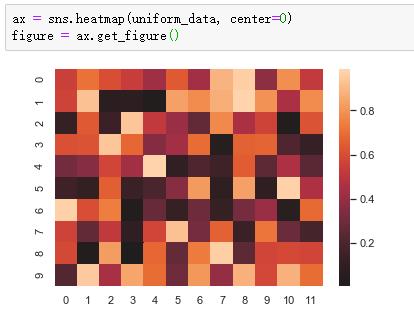
uniform_data = np.random.rand(10, 12)
ax = sns.heatmap(uniform_data)
figure = ax.get_figure()
#Plot a dataframe with meaningful row and column labels:
flights = sns.load_dataset("flights")
flights = flights.pivot("month", "year", "passengers")
ax1 = sns.heatmap(flights)
figure = ax1.get_figure() 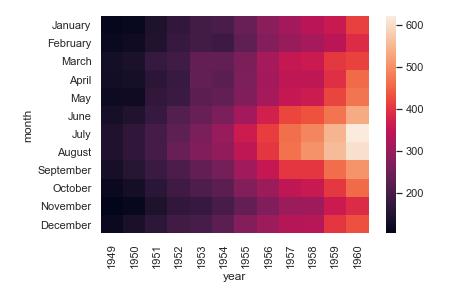
ax1 = sns.heatmap(flights, cmap="YlGnBu")
figure = ax1.get_figure() 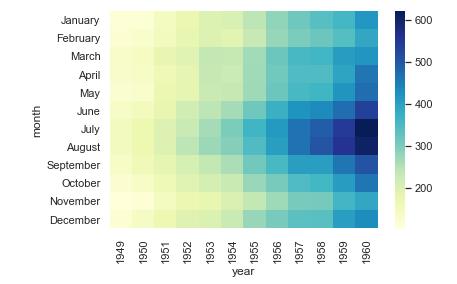
grid_kws = {"height_ratios": (.9, .05), "hspace": .3}
f, (ax, cbar_ax) = plt.subplots(2, gridspec_kw=grid_kws)
ax2 = sns.heatmap(flights, ax=ax,cbar_ax=cbar_ax,cbar_kws={"orientation": "horizontal"})
figure = ax2.get_figure()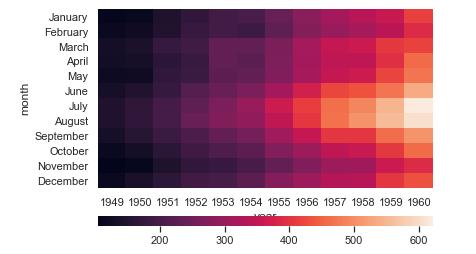
 # Use a mask to plot only part of a matrix
corr = np.corrcoef(np.random.randn(10, 200))
mask = np.zeros_like(corr)
mask[np.triu_indices_from(mask)] = True
with sns.axes_style("white"):
    ax = sns.heatmap(corr, mask=mask, vmax=.3, square=True)
figure = ax.get_figure()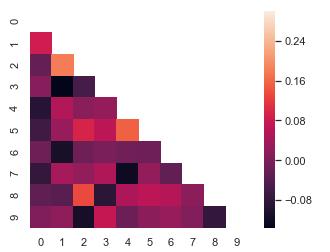
pre = [0.615, 0.611, 0.609, 0.608, 0.605, 0.603, 0.599, 0.598, 0.597, 0.596, 0.595, 0.592, 0.592, 0.592, 0.59,
       0.589, 0.644, 0.645, 0.646, 0.646, 0.647, 0.646, 0.643, 0.734, 0.734, 0.735, 0.736, 0.736, 0.737, 0.738,
       0.739, 0.678, 0.519, 0.491, 0.489, 0.488, 0.488, 0.488, 0.488, 0.489]
data=np.asarray(pre).reshape(1,40)
f, ax = plt.subplots(figsize = (20,0.6))
sns.heatmap(data, annot=True, fmt='.2f',vmin=0, vmax=1, cmap=plt.cm.Blues,ax=ax)
import seaborn as sns
import pandas as pd
import numpy as np

sns.set()
import matplotlib.pyplot as plt

# Generate heatmap of output predictions
correct = [1,1,1,0,1,0,0,0,1,0,0,0,0,0,0,0,1,0,1,1,1,1,1,1,0,1,1,1,1,1,1,1,1,0,1,0,1,1,1,0]
pre = [0.615, 0.611, 0.609, 0.608, 0.605, 0.603, 0.599, 0.598, 0.597, 0.596, 0.595, 0.592, 0.592, 0.592, 0.59,
       0.589, 0.644, 0.645, 0.646, 0.646, 0.647, 0.646, 0.643, 0.734, 0.734, 0.735, 0.736, 0.736, 0.737, 0.738,
       0.739, 0.678, 0.519, 0.491, 0.489, 0.488, 0.488, 0.488, 0.488, 0.489]
data=np.asarray(pre).reshape(1,40)

x_labels = ['(31,1)', '(31,1)', '(31,1)', '(31,0)', '(31,1)', '(31,0)', '(31,0)', '(31,0)', '(31,1)', '(31,0)', '(31,0)', '(31,0)', '(31,0)', '(31,0)', '(31,0)', '(31,0)', '(33,1)', '(33,0)', '(33,1)', '(33,1)', '(33,1)', '(33,1)', '(33,1)', '(34,1)', '(34,0)', '(34,1)', '(34,1)', '(34,1)', '(34,1)', '(34,1)', '(34,1)', '(37,1)', '(39,1)', '(42,0)', '(42,1)', '(42,0)', '(42,1)', '(42,1)', '(42,1)', '(42,0)']
df = pd.DataFrame(data)
df.columns = x_labels
df.index = ['predict']
plt.figure(figsize=(40, 0.5))
ax = sns.heatmap(df, annot=True, fmt='.2f',vmin=0, vmax=1, cmap=plt.cm.Blues)

figure = ax.get_figure()
figure.savefig('out_heatmap.pdf', bbox_inches='tight')  # , bbox_extra_artist=[lgd])

以上是关于数据可视化 之seaborn 热力图参数详解(很多例子)的主要内容,如果未能解决你的问题,请参考以下文章