跟着开源项目学因果推断——mr_uplift(十五)
Posted 悟乙己
tags:
篇首语:本文由小常识网(cha138.com)小编为大家整理,主要介绍了跟着开源项目学因果推断——mr_uplift(十五)相关的知识,希望对你有一定的参考价值。
文章目录

1 mr_uplift 介绍
1.1 介绍
官方地址:https://github.com/Ibotta/mr_uplift
目前有几个升级模型包(参见EconML、GRF、PTE)。他们倾向于用有趣的方法来估计异质处理效果。然而,主要模型中倾向于关注单一response、单一treatment 情景。
mr_uplift开源库,试图为Uplift建模构建一个自动化的解决方案,包括以下特性:
- 允许多种treatments 。可以在每一种干预下,合并元特征,比如用向量来表示treatment
- 允许多responses
- response under proposed treatments (ERUPT)functionality that estimates model performance on OOS data.
它通过估计一个形式为y ~ f(t,x)的神经网络来做到这一点,其中y、x和t是响应、解释变量和treatment变量。
如果optim_loss=True,则使用实验损失函数来估计函数,如果treatment不是随机分配的,则有倾向评分功能得分。
同时可以预测所有treatment的反事实逻辑结果
import numpy as np
import pandas as pd

from mr_uplift.dataset.data_simulation import get_simple_uplift_data
from mr_uplift.mr_uplift import MRUplift

#Generate Data
y, x, t = get_simple_uplift_data(10000)
y = pd.DataFrame(y)
y.columns = ['revenue','cost', 'noise']
y['profit'] = y['revenue'] - y['cost']

#Build / Gridsearch model
uplift_model = MRUplift()
param_grid = dict(num_nodes=[8], dropout=[.1, .5], activation=[
                      'relu'], num_layers=[1, 2], epochs=[25], batch_size=[30])
uplift_model.fit(x, y, t.reshape(-1,1), param_grid = param_grid, n_jobs = 1)

#OOS ERUPT Curves
erupt_curves, dists = uplift_model.get_erupt_curves()

#predict optimal treatments with new observations
_, x_new ,_  = get_simple_uplift_data(5)
uplift_model.predict_optimal_treatments(x_new, objective_weights = np.array([.6,-.4,0,0]).reshape(1,-1))
MRUplift初始化模型,这里响应y有四个维度
1.2 ERUPT 准则
参考:
https://medium.com/building-ibotta/erupt-expected-response-under-proposed-treatments-ff7dd45c84b4
Expected Response Under Proposed Treatments (ERUPT) Metric
建议治疗(ERUPT)指标下的预期反应
在网格搜索之后,我们想知道模型比当前状态好多少。
评估样本外重要性是确保模型在生产中按预期运行的关键。
虽然有其他指标,如QINI指标,它们通常限于单一的治疗情况。
ERUPT是我所知道的唯一一个可以应用于多种治疗的指标,并提供了如果应用该模型将会发生什么情况的无偏估计。
假设您有一个观察,代表是否给予奖金,
𝜋(x)提出不给予奖金的处理,而随机分配的处理给予奖金。
由于这些不一致,我们不清楚我们能说什么。
然而,如果模型的最优处理等于指定的处理,我们可以在我们提出的处理示例中包括该观察结果。
我们对所有的观察进行这个练习,并仅计算𝜋(x) =指定treatment时候,Y的均值。
这是我们在模型下估算的y值!
∑
i
y
i
I
(
π
(
x
i
)
=
t
i
)
∑
i
I
(
π
(
x
i
)
=
t
i
)
\\frac{\\sum_i y_i I(\\pi(x_i) = t_i)} {\\sum_i I(\\pi(x_i)=t_i)}
∑iI(π(xi)=ti)∑iyiI(π(xi)=ti)
注意,这个公式假设处理的分布是均匀的(每个处理的数量相同)和随机分配。
这个包中的功能不需要统一的处理,但是需要随机分配。
详情见 blog post here.
输出的两个表格:
-
1 第一个数据帧显示了模型分配的爆发度量和标准偏差。在这个例子中,如果我们使用这个模型,它会告诉我们期望利润。
此外,我们还可以看到分配列下的“随机”行。它使用了与𝜋(𝑥)相同的分布,但打乱了处理,使其成为一个随机分配。观察模型和随机分配之间的区别应该告诉我们模型是否学习了个体治疗的效果好。
下面我们可以看到,该模型比随机处理的效果好得多,说明该模型很好地了解了治疗效果的异质性。如果我们采用这种模式,我们预计利润为0.16。

-
2 数据帧显示了处理在最优分配下的分布。在这个例子中,我们可以看到大约一半被分配了治疗,另一半没有。tmt 代表 treatment,num_observations代表不同treatment的样本量

2 案例模拟
可以参考官方文档:mr_uplift_multiple_response_example
本笔记本将介绍使用MRUplift框架优化多个响应变量。这里将设定:
- 假设问题和数据生成过程
- 建立uplift模型
- 用样本外out-of-sample ERUPT度量来评估模型
- 预测新的观察结果分配
业务问题
假设我们是数据科学家,为一家初创公司工作,这家公司希望以更有效的方式发展业务。
作为一种增加用户活跃度的策略,该公司为所有用户提供了一种 收费的干预条件,比如大会员,
这里需要找到哪些人愿意接受这样的大会员充值,同时让这些人购买。
不过不是特别确认,
为了降低成本,我们的任务是利用数据找到一个用户子集,这些用户应该继续接受昂贵的治疗,同时继续增长(以收入衡量)。当然这里会出现几种想要达到的响应Y:
- 最大化收入
- 最大化利润
- 最大化收益(利润 - 成本)
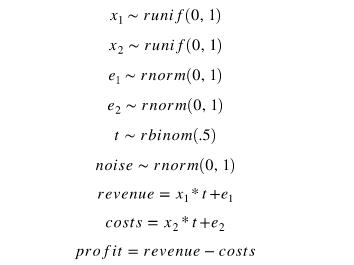
这里模拟数据会生成几类协变量X,随机生成是否接受大会员条件的treatment变量T以及最后的响应Y
生成的逻辑如下:
2.1 生成模拟数据
# 生成数据
y, x, t = get_simple_uplift_data(10000)

y = pd.DataFrame(y)
y.columns = ['revenue','cost', 'noise']
y['profit'] = y['revenue'] - y['cost']
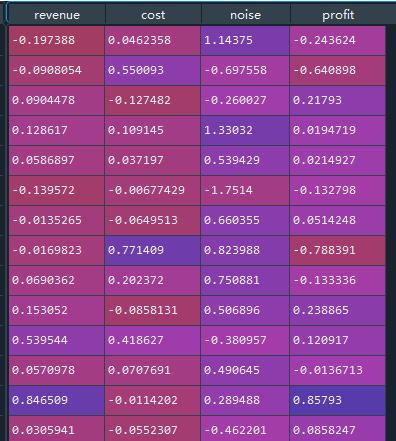
其中Y为多个,有收入,成本,净收益:
新建模型 Model Building / Gridsearch
#Build / Gridsearch model
uplift_model = MRUplift()
param_grid = dict(num_nodes=[8], dropout=[.1, .5], activation=[
                      'relu'], num_layers=[1, 2], epochs=[25], batch_size=[30])
uplift_model.fit(x, y, t.reshape(-1,1), param_grid = param_grid, n_jobs = 1)
param_grid 就是神经网络的一些参数;
t就是干预,这里是[0,1,0,1,xxxxx]这样的单变量干预
2.2 绘制ERUPT Curves曲线
erupt_curves, dists = uplift_model.get_erupt_curves()

#I create a new variable that shows the weight of the revenue variable
dists['weights_1'] = [np.float(x.split(',')[0]) for x in dists['weights']]
erupt_curves['weights_1'] = [np.float(x.split(',')[0]) for x in erupt_curves['weights']]

ggplot(aes(x='weights_1', y='mean', group = 'assignment', colour = 'assignment'), data=erupt_curves) +\\
    geom_line()+\\
    geom_point()+facet_wrap("response_var_names")
get_erupt_curves 会输出两个表格,第一个表格:
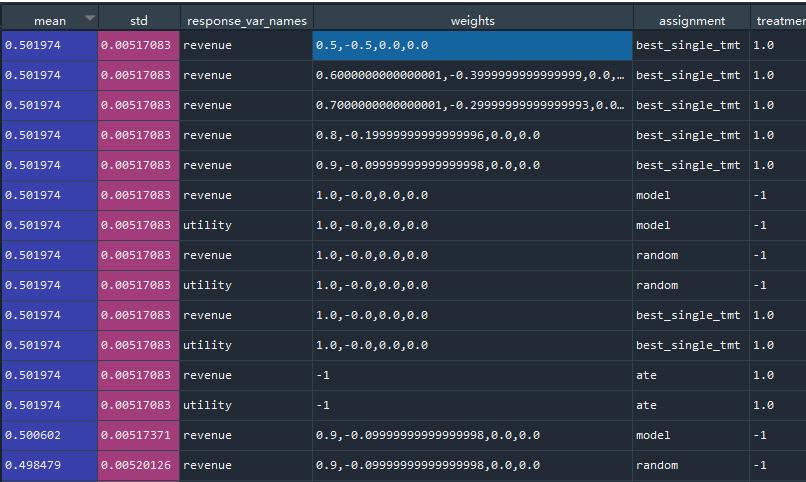
weight权重代表的四要素分别为:[收入,成本,噪声,利润]
第一个是在给定一组模型权重的情况下,所有响应变量的ERUPT 度量和标准偏差。
在这个例子中,权重设置是从成本最小化到收益最大化的目标。
我们看到成本和收入都在上升,但速度不同。当收入权重为0.5,成本权重为0.5时,利润最大化。
最后我们还可以看到噪声响应变量没有受到预期的影响。
简单解读一下图中的第一行,response_var_names指的是在revenue收入上,设置weights[收入,成本]各自为[0.5,0.5]下,收入的平均值为0.501,收入标准差0.0051;
assignment表示:model模型加持下;random随机安排加持下;best_single_tmt状态加持下的收入水平。

再来0/2/3行,在相同weights下,收入这个response,在不同的assignment加持下(best_single_tmt / model / random)的收入水平,分别是0.501 / 0.350 / 0.274;
从这可以看到best_single_tmt效果最佳
第二个表格是:
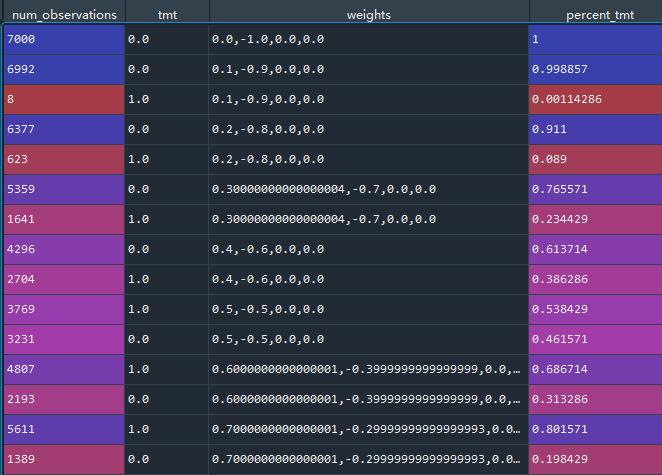
第二个df显示了在一组客观权重的最优分配下处理的分布。
在这个例子中,我们可以看到,当我们将目标函数加权为更大的收益最大化时,分配处理的次数会增加。
tmt代表treatment,第一行代表,在[0,1,0,0]weight状态下,所有的样本都是未治疗的,,7000个样本,占比为1;
在[0.1,0.9,0,0]weight状态下,第二行+第三行是这个状态的,tmt = 1有8个样本,占比0.001;tmt = 0有6992样本

因为这里响应Y有多个,其实可以当作综合评价,计算一个综合指数Y:
y
n
e
w
=
w
e
i
g
h
t
0
∗
y
0
^
+
w
e
i
g
h
t
1
∗
y
1
^
+
.
.
.
+
w
e
i
g
h
t
n
u
m
r
e
s
p
o
n
s
e
s
∗
y
n
u
m
r
e
s
p
o
n
s
e
s
^
y_{new} = weight_0*\\hat{y_0} + weight_1*\\hat{y_1} + ... + weight_{num responses}*\\hat{y_{num responses}}
ynew=weight0∗y0^+weight1∗y1^+...+weightnumresponses∗ynumresponses^
这里的weight可以自由设立,不同的权重象征着不同的项目诉求,可以更看重收入,也可以更看重净收入。
2.3 为新的观测结果分配最佳处理方法
在建立和评估一个uplift模型后,如果需要上线到生产环境,就要为新用户分配最佳处理,可以使用predict_optimal_therapies函数,但现在需要进行权重分配。
我设置了0.6收入和0.4成本
#generate 5 new observation
_, x_new ,_  = get_simple_uplift_data(5)
uplift_model.predict_optimal_treatments(x_new, weights = np.array([.6,-.4,0,0]).reshape(1,-1))
输出结果为:
array([[1],
       [1],
       [1],
       [1],
       [0]])
2.4 协变量X的重要性
来自:mr_uplift_variable_importance_example.ipynb
这里描述的变量重要性度量是排列重要性的一种变化;
对一列进行洗牌并测量输出与原始数据输出的不一致程度。
uplift_model.permutation_varimp(objective_weights = np.array([.6,-.4,0,0]).reshape(1,-1))
导出:
   permutation_varimp_metric
0                   0.347571
1                   0.238286
两个变量的在weight - [.6,-.4,0,0]下的重要性
3 mr_uplift + 倾向得分
主要的变化是为倾向模型构建了一个形式为𝑡=𝑓(𝑥)的随机森林。
他们预测并计算反概率作为观测权值:1/f(x)。
注意,倾向模型是一个多分类模型,支持两种以上的处理方法。
然后,这个weight被输入到ERUPT 计算和uplift模型的loss 损失函数中。
import numpy as np
import pytest

from mr_uplift.dataset.data_simulation import get_observational_uplift_data_2
from mr_uplift.mr_uplift import MRUplift, get_t_data
from mr_uplift.keras_model_functionality import prepare_data_optimized_loss
import sys
import pandas as pd

# 生成数据
y, x, t = get_observational_uplift_data_2(10000)

y = y[:,0].reshape(-1,1)

# 模型一:未加入倾向得分
uplift_model = MRUplift()
param_grid = dict(num_nodes=[8,64], dropout=[.1, .5], activation=[
                          'relu'], num_layers=[1], epochs=[25], batch_size=[512])

uplift_model.fit(x, y, t.reshape(-1,1),
                 param_grid = param_grid, n_jobs = 1)

# 模型二:加入倾向得分
uplift_model_propensity = MRUplift()
param_grid_propensity = dict(num_nodes=[8, 64], dropout=[.1, .5], activation=[
                          'relu'], num_layers=[1], epochs=[25], batch_size=[512],
                 alpha = [.9999,.99], copy_several_times = [1])

uplift_model_propensity.fit(x, y, t.reshape(-1,1),
                 param_grid = param_grid_propensity, n_jobs = 1,
                optimized_loss = True, use_propensity = True)


#calculate oos predictions
# 计算OOS 预测
y_test, x_test, t_test = get_observational_uplift_data_2(10000)

pred_uplift = uplift_model.predict_optimal_treatments(x = x_test)
pred_uplift_propensity = uplift_model_propensity.predict_optimal_treatments(x = x_test,
                use_propensity_score_cutoff = True)
correct_tmt = (x_test[:,0]>0).reshape(-1,1)*1

# 两个模型正确treatment的数量
print('Uplift Model Correct Decisions')
print((pred_uplift == correct_tmt).mean())

print('Uplift Model using Propensity Correct Decisions')
print((pred_uplift_propensity == correct_tmt).mean())
两个模型的差异:
Uplift Model Correct Decisions
0.5754
Uplift Model using Propensity Correct Decisions
0.9886
4 简单看一下:class:MRUplift
关于fit
fit(self, x, y, t, test_size=0.7, random_state=22, param_grid=None,
            n_jobs=-1, cv=5, optimized_loss = False, PCA_x = False, PCA_y = False, bin = False,
            use_propensity = False, propensity_score_cutoff = 100)
param_grid代表模型参数,cv数量,还可以对数据进行降维PCA_x
use_propensity = True的话,会使用RF下的一个倾向得分;
mruplift里面自带了调参工具,GridSearchCV
GridSearchCV(
        estimator=model,
        param_grid=param_grid,
        n_jobs=n_jobs,
        scoring=mse_loss_multi_output_scorer,
        verbose=False,
        cv=cv)
模型利用了KerasRegressor,默认:
    model = KerasRegressor(
        build_fn=hete_mse_loss_multi_output,
        input_shape=x.shape[1],
        output_shape=y.shape[1],
        num_nodes=32,
        num_layers=1,
        epochs=100,
        verbose=False,
        dropout=.2,
        batch_size=1000)
以上是关于跟着开源项目学因果推断——mr_uplift(十五)的主要内容,如果未能解决你的问题,请参考以下文章