Error: Discrete value supplied to continuous scale
Posted Data+Science+Insight
tags:
篇首语:本文由小常识网(cha138.com)小编为大家整理,主要介绍了Error: Discrete value supplied to continuous scale相关的知识,希望对你有一定的参考价值。
Error: Discrete value supplied to continuous scale
目录
Error: Discrete value supplied to continuous scale
#仿真数据
df <- structure(list(`10` = c(0, 0, 0, 0, 0, 0), `33.95` = c(0, 0,
0, 0, 0, 0), `58.66` = c(0, 0, 0, 0, 0, 0), `84.42` = c(0, 0,
0, 0, 0, 0), `110.21` = c(0, 0, 0, 0, 0, 0), `134.16` = c(0,
0, 0, 0, 0, 0), `164.69` = c(0, 0, 0, 0, 0, 0), `199.1` = c(0,
0, 0, 0, 0, 0), `234.35` = c(0, 0, 0, 0, 0, 0), `257.19` = c(0,
0, 0, 0, 0, 0), `361.84` = c(0, 0, 0, 0, 0, 0), `432.74` = c(0,
0, 0, 0, 0, 0), `506.34` = c(1, 0, 0, 0, 0, 0), `581.46` = c(0,
0, 0, 0, 0, 0), `651.71` = c(0, 0, 0, 0, 0, 0), `732.59` = c(0,
0, 0, 0, 0, 1), `817.56` = c(0, 0, 0, 1, 0, 0), `896.24` = c(0,
0, 0, 0, 0, 0), `971.77` = c(0, 1, 1, 1, 0, 1), `1038.91` = c(0,
0, 0, 0, 0, 0), MW = c(3.9, 6.4, 7.4, 8.1, 9, 9.4)), .Names = c("10",
"33.95", "58.66", "84.42", "110.21", "134.16", "164.69", "199.1",
"234.35", "257.19", "361.84", "432.74", "506.34", "581.46", "651.71",
"732.59", "817.56", "896.24", "971.77", "1038.91", "MW"), row.names = c("Merc",
"Peug", "Fera", "Fiat", "Opel", "Volv"
), class = "data.frame")


df
问题:
library(reshape)

## Plotting
meltDF = melt(df, id.vars = 'MW')
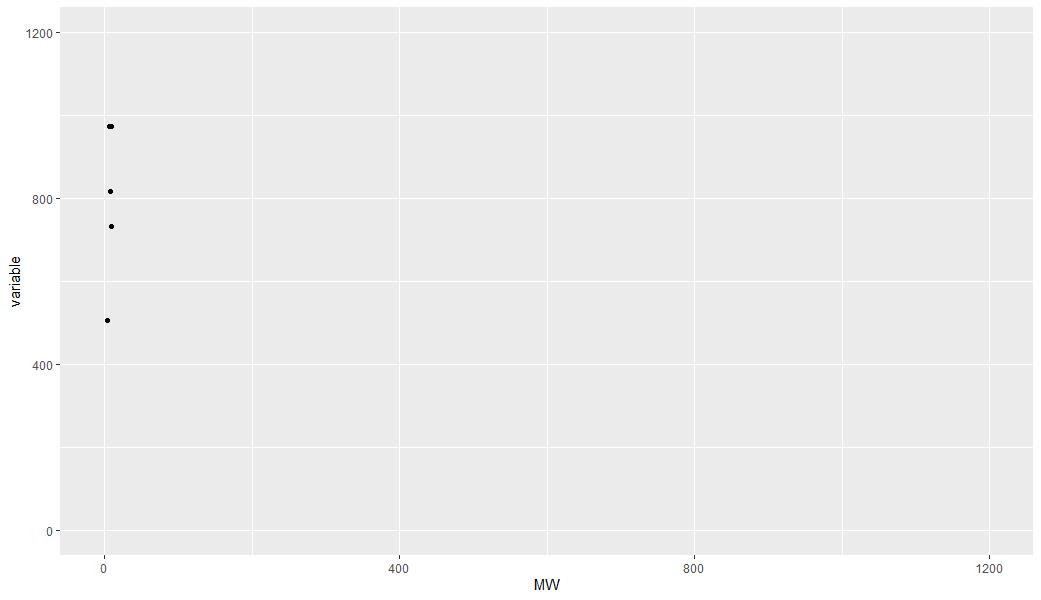
ggplot(meltDF[meltDF$value == 1,]) + geom_point(aes(x = MW, y = variable)) +
  scale_x_continuous(limits=c(0, 1200), breaks=c(0, 400, 800, 1200)) +
  scale_y_continuous(limits=c(0, 1200), breaks=c(0, 400, 800, 1200))
解决:
在定义了meltDF变量之后,可以将因子factor变量变换为为数值numeric白能量;
如果x是数值,那么添加scale_x_continual();如果x是字符/因子,那么添加scale_x_discreate()。
meltDF$variable=as.numeric(levels(meltDF$variable))[meltDF$variable]


ggplot(meltDF[meltDF$value == 1,]) + geom_point(aes(x = MW, y =   variable)) +
     scale_x_continuous(limits=c(0, 1200), breaks=c(0, 400, 800, 1200)) +
     scale_y_continuous(limits=c(0, 1200), breaks=c(0, 400, 800, 1200))
完整错误:
> library(reshape)
>
> ## Plotting
> meltDF = melt(df, id.vars = 'MW')
> ggplot(meltDF[meltDF$value == 1,]) + geom_point(aes(x = MW, y = variable)) +
+ scale_x_continuous(limits=c(0, 1200), breaks=c(0, 400, 800, 1200)) +
+ scale_y_continuous(limits=c(0, 1200), breaks=c(0, 400, 800, 1200))
Error: Discrete value supplied to continuous scale
>
参考:R
参考:Plotting with ggplot2: "Error: Discrete value supplied to continuous scale" on categorical y-axis
以上是关于Error: Discrete value supplied to continuous scale的主要内容,如果未能解决你的问题,请参考以下文章