如何开启一个kaggle项目(流程有哪些?)销量预测项目
Posted 小乖乖的臭坏坏
tags:
篇首语:本文由小常识网(cha138.com)小编为大家整理,主要介绍了如何开启一个kaggle项目(流程有哪些?)销量预测项目相关的知识,希望对你有一定的参考价值。
看了几篇kaggle的solution,总结了一下,完成一个机器学习项目,通常分为以下几步:
1.载入数据&查看数据信息
2.数据预处理1(数据清洗,异常值处理)
3.特征工程(在现有数据中挖掘对任务有用的新特征)
4.数据处理2(将处理过的不同数据表连接、合并…最终划分为训练集和测试集,形成可以用来训练的数据集)
5.模型的选择(试用几个模型来比较效果)
6.模型的比较与融合(挑选好的模型互相融合)
7.模型的训练与保存
8.模型的调用与测试
接下来,以一个例子来分享一下这个项目:
1 项目介绍
项目地址如下:
https://www.kaggle.com/c/competitive-data-science-predict-future-sales/data?select=test.csv
数据集介绍:
在这个网址中,有涉及到任务的数据集,

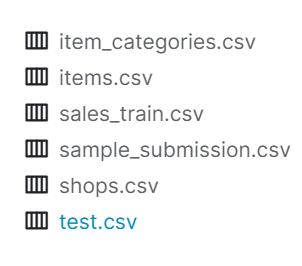
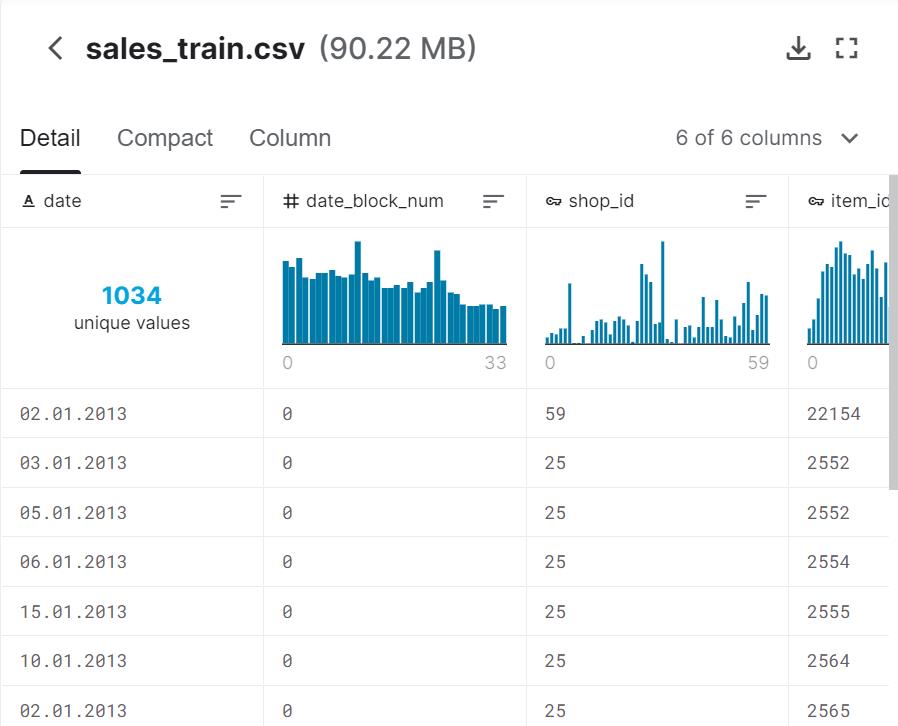
在旁边可以查看数据的构成和基本信息,不必也做不到用excel打开看一看。因为这个数据集非常大,总共100MB大小,所以excel打开必然会崩。

上述文件的描述可以在下图中看到:

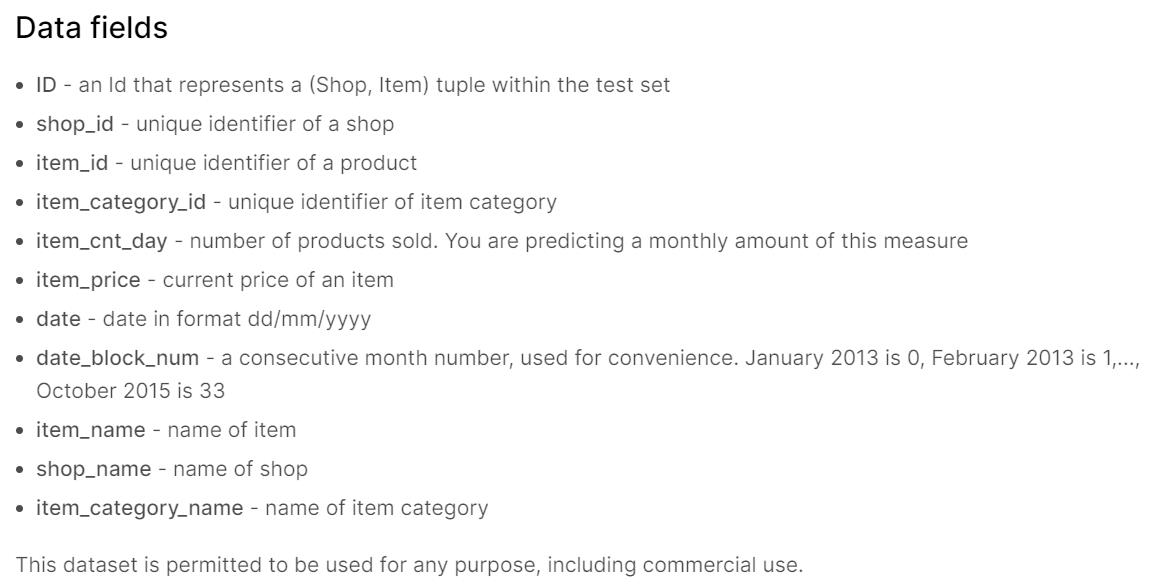
在6个csv文件中的各个数据字段的含义,下图也有表述:

思路:
- 有用的特征是:往期每个月的数据。由于原数据中给的是每一天的数据,因此需要对每一个商店中每一个商品的数据都按月先求和。
- 模型可以用之前所有月来预测最后一个月的数据。
代码解析:
载入数据
df_train = pd.read_csv('./kaggle/input/competitive-data-science-predict-future-sales/sales_train.csv')
df_shops = pd.read_csv('./kaggle/input/competitive-data-science-predict-future-sales/shops.csv')
df_items = pd.read_csv('./kaggle/input/competitive-data-science-predict-future-sales/items.csv')
df_item_categories = pd.read_csv('./kaggle/input/competitive-data-science-predict-future-sales/item_categories.csv')
df_test = pd.read_csv('./kaggle/input/competitive-data-science-predict-future-sales/test.csv')
查看数据基本信息
df_train.head()
df_test.head()
df_train.info()
df_train.describe()
df_train.isnull().sum()
df_test.isna().sum()
数据预处理
#在df_train里剔除date_block_num和item_price
df_train.drop(['date_block_num','item_price'], axis=1, inplace=True)


df_train['date'] = pd.to_datetime(df_train['date'], dayfirst=True)
df_train['date'] = df_train['date'].apply(lambda x: x.strftime('%Y-%m'))
df_train.head()


df = df_train.groupby(['date','shop_id','item_id']).sum()# sql group by
#透视表是一种可以对数据动态排布并且分类汇总的表格格式。或许大多数人都在Excel使用过数据透视表,也体会到它的强大功能,而在pandas中它被称作pivot_table
#index先按照shop_id排序,在shop_id里再按照item_id排序;column是date,也就是日期;
df = df.pivot_table(index=['shop_id','item_id'], columns='date', values='item_cnt_day', fill_value=0)
# 	        0	1	2	3	4
# date
# shop_id	0	0	0	0	0
# item_id	30	31	32	33	35
# 2013-01	0	0	6	3	1
# 2013-02(31) 11	10	3	14
# 2013-03	0	0	0	0	0
# 2013-04	0	0	0	0	0
# 2013-05	0	0	0	0	0
#举例,0号商店的30号商品在2013年2月的第一天迈出了31份

#inplace=True :是指重置索引的结果是否作用在前面的数据上
df.reset_index(inplace=True)
print(df.head().T)

#测试集处理,
df_test = pd.merge(df_test, df, on=['shop_id','item_id'], how='left')#类似concat
df_test.drop(['ID', '2013-01'], axis=1, inplace=True)#将['ID', '2013-01']两lie去除
df_test = df_test.fillna(0)#填充nan
print('Test data:', df_test.head().T)
数据集划分
# split into train and test sets
Y_train = df['2015-10'].values#以最后一维数据作为y
X_train = df.drop(['2015-10'], axis = 1)#除了y以外的其他数据作为特征
X_test = df_test

print(X_train.shape, Y_train.shape)
print(X_test.shape)


#设置训练测试集划分
x_train, x_test, y_train, y_test = train_test_split( X_train, Y_train, test_size=0.20, random_state=1)


print(x_train.shape)
print(x_test.shape)
print(y_train.shape)
print(y_test.shape)
模型选择与参数处理
LR = LinearRegression()
LR.fit(x_train,y_train)

print('Train set mse:', mean_squared_error(y_train, LR.predict(x_train)))
print('Test set mse:', mean_squared_error(y_test, LR.predict(x_test)))
print('Test set score:', LR.score(x_train,y_train))


# %time
RFR = RandomForestRegressor(n_estimators = 100)
RFR.fit(x_train,y_train)

print('Train set mse:', mean_squared_error(y_train, RFR.predict(x_train)))
print('Test set mse:', mean_squared_error(y_test, RFR.predict(x_test)))
print('Test set score:', RFR.score(x_train,y_train))


# %time
XGB = XGBRegressor(max_depth=16,n_estimators=200,seed=1)
XGB.fit(x_train,y_train)

print('Train set mse:', mean_squared_error(y_train, XGB.predict(x_train)))
print('Test set mse:', mean_squared_error(y_test, XGB.predict(x_test)))
print('Test set score:', XGB.score(x_train,y_train))


# %time
LGBM = LGBMRegressor(max_depth=16,n_estimators=200,seed=1)
LGBM.fit(x_train,y_train)

print('Train set mse:', mean_squared_error(y_train, LGBM.predict(x_train)))
print('Test set mse:', mean_squared_error(y_test, LGBM.predict(x_test)))
print('Test set score:', LGBM.score(x_train,y_train))


prediction = XGB.predict(X_test)


prediction = list(map(round, prediction))#四舍五入
提交结果
df_submission['item_cnt_month'] = prediction
df_submission.to_csv('prediction.csv', index=False)
df_submission.head()
这里给出另一个类似的kaggle项目代码
# This Python 3 environment comes with many helpful analytics libraries installed
# It is defined by the kaggle/python Docker image: https://github.com/kaggle/docker-python
# For example, here's several helpful packages to load

import numpy as np # linear algebra
import pandas as pd # data processing, CSV file I/O (e.g. pd.read_csv)

# Input data files are available in the read-only "../input/" directory
# For example, running this (by clicking run or pressing Shift+Enter) will list all files under the input directory

import os
for dirname, _, filenames in os.walk('/kaggle/input'):
    for filename in filenames:
        print(os.path.join(dirname, filename))

# You can write up to 20GB to the current directory (/kaggle/working/) that gets preserved as output when you create a version using "Save & Run All"
# You can also write temporary files to /kaggle/temp/, but they won't be saved outside of the current session


#导入数据包
import datetime as dt
import logging
import warnings
warnings.filterwarnings('ignore')
import os
import seaborn as sns
import matplotlib.pyplot as plt
# %matplotlib inline
from sklearn.feature_selection import RFE
from sklearn.model_selection import train_test_split
from sklearn.model_selection import cross_val_score
from sklearn.model_selection import KFold
from sklearn.pipeline import Pipeline
from sklearn.preprocessing import StandardScaler
import matplotlib.pyplot as plt
from sklearn.metrics import mean_squared_error
import catboost
from catboost import CatBoostRegressor
from catboost import Pool, cv
from sklearn import metrics
from sklearn.model_selection import GridSearchCV


### 读取数据
items=pd.read_csv('/kaggle/input/competitive-data-science-predict-future-sales/items.csv')
item_cat=pd.read_csv('/kaggle/input/competitive-data-science-predict-future-sales/item_categories.csv')
train_df=pd.read_csv('/kaggle/input/competitive-data-science-predict-future-sales/sales_train.csv')
shops=pd.read_csv('/kaggle/input/competitive-data-science-predict-future-sales/shops.csv')
test_df=pd.read_csv('/kaggle/input/competitive-data-science-predict-future-sales/test.csv')
submission=pd.read_csv('/kaggle/input/competitive-data-science-predict-future-sales/sample_submission.csv')


#打印数据尺寸信息
display(items.shape)
display(item_cat.shape)
display(train_df.shape)
display(shops.shape)
display(test_df.shape)
display(submission.shape)


#打印前5行数据
print(items.head())
print(item_cat.head())
print(train_df.head())
print(shops.head())
print(test_df.head())
print(submission.head())


#打印数据基本信息的同时,检测是否有异常值
train_df.describe()
# 	date_block_num	shop_id	item_id	item_price	item_cnt_day
# count	2.935849e+06	2.935849e+06	2.935849e+06	2.935849e+06	2.935849e+06
# mean	1.456991e+01	3.300173e+01	1.019723e+04	8.908532e+02	1.242641e+00
# std	9.422988e+00	1.622697e+01	6.324297e+03	1.729800e+03	2.618834e+00
# min	0.000000e+00	0.000000e+00	0.000000e+00	-1.000000e+00	-2.200000e+01
# 25%	7.000000e+00	2.200000e+01	4.476000e+03	2.490000e+02	1.000000e+00
# 50%	1.400000e+01	3.100000e+01	9.343000e+03	3.990000e+02	1.000000e+00
# 75%	2.300000e+01	4.700000e+01	1.568400e+04	9.990000e+02	1.000000e+00
# max	3.300000e+01	5.900000e+01	2.216900e+04	3.079800e+05	2.169000e+03
train_df.isnull().sum()##查看是否有异常值
train_df.head()
## 删掉不必要的数据列
train_df.drop(['date_block_num','item_price'],axis=1,inplace=True)
### 将日期时间数据列转换为datetime类型数据
train_df['date'] = pd.to_datetime(train_df['date'])
train_df.head()
## 将datetime类型的数据中的年月赋值给数据新的月(年)份列
train_df['month']=train_df['date'].dt.month
train_df['year']=train_df['date'].dt.year
# 	date	shop_id	item_id	item_cnt_day	month	year
# 0	2013-02-01	59	22154	1.0	2	2013
# 1	2013-03-01	25	2552	1.0	3	2013
# 2	2013-05-01	25	2552	-1.0	5	2013
# 3	2013-06-01	25	2554	1.0	6	2013
# 4	2013-01-15	25	2555	1.0	1	2013
# ...	...	...	...	...	...	...
# 2935844	2015-10-10	25	7409	1.0	10	2015
# 2935845	2015-09-10	25	7460	1.0	9	2015
# 2935846	2015-10-14	25	7459	1.0	10	2015
# 2935847	2015-10-22	25	7440	1.0	10	2015
# 2935848	2015-03-10	25	7460	1.0	3	2015
#不管是几号的数据,一律模糊处理成为某一月份的数据,最后用于相加
train_df['date'] = train_df['date'].apply(lambda x: x.strftime('%Y-%m'))
### 按照时间->商店名->商品名分组并聚合,形成新的数据
data = train_df.groupby(['date','shop_id','item_id']).sum()
#形成一张新的数据透视表,处理成为期望输入模型的数据
data = data.pivot_table(index=['shop_id','item_id'], columns='date', values='item_cnt_day', fill_value=0)
data.reset_index(inplace=True)
# date	shop_id	item_id	2013-01	2013-02	2013-03	2013-04	2013-05	2013-06	2013-07	2013-08	...	2015-03	2015-04	2015-05	2015-06	2015-07	2015-08	2015-09	2015-10	2015-11	2015-12
# 0	0	30	0	31	0	0	0	0	0	0	...	0	0	0	0	0	0	0	0	0	0
# 1	0	31	0	11	0	0	0	0	0	0	...	0	0	0	0	0	0	0	0	0	0
# 2	0	32	4	6	2	0	1	1	0	0	...	0	0	0	0	0	0	0	0	0	0
# 3	0	33	2	2	1	0	0	0	1	0	...	0	0	0	0	0	0	0	0	0	0
# 4	0	35	2	6	0	1	0	2	0	2	...	0	0	0	0	0	0	0	0	0	0
# ...	...	...	...	...	...	...	...	...	...	...	...	...	...	...	...	...	...	...	...	...	...
# 424119	59	22154	0	1	0	0	0	0	0	0	...	0	0	0	0	0	0	0	0	0	0
# 424120	59	22155	0	0	0	0	0	0	0	0	...	0	0	0	0	0	0	0	0	0	0
# 424121	59	22162	0	0	0	0	0	0	0	0	...	2	1	1	0	1	0	1	0	1	0
# 424122	59	22164	0	0	0	0	0	0	0	0	...	1	2	0	0	1	0	0	0	1	0
# 424123	59	22167	0	0	1	0	0	0	0	0	...	0	0	0	0	0	0	0	0	0	0
display(test_df.shape)
# 将测试集和数据进行表的连接
test_df=pd.merge(test_df, data, on=['shop_id','item_id'], how='left')
display(test_df.shape)
test_df = test_df.fillna(0)


# 接着将数据划分成为训练集和测试集
#将最后一个数据作为标签,其他数据作为特征
Y_train = data['2015-12'].values
X_train = data.drop(['2015-12'], axis = 1)
X_test = test_df
print(X_train.shape, Y_train.shape)
print(X_test.shape)
x_train, x_test, y_train, y_test = train_test_split( X_train, Y_train, test_size=0.20, random_state=123)


#打印训练集测试集尺寸
print(x_train.shape)
print(x_test.shape)
print(y_train.shape)
print(y_test.shape)


## Prepara a pool of train and validation set
pool_train=Pool(x_train,y_train)
pool_val=Pool(x_test,y_test)


### Define a cv function to fit on data and find the optimal number of iteration keeping other parameters fixed
### Function takes input = catboost object with default params , train data ,train y data
def modelfit(params,poolX,useTrainCV=True,cv_folds=5,early_stopping_rounds=40):
    if useTrainCV:
        cvresult = cv(params=params, pool=poolX,nfold=cv_folds,early_stopping_rounds=early_stopping_rounds,plot=True)
    return cvresult ## return dataframe for the iteration till the optimal iteration is reached


## Prepara a cv class
params={
    'loss_function':'RMSE'
}


### Object return the optimal number of trees to grow
n_est=modelfit(params,pool_train)


n_est.shape[0]### best iteration =664


### Fit the model with iteration=664
cboost1=CatBoostRegressor(iterations=664,loss_function='RMSE',random_seed=123)
cboost1.fit(x_train,y_train)


#Predict training set:
train_predictions = cboost1.predict(x_train)
#Print model report:
print("\\nModel Report Train")
print("Root Mean Square Error : %.4g" % metrics.mean_squared_error(y_train, train_predictions))
print("R^2 Score (Train): %f" % metrics.r2_score(y_train, train_predictions))


#Predict training set:
test_predictions = cboost1.predict(x_test)
#Print model report:
print("\\nModel Report Test")
print("Root Mean Square Error : %.4g" % metrics.mean_squared_error(y_test, test_predictions))
print("R^2 Score (Train): %f" % metrics.r2_score(y_test, test_predictions))


prediction = cboost1.predict(X_test)
prediction = list(map(round, prediction))
len(prediction)


submission
submission['item_cnt_month'] = prediction
submission.to_csv('prediction.csv', index=False)
submission.tail()
submission.head(50)
作于:
2021-6-9
22:33
以上是关于如何开启一个kaggle项目(流程有哪些?)销量预测项目的主要内容,如果未能解决你的问题,请参考以下文章