R语言ggplot2可视化使用ggsave将可视化图像结果保存为SVG文件实战
Posted Data+Science+Insight
tags:
篇首语:本文由小常识网(cha138.com)小编为大家整理,主要介绍了R语言ggplot2可视化使用ggsave将可视化图像结果保存为SVG文件实战相关的知识,希望对你有一定的参考价值。
R语言ggplot2可视化使用ggsave将可视化图像结果保存为SVG文件实战
#使用ggsave将可视化图像结果保存为SVG文件
require("ggplot2")
#some sample data
head(diamonds)
#to see actually what will be plotted and compare
qplot(clarity, data=diamonds, fill=cut, geom="bar")
#save the plot in a variable image to be able to export to svg
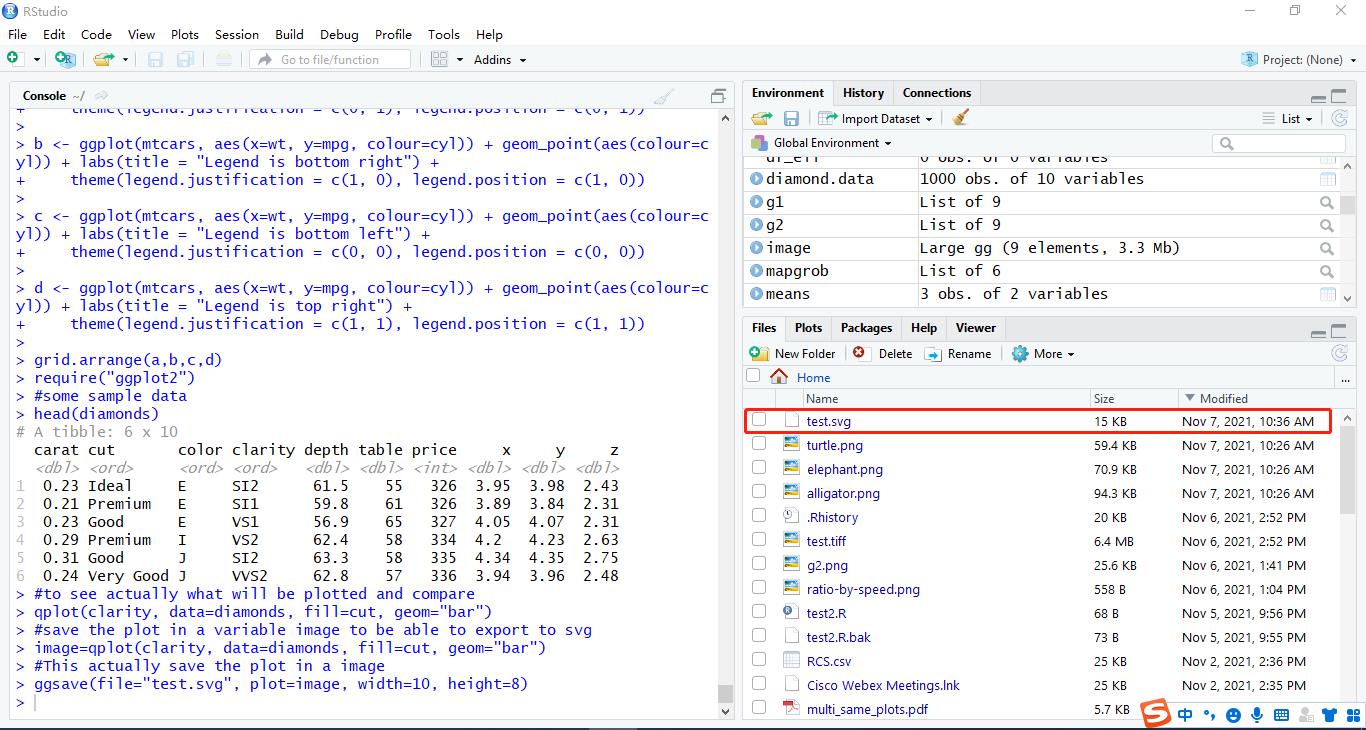
image=qplot(clarity, data=diamonds, fill=cut, geom="bar")
#This actually save the plot in a image
ggsave(file="test.svg", plot=image, width=10, height=8)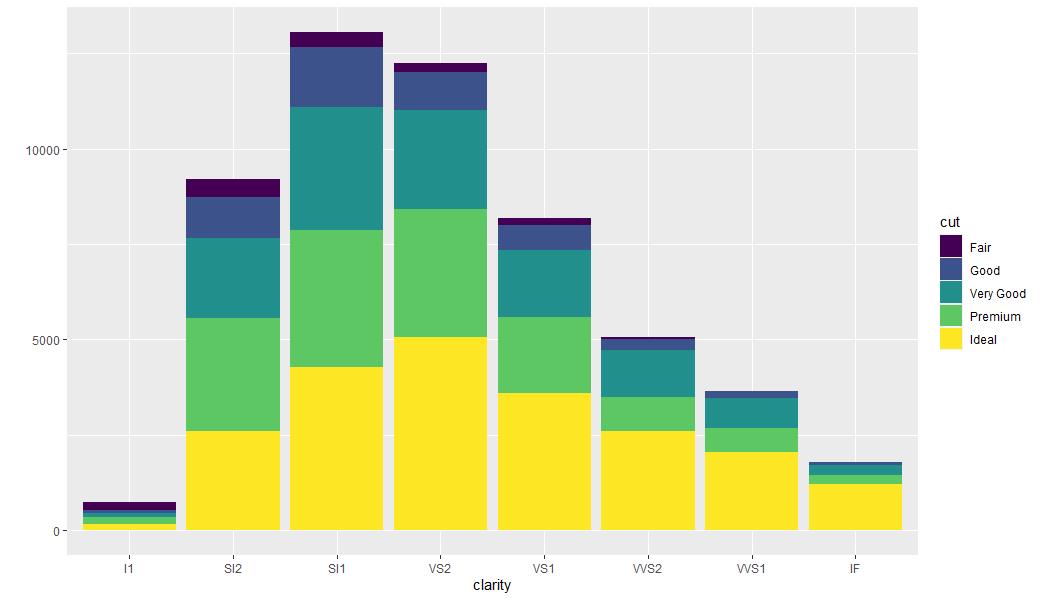
参考:R
参考:How to save a plot made with ggplot2 as SVG
以上是关于R语言ggplot2可视化使用ggsave将可视化图像结果保存为SVG文件实战的主要内容,如果未能解决你的问题,请参考以下文章