ZedGraph的常用属性
Posted Thomas会写字
tags:
篇首语:本文由小常识网(cha138.com)小编为大家整理,主要介绍了ZedGraph的常用属性相关的知识,希望对你有一定的参考价值。
前面有一篇文章介绍ZedGraph的官网,以及控件的使用文档。
https://blog.csdn.net/weixin_40314351/article/details/114273114
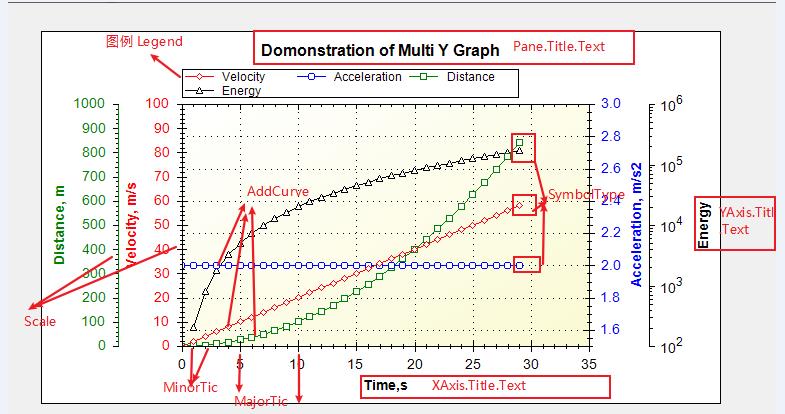
现在,通过一个案例了解ZedGraph的常用属性。话不多数,直接上图。

这个是官网的一个案例,实现了多个Y轴同时在使用。
public partial class Form1 : Form
    {
        Graphpane myPane ;
        PointPairList vlist ;
        PointPairList alist ;
        PointPairList dlist ;
        PointPairList elist ;
        YAxis yAxis3;
        Y2Axis yAxis4;

        public Form1()
        {
            InitializeComponent();
            InitZedGraph();
            btnNew.Click += new EventHandler(btnNew_Click);

        }

        #region 初始化图表控件
        private void InitZedGraph()
        {
            myPane = myZedgraph.GraphPane;
            myPane.Title.Text = "Domonstration of Multi Y Graph";
            myPane.XAxis.Title.Text = "Time,s";
            myPane.YAxis.Title.Text = "Velocity, m/s";
            myPane.Y2Axis.Title.Text = "Acceleration, m/s2";

            vlist = new PointPairList();
            alist = new PointPairList();
            dlist = new PointPairList();
            elist = new PointPairList();

            for (int i = 0; i < 30; i++)
            {
                double time = (double)i;
                double acceleration = 2.0;
                double velocity = acceleration * time;
                double distance = acceleration * time * time / 2.0;
                double energy = 100.0 * velocity * velocity / 2.0;

                alist.Add(time, acceleration);
                vlist.Add(time, velocity);
                elist.Add(time, energy);
                dlist.Add(time, distance);
            }

            //generate a red curve with diamond symbols, and "Velocity" in the legend
            LineItem myCurve = myPane.AddCurve("Velocity", vlist, Color.Red, SymbolType.Diamond);
            myCurve.Symbol.Fill = new Fill(Color.White);   // fill the symbols with white

            //generate a blue curve with circle symbols , and "Acceleration" in the legend
            myCurve = myPane.AddCurve("Acceleration", alist, Color.Blue, SymbolType.Circle);
            myCurve.Symbol.Fill = new Fill(Color.White);   //fill the symbols with white
            myCurve.IsY2Axis = true;                      // associate this curve with Y2 axis

            //generate a green curve with square symbols, and "Distance" in the legend
            myCurve = myPane.AddCurve("Distance", dlist, Color.Green, SymbolType.Square);
            myCurve.Symbol.Fill = new Fill(Color.White);   //fill the symbols with white
            myCurve.YAxisIndex = 1;                        // Associate this curve with the second axis

            //generate a Black curve with triangle symbols, and "Energy" in the legend
            myCurve = myPane.AddCurve("Energy", elist, Color.Black, SymbolType.Triangle);
            myCurve.Symbol.Fill = new Fill(Color.White);     // fill the symbols with white
            myCurve.IsY2Axis = true;                         // Associate this curve with the Y2 axis
            myCurve.YAxisIndex = 1;                          // Associate this curve with the second Y2 axis

            //show the x axis grid
            myPane.XAxis.MajorGrid.IsVisible = true;

            //make the Y axis scale red
            myPane.YAxis.Scale.FontSpec.FontColor = Color.Red;
            myPane.YAxis.Title.FontSpec.FontColor = Color.Red;

            //turn off the opposite tics so the Y Tics don't show up on the Y2 axis
            myPane.YAxis.MajorTic.IsOpposite = false;
            myPane.YAxis.MinorTic.IsOpposite = false;

            // don't display the y zero line
            myPane.YAxis.MajorGrid.IsZeroLine = false;

            //Align the Y axis labels so they are flush to the axis
            myPane.YAxis.Scale.Align = AlignP.Inside;
            myPane.YAxis.Scale.Max = 100;

            //enable the Y2 Axis display
            myPane.Y2Axis.IsVisible = true;

            //make the Y2 Axis scale blue
            myPane.Y2Axis.Scale.FontSpec.FontColor = Color.Blue;
            myPane.Y2Axis.Title.FontSpec.FontColor = Color.Blue;

            //turn off the opposite tics so the Y2 tics don't show up on the Y axis
            myPane.Y2Axis.MajorTic.IsOpposite = false;
            myPane.Y2Axis.MinorTic.IsOpposite = false;

            //display the Y2 axis grid lines
            myPane.Y2Axis.MajorGrid.IsVisible = true;
            myPane.Y2Axis.Scale.Align = AlignP.Inside;   //align the Y2 axis labels so they are flush to the axis
            myPane.Y2Axis.Scale.Min = 1.5;
            myPane.Y2Axis.Scale.Max = 3;

            //create a second Y axis, green
            yAxis3 = new YAxis("Distance, m");
            myPane.YAxisList.Add(yAxis3);
            yAxis3.Scale.FontSpec.FontColor = Color.Green;
            yAxis3.Title.FontSpec.FontColor = Color.Green;
            yAxis3.Color = Color.Green;

            //turn off the opposite tics so the Y2 tics don't show up on the Y axis
            yAxis3.MajorTic.IsInside = false;
            yAxis3.MinorTic.IsInside = false;
            yAxis3.MajorTic.IsOpposite = false;
            yAxis3.MinorTic.IsOpposite = false;
            yAxis3.Scale.Align = AlignP.Inside;   //align the Y2 axis labels so they are flush to the axis

            yAxis4 = new Y2Axis("Energy");
            yAxis4.IsVisible = true;
            myPane.Y2AxisList.Add(yAxis4);

            //turn off the opposite tics so the Y2 tics don't show up on the y axis
            yAxis4.MajorTic.IsInside = false;
            yAxis4.MinorTic.IsInside = false;
            yAxis4.MajorTic.IsOpposite = false;
            yAxis4.MinorTic.IsOpposite = false;

            //Align the Y2 axis labels so they are flush to the axis
            yAxis4.Scale.Align = AlignP.Inside;
            yAxis4.Type = AxisType.Log;
            yAxis4.Scale.Min = 100;

            //fill the axis background with a gradient
            myPane.Chart.Fill = new Fill(Color.White, Color.LightGoldenrodYellow, 45.0f);
            myZedgraph.AxisChange();

        }
        #endregion
    }
以上是关于ZedGraph的常用属性的主要内容,如果未能解决你的问题,请参考以下文章