二次曲线拟合
Posted Thomas会写字
tags:
篇首语:本文由小常识网(cha138.com)小编为大家整理,主要介绍了二次曲线拟合相关的知识,希望对你有一定的参考价值。

解此方程得到在均方误差最小意义下的拟合函数p(x),上述方程组称为多项式拟合的法方程,法方程的系数矩阵是对称的。当拟保多项式阶n>5时,法方程的系数矩阵是病态的,在计算中要用双精度或者一些特殊算法以保护解得准确性。
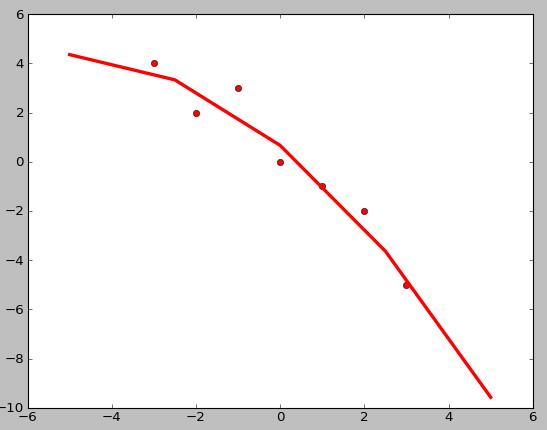
示例:给定一组数据,用二次多项式函数拟合这组数据

散点图如下所示:

程序如下:
############################################
#Edit by wd,2013,4,16
############################################

import matplotlib.pyplot as plt
import numpy as np

x = [-3,-2,-1,0,1,2,3]
y = [4,2,3,0,-1,-2,-5]

if len(x) != len(y):
    exit

m = len(x)

def matrix_n(alist=[],n=0):
    llen = len(alist)
    r_list = [0]*llen
    for i in range(llen):
        r_list[i] = alist[i] ** n
    return r_list

x_0 = [1]*m
x_2 = matrix_n(x,2)
x_3 = matrix_n(x,3)

x_matrix = np.matrix((x_0,x,x_2),dtype=np.int)
print x_matrix
y_matrix = np.matrix((y),dtype=np.int)
y_matrix = y_matrix.T

x_matrix_t = x_matrix.T
print x_matrix_t

out = ((x_matrix * x_matrix_t)** -1)*(x_matrix * y_matrix)

print out

'''
[[ 0.66666667]
[-1.39285714]
[-0.13095238]]
'''

plt.plot(x,y,"ro")
#plt.show()

xx = np.linspace(-5,5,5)
yy = -0.13095238*xx*xx + -1.39285714*xx + 0.66666667
plt.plot(xx,yy,label="$-0.13095238*xx*xx + -1.39285714*xx + 0.66666667$",color="red",linewidth=3)
plt.show()
拟合之后的图:

以上是关于二次曲线拟合的主要内容,如果未能解决你的问题,请参考以下文章