数据挖掘鸢尾花分析实验与数据降维
Posted ZSYL
tags:
篇首语:本文由小常识网(cha138.com)小编为大家整理,主要介绍了数据挖掘鸢尾花分析实验与数据降维相关的知识,希望对你有一定的参考价值。
鸢尾花分析实验与数据降维
实验目的:用鸢尾花数据,先进行可视化,然后算达到85%贡献率的最佳维数,如果这个维数不好,继续降维。
import pandas as pd
import numpy as np
import matplotlib.pyplot as plt
from pylab import mpl
import warnings
warnings.filterwarnings('ignore')
# 风格设置
plt.style.use("seaborn-colorblind")
# 设置字体为仿宋
plt.rcParams['font.sans-serif'] = ['FangSong']
# 设置正常显示符号
mpl.rcParams["axes.unicode_minus"] = False
data = pd.read_csv('./data/iris.csv', index_col=0)
data.head()
| Sepal.Length | Sepal.Width | Petal.Length | Petal.Width | Species | |
|---|---|---|---|---|---|
| 1 | 5.1 | 3.5 | 1.4 | 0.2 | setosa |
| 2 | 4.9 | 3.0 | 1.4 | 0.2 | setosa |
| 3 | 4.7 | 3.2 | 1.3 | 0.2 | setosa |
| 4 | 4.6 | 3.1 | 1.5 | 0.2 | setosa |
| 5 | 5.0 | 3.6 | 1.4 | 0.2 | setosa |
name = data.columns
name[:2]
Index(['Sepal.Length', 'Sepal.Width'], dtype='object')
data[name[0]].values
array([5.1, 4.9, 4.7, 4.6, 5. , 5.4, 4.6, 5. , 4.4, 4.9, 5.4, 4.8, 4.8,
       4.3, 5.8, 5.7, 5.4, 5.1, 5.7, 5.1, 5.4, 5.1, 4.6, 5.1, 4.8, 5. ,
       5. , 5.2, 5.2, 4.7, 4.8, 5.4, 5.2, 5.5, 4.9, 5. , 5.5, 4.9, 4.4,
       5.1, 5. , 4.5, 4.4, 5. , 5.1, 4.8, 5.1, 4.6, 5.3, 5. , 7. , 6.4,
       6.9, 5.5, 6.5, 5.7, 6.3, 4.9, 6.6, 5.2, 5. , 5.9, 6. , 6.1, 5.6,
       6.7, 5.6, 5.8, 6.2, 5.6, 5.9, 6.1, 6.3, 6.1, 6.4, 6.6, 6.8, 6.7,
       6. , 5.7, 5.5, 5.5, 5.8, 6. , 5.4, 6. , 6.7, 6.3, 5.6, 5.5, 5.5,
       6.1, 5.8, 5. , 5.6, 5.7, 5.7, 6.2, 5.1, 5.7, 6.3, 5.8, 7.1, 6.3,
       6.5, 7.6, 4.9, 7.3, 6.7, 7.2, 6.5, 6.4, 6.8, 5.7, 5.8, 6.4, 6.5,
       7.7, 7.7, 6. , 6.9, 5.6, 7.7, 6.3, 6.7, 7.2, 6.2, 6.1, 6.4, 7.2,
       7.4, 7.9, 6.4, 6.3, 6.1, 7.7, 6.3, 6.4, 6. , 6.9, 6.7, 6.9, 5.8,
       6.8, 6.7, 6.7, 6.3, 6.5, 6.2, 5.9])
data.iloc[:, -1]
1         setosa
2         setosa
3         setosa
4         setosa
5         setosa
         ...
146    virginica
147    virginica
148    virginica
149    virginica
150    virginica
Name: Species, Length: 150, dtype: object
data.iloc[:, -1]
1         setosa
2         setosa
3         setosa
4         setosa
5         setosa
         ...
146    virginica
147    virginica
148    virginica
149    virginica
150    virginica
Name: Species, Length: 150, dtype: object
data[name[-1]]
1         setosa
2         setosa
3         setosa
4         setosa
5         setosa
         ...
146    virginica
147    virginica
148    virginica
149    virginica
150    virginica
Name: Species, Length: 150, dtype: object
相关性分析
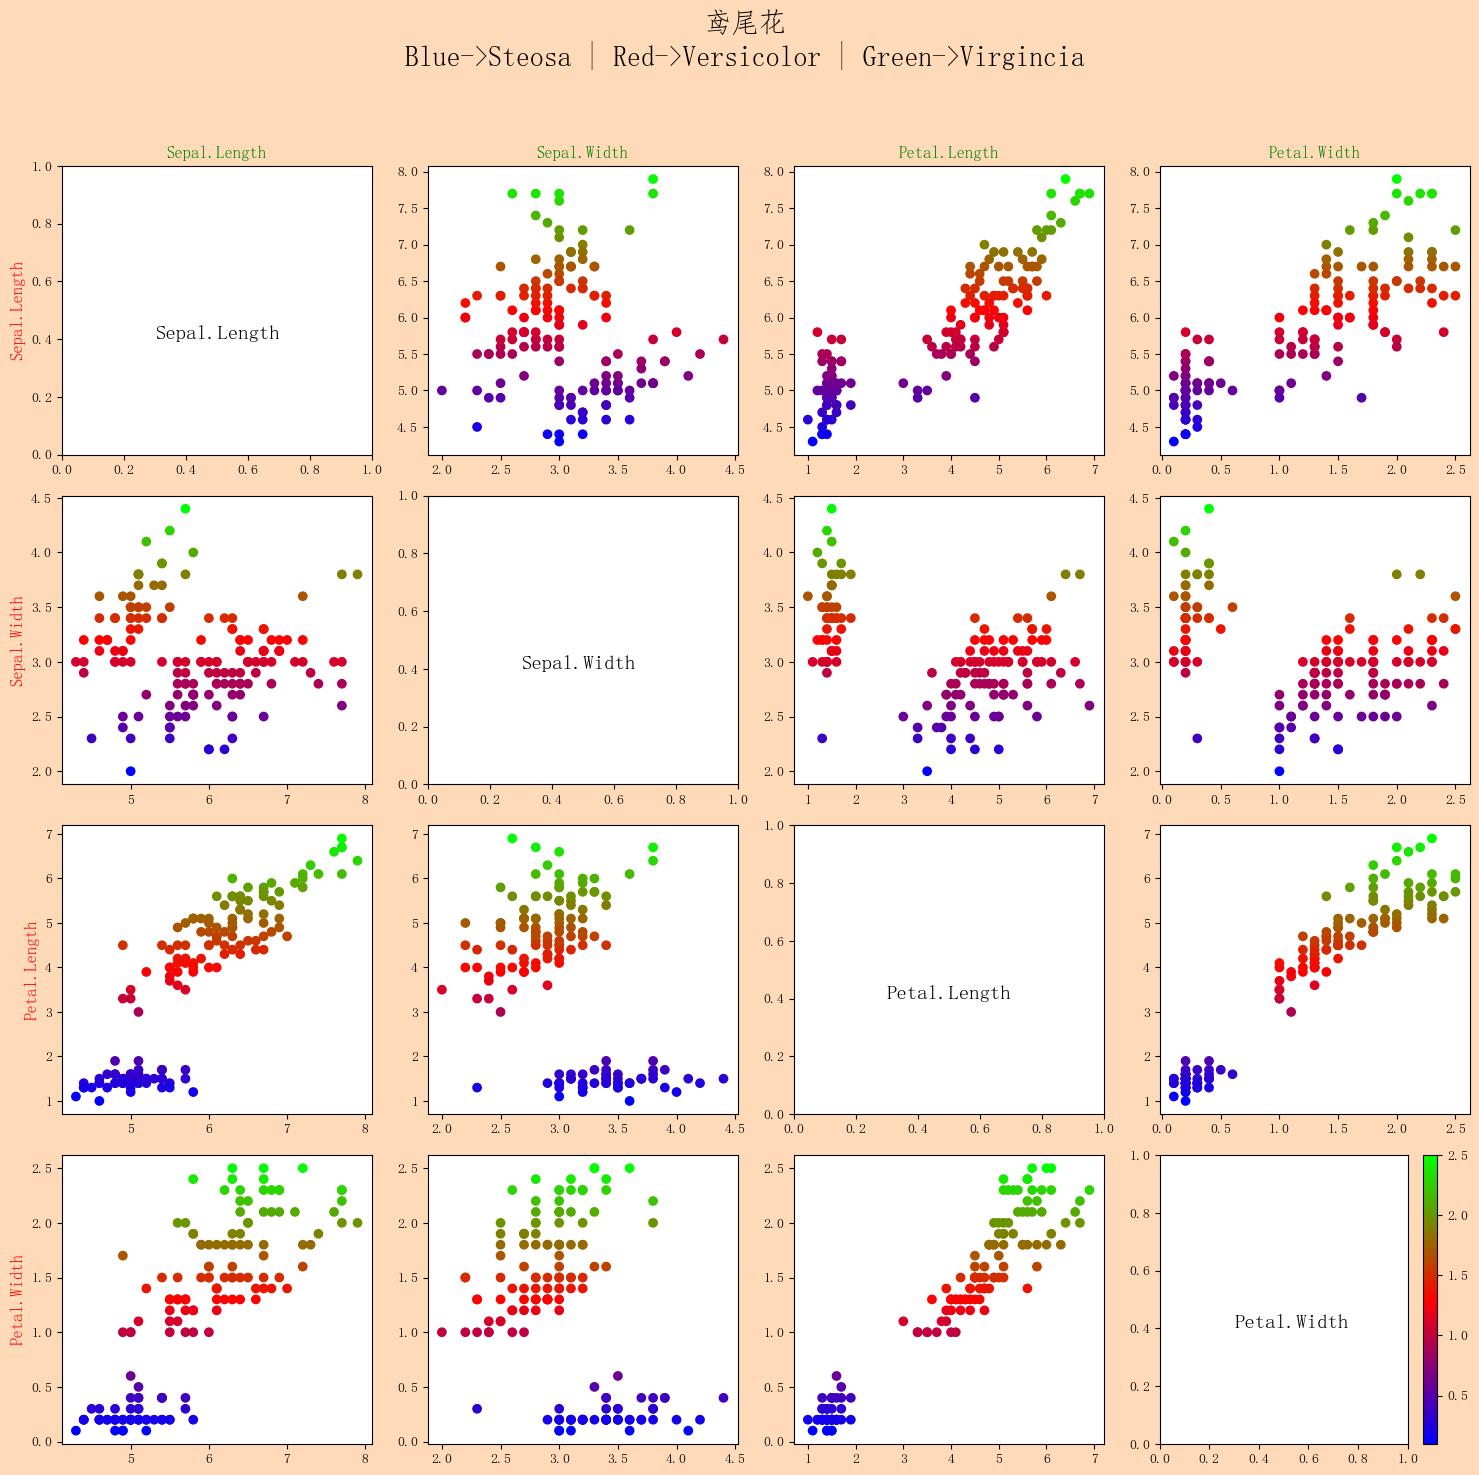
ax = plt.figure(figsize=(15, 15), dpi=100)
ax.set_facecolor('peachpuff')
for i in range(4):
    for j in range(4):
        plt.subplot(4, 4, i * 4 + j + 1)
        if i == 0:
            plt.title(name[j], c='g')
        if j == 0:
            plt.ylabel(name[i], c='r', fontsize=12)
        if i == j:
            plt.text(0.3, 0.4, name[i], fontsize=15)
            continue

        plt.scatter(data[name[j]], data[name[i]], c=data[name[i]], cmap='brg')

plt.tight_layout(rect=[0, 0, 1, 0.9])
plt.suptitle('鸢尾花\\nBlue->Steosa | Red->Versicolor | Green->Virgincia', fontsize=20)
# plt.colorbar()  # 显示颜色条
plt.show()

scatter_matrix散点矩阵图代表了两变量的相关程度,如果呈现出沿着对角线分布的趋势,说明它们的相关性较高。
特征工程-特征降维
降维是指在某些限定条件下,降低随机变量(特征)个数,得到一组“不相关”主变量的过程.
降维的两种方式:
- 特征选择
- 主成分分析(可以理解一种特征提取的方式)
特征选择:
- 数据中包含冗余或无关变量(或称特征、属性、指标等),旨在从原有特征中找出主要特征。
- 方法:
- Filter(过滤式):主要探究特征本身特点、特征与特征和目标值之间关联
方差选择法:低方差特征过滤
相关系数 - Embedded (嵌入式):算法自动选择特征(特征与目标值之间的关联)
决策树:信息熵、信息增益
正则化:L1、L2
深度学习:卷积等
- Filter(过滤式):主要探究特征本身特点、特征与特征和目标值之间关联
from sklearn.datasets import load_iris
from sklearn.decomposition import PCA
iris = load_iris()
y = iris.target
X = iris.data
低方差特征过滤
删除低方差的一些特征,前面讲过方差的意义。再结合方差的大小来考虑这个方式的角度。
from sklearn.feature_selection import VarianceThreshold

print('原数据的形状:\\n', data.shape)
# print(data)

# 1.实例化一个转化器
transfer = VarianceThreshold(threshold=1)
# 2.调用fit_transform
data1 = transfer.fit_transform(data.iloc[:, :-1])
# print("删除低方差特征的结果:\\n", data1)
print("删除低方差特征后的形状:\\n", data1.shape)
原数据的形状:
 (150, 5)
删除低方差特征后的形状:
 (150, 1)
相关系数
主要实现方式:
- 皮尔逊相关系数
- 斯皮尔曼相关系数
皮尔逊相关系数(Pearson Correlation Coefficient)
作用:反映变量之间相关关系密切程度的统计指标
相关系数的值介于–1与+1之间,即–1≤ r ≤+1。其性质如下:
- 当r>0时,表示两变量正相关,r<0时,两变量为负相关
- 当|r|=1时,表示两变量为完全相关,当r=0时,表示两变量间无相关关系
- 当0<|r|<1时,表示两变量存在一定程度的相关。且|r|越接近1,两变量间线性关系越密切;|r|越接近于0,表示两变量的线性相关越弱
- 一般可按三级划分:|r|<0.4为低度相关;0.4≤|r|<0.7为显著性相关;0.7≤|r|<1为高度线性相关
from scipy.stats import pearsonr
from itertools import combinations

def combine(temp_list, n):
    '''根据n获得列表中的所有可能组合(n个元素为一组)'''
    temp_list2 = []
    for c in combinations(temp_list, n):
        temp_list2.append(c)
    return temp_list2

list1 = ['a', 'b', 'c', 'd', 'e']
end_list = []
for i in range(len(list1)+1):
    end_list.extend(combine(list1, i))

print(end_list)
print(len(end_list))
[(), ('a',), ('b',), ('c',), ('d',), ('e',), ('a', 'b'), ('a', 'c'), ('a', 'd'), ('a', 'e'), ('b', 'c'), ('b', 'd'), ('b', 'e'), ('c', 'd'), ('c', 'e'), ('d', 'e'), ('a', 'b', 'c'), ('a', 'b', 'd'), ('a', 'b', 'e'), ('a', 'c', 'd'), ('a', 'c', 'e'), ('a', 'd', 'e'), ('b', 'c', 'd'), ('b', 'c', 'e'), ('b', 'd', 'e'), ('c', 'd', 'e'), ('a', 'b', 'c', 'd'), ('a', 'b', 'c', 'e'), ('a', 'b', 'd', 'e'), ('a', 'c', 'd', 'e'), ('b', 'c', 'd', 'e'), ('a', 'b', 'c', 'd', 'e')]
32
list(combinations(name[:-2], 2))
[('Sepal.Length', 'Sepal.Width'),
 ('Sepal.Length', 'Petal.Length'),
 ('Sepal.Width', 'Petal.Length')]
# 计算特征两两之间的相关系数
for cob in list(combinations(name[:-2], 2)):
    print(f'{cob[0]}与{cob[1]}的相关系数与P值分别为:', pearsonr(data[cob[0]], data[cob[1]]))
Sepal.Length与Sepal.Width的相关系数与P值分别为: (-0.11756978413300204, 0.15189826071144918)
Sepal.Length与Petal.Length的相关系数与P值分别为: (0.8717537758865832, 1.0386674194497525e-47)
Sepal.Width与Petal.Length的相关系数与P值分别为: (-0.4284401043305397, 4.5133142672730875e-08)
斯皮尔曼相关系数(Rank IC)
作用:反映变量之间相关关系密切程度的统计指标
from scipy.stats import spearmanr

# 计算特征两两之间的相关系数
for cob in list(combinations(name[:-2], 2)):
    print(f'{cob[0]}与{cob[1]}的相关系数与P值分别为:', spearmanr(data[cob[0]], data[cob[1]]))
Sepal.Length与Sepal.Width的相关系数与P值分别为: SpearmanrResult(correlation=-0.166777658283235, pvalue=0.04136799424884587)
Sepal.Length与Petal.Length的相关系数与P值分别为: SpearmanrResult(correlation=0.881898126434986, pvalue=3.4430872780470036e-50)
Sepal.Width与Petal.Length的相关系数与P值分别为: SpearmanrResult(correlation=-0.30963508601557777, pvalue=0.00011539383750561881)
主成分分析(PCA)
- 定义:高维数据转化为低维数据的过程,在此过程中可能会舍弃原有数据、创造新的变量
- 作用:是数据维数压缩,尽可能降低原数据的维数(复杂度),损失少量信息。
- 应用:回归分析或者聚类分析当中
from sklearn.decomposition import PCA
X_dr = PCA(2).fit_transform(X)
X.shape
(150, 4)
X_dr.shape
(150, 2)
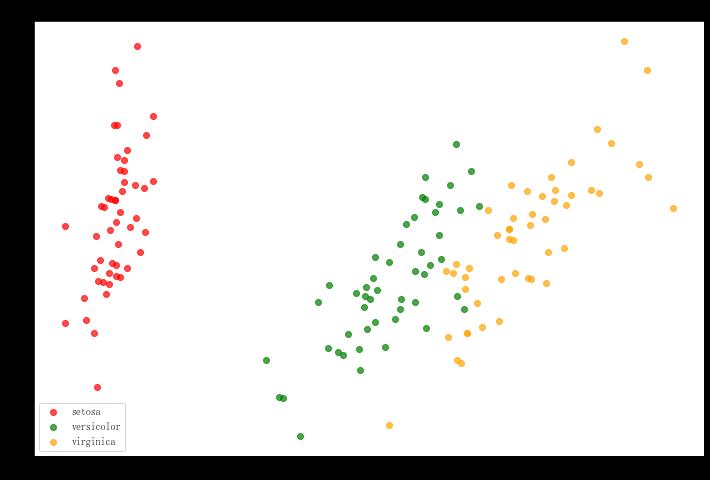
X_dr = PCA(2).fit_transform(X)
colors = ['red', 'green', 'orange']
plt.figure(figsize=(12, 8))
for i in [0, 1, 2]:
    plt.scatter(X_dr[y==i, 0], X_dr[y==i, 1], alpha=.7, c=colors[i], label=iris.target_names[i])

plt.legend()
plt.title('PCA of IRIS dataset')
plt.show()

PCA(1).fit(X).explained_variance_ratio_
array([0.92461872])
PCA(2).fit(X).explained_variance_ratio_
array([0.92461872, 0.05306648])
PCA(3).fit(X).explained_variance_ratio_
array([0.92461872, 0.05306648, 0.01710261])
PCA(4).fit(X).explained_variance_ratio_
array([0.92461872, 0.05306648, 0.01710261, 0.00521218])
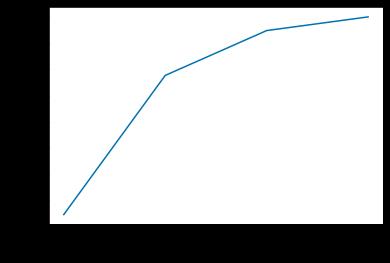
pca_line=PCA().fit(X)
plt.plot([1,2,3,4],np.cumsum(pca_line.explained_variance_ratio_))
plt.xticks([1,2,3,4]) #这是为了限制坐标轴显示为整数
plt.xlabel("number of components after dimension reduction")
plt.ylabel("cumulative explained variance")
plt.show()
pca_line.explained_variance_ratio_

array([0.92461872, 0.05306648, 0.01710261, 0.00521218])
加油!
感谢!
努力!
以上是关于数据挖掘鸢尾花分析实验与数据降维的主要内容,如果未能解决你的问题,请参考以下文章