Matplotlib实例教程直方图
Posted K同学啊
tags:
篇首语:本文由小常识网(cha138.com)小编为大家整理,主要介绍了Matplotlib实例教程直方图相关的知识,希望对你有一定的参考价值。
前言
- 🔗 运行环境:python3
- 🚩 作者:K同学啊
- 🥇 精选专栏:《深度学习100例》
- 🔥 推荐专栏:《小白入门深度学习》
- 📚 选自专栏:《Matplotlib教程》
- 🧿 优秀专栏:《Python入门100题》
代码实现
import numpy as np
import matplotlib.pyplot as plt
n_bins = 10
x = np.random.randn(1000, 3)
fig, axes = plt.subplots(nrows=2, ncols=2) #subplots创建多个子图
ax0=axes[0,0]
ax1=axes[0,1]
ax2=axes[1,0]
ax3=axes[1,1]
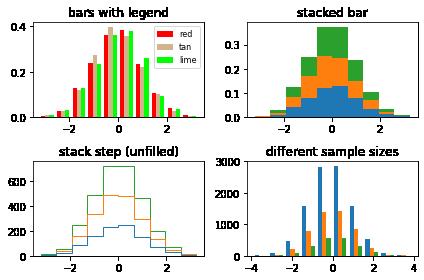
colors = ['red', 'tan', 'lime']
ax0.hist(x, n_bins, density=True, histtype='bar', color=colors, label=colors)
ax0.legend(prop={'size': 8})
ax0.set_title('bars with legend')
ax1.hist(x, n_bins, density=True, histtype='bar', stacked=True)
ax1.set_title('stacked bar')
ax2.hist(x, n_bins, histtype='step', stacked=True)
ax2.set_title('stack step (unfilled)')
x_multi = [np.random.randn(n) for n in [10000, 5000, 2000]]
ax3.hist(x_multi, n_bins, histtype='bar')
ax3.set_title('different sample sizes')
fig.tight_layout() #自动调整子图参数
plt.show()
以上是关于Matplotlib实例教程直方图的主要内容,如果未能解决你的问题,请参考以下文章