Error in xy.coords(x, y, xlabel, ylabel, log) : ‘x‘ and ‘y‘ lengths differ
Posted Data+Science+Insight
tags:
篇首语:本文由小常识网(cha138.com)小编为大家整理,主要介绍了Error in xy.coords(x, y, xlabel, ylabel, log) : ‘x‘ and ‘y‘ lengths differ相关的知识,希望对你有一定的参考价值。
Error in xy.coords(x, y, xlabel, ylabel, log) : 'x' and 'y' lengths differ
目录
Error in xy.coords(x, y, xlabel, ylabel, log) : 'x' and 'y' lengths differ
问题:
#两个向量长度不同
#define x and y variables
x <- c(2, 5, 5, 8)
y <- c(22, 28, 32, 35, 40, 41)

#attempt to create scatterplot of x vs. y
plot(x, y)
解决:
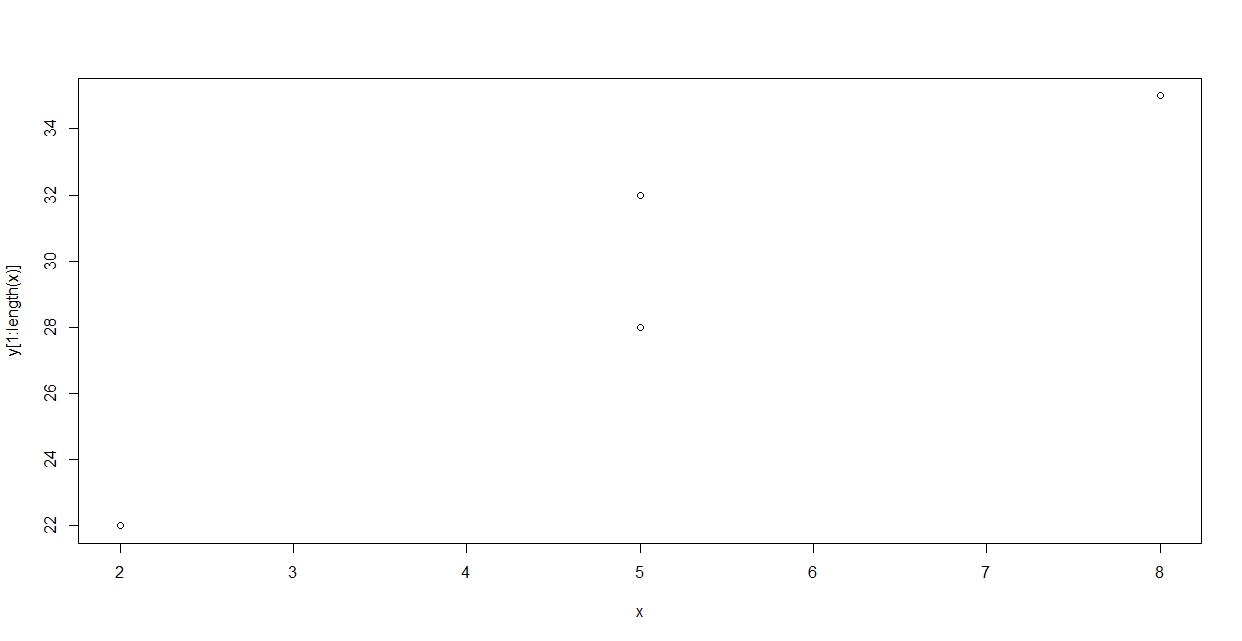
#数据长度对等,以x为基础
#define x and y variables
x <- c(2, 5, 5, 8)
y <- c(22, 28, 32, 35, 40, 41)

#create scatterplot of first 4 pairwise values of x vs. y
plot(x, y[1:length(x)])
#把x序列补齐;
#define x and y variables to have same length
x <- c(2, 5, 5, 8, 9, 12)
y <- c(22, 28, 32, 35, 40, 41)

#confirm that x and y are the same length
length(x) == length(y)

[1] TRUE

create scatterplot of x vs. y
plot(x, y)
完整问题:
> #define x and y variables
> x <- c(2, 5, 5, 8)
> y <- c(22, 28, 32, 35, 40, 41)
>
> #attempt to create scatterplot of x vs. y
> plot(x, y)
Error in xy.coords(x, y, xlabel, ylabel, log) :
'x' and 'y' lengths differ
以上是关于Error in xy.coords(x, y, xlabel, ylabel, log) : ‘x‘ and ‘y‘ lengths differ的主要内容,如果未能解决你的问题,请参考以下文章
