matplotlib 笔记:hist(直方图)
Posted UQI-LIUWJ
tags:
篇首语:本文由小常识网(cha138.com)小编为大家整理,主要介绍了matplotlib 笔记:hist(直方图)相关的知识,希望对你有一定的参考价值。
1 函数介绍
matplotlib.pyplot.hist(
    x,
    bins=None,
    range=None,
    density=None,
    bottom=None,
    histtype='bar',
    align='mid',
    log=False,
    color=None,
    label=None,
    stacked=False,
    normed=None)
2 参数说明
| x | 数据集,最终的直方图将对数据集进行统计 |
| bins | 统计的区间分布 |
| range | tuple, 显示的区间,range在没有给出bins时生效 |
| density | bool,默认为false,显示的是频数统计结果,为True则显示频率统计结果,这里需要注意,频率统计结果=区间数目/(总数*区间宽度) |
| histtype | 可选{'bar', 'barstacked', 'step', 'stepfilled'}之一,默认为bar,step使用的是梯状,stepfilled则会对梯状内部进行填充,效果与bar类似 |
| align | 可选{'left', 'mid', 'right'}之一,默认为'mid',控制柱状图的水平分布 |
| log | bool,默认False,即y坐标轴是否选择指数刻度 |
| stacked | bool,默认为False,是否为堆积状图 |
3 具体使用
3.1 bins
import matplotlib.pyplot as plt
import numpy as np
x=np.random.randint(0,100,1000)
plt.hist(x,bins=50)
3.2 range
import matplotlib.pyplot as plt
import numpy as np
x=np.random.randint(0,100,1000)
plt.hist(x,range=[0,10]) 
3.3 density
import matplotlib.pyplot as plt
import numpy as np
x=np.random.randint(0,100,1000)
plt.hist(x,bins=50,density=True)
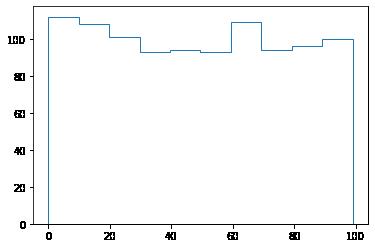
3.4 histtype='step'
import matplotlib.pyplot as plt
import numpy as np
x=np.random.randint(0,100,1000)
plt.hist(x,bins=10,histtype='step')
以上是关于matplotlib 笔记:hist(直方图)的主要内容,如果未能解决你的问题,请参考以下文章