Matplotlib实例教程:柱状图
Posted K同学啊
tags:
篇首语:本文由小常识网(cha138.com)小编为大家整理,主要介绍了Matplotlib实例教程:柱状图相关的知识,希望对你有一定的参考价值。
前言
- 🔗 运行环境:python3
- 🚩 作者:K同学啊
- 📚 选自专栏:《Matplotlib教程》
- 🧿 优秀专栏:《Python入门100题》
- 🔥 推荐专栏:《小白入门深度学习》
- 🥇 精选专栏:《深度学习100例》
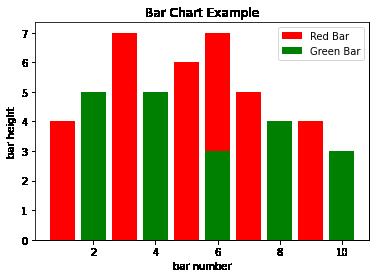
代码实现
import matplotlib.pyplot as plt

x1 = [1, 3, 4, 5, 6, 7, 9]
y1 = [4, 7, 1, 6, 7, 5, 4]

x2 = [2, 4, 6, 8, 10]
y2 = [5, 5, 3, 4, 3]


plt.bar(x1, y1, label="Red Bar", color='r')
plt.bar(x2, y2, label="Green Bar", color='g')
plt.plot()

plt.xlabel("bar number")
plt.ylabel("bar height")
plt.title("Bar Chart Example")
plt.legend()
plt.show()
以上是关于Matplotlib实例教程:柱状图的主要内容,如果未能解决你的问题,请参考以下文章