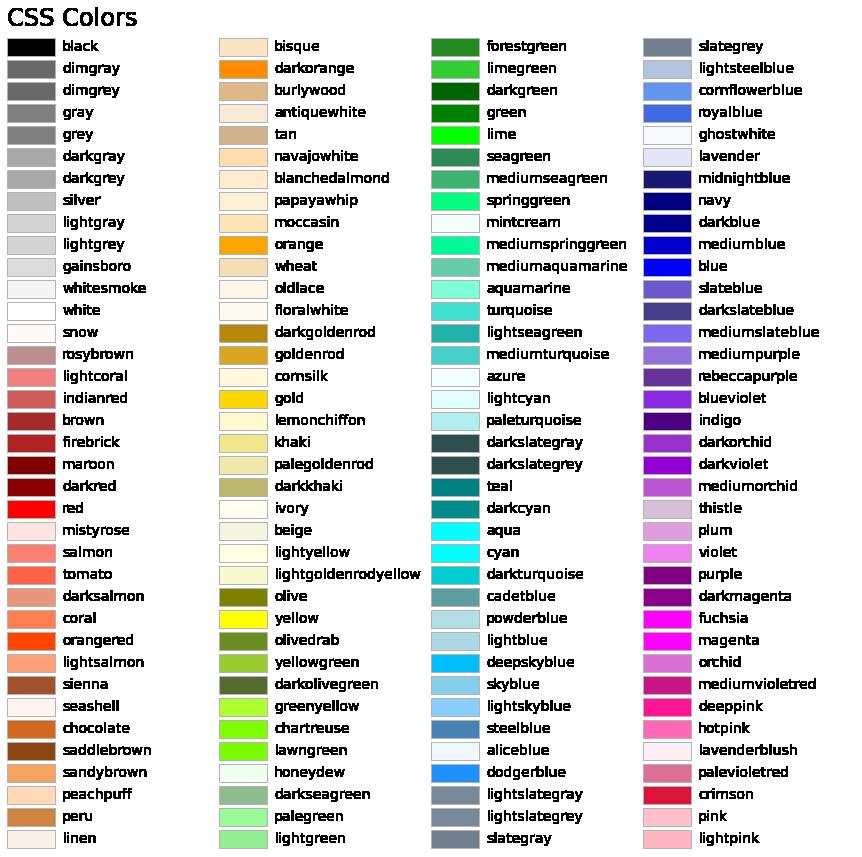
Python使用matplotlib可视化绘图时你可用的颜色有哪些?把色彩可视化出来自己选好了
Posted Data+Science+Insight
tags:
篇首语:本文由小常识网(cha138.com)小编为大家整理,主要介绍了Python使用matplotlib可视化绘图时你可用的颜色有哪些?把色彩可视化出来自己选好了相关的知识,希望对你有一定的参考价值。
Python使用matplotlib可视化绘图时你可用的颜色有哪些?把色彩可视化出来自己选好了
目录
Python使用matplotlib可视化绘图时你可用的颜色有哪些?把色彩可视化出来自己选好了
#基础色彩

#画面调色板色彩
 #CSS色彩

#代码查看可用色谱
from matplotlib.patches import Rectangle
import matplotlib.pyplot as plt
import matplotlib.colors as mcolors


def plot_colortable(colors, title, sort_colors=True, emptycols=0):

    cell_width = 212
    cell_height = 22
    swatch_width = 48
    margin = 12
    topmargin = 40

    # Sort colors by hue, saturation, value and name.
    if sort_colors is True:
        by_hsv = sorted((tuple(mcolors.rgb_to_hsv(mcolors.to_rgb(color))),
                         name)
                        for name, color in colors.items())
        names = [name for hsv, name in by_hsv]
    else:
        names = list(colors)

    n = len(names)
    ncols = 4 - emptycols
    nrows = n // ncols + int(n % ncols > 0)

    width = cell_width * 4 + 2 * margin
    height = cell_height * nrows + margin + topmargin
    dpi = 72

    fig, ax = plt.subplots(figsize=(width / dpi, height / dpi), dpi=dpi)
    fig.subplots_adjust(margin/width, margin/height,
                        (width-margin)/width, (height-topmargin)/height)
    ax.set_xlim(0, cell_width * 4)
    ax.set_ylim(cell_height * (nrows-0.5), -cell_height/2.)
    ax.yaxis.set_visible(False)
    ax.xaxis.set_visible(False)
    ax.set_axis_off()
    ax.set_title(title, fontsize=24, loc="left", pad=10)

    for i, name in enumerate(names):
        row = i % nrows
        col = i // nrows
        y = row * cell_height

        swatch_start_x = cell_width * col
        text_pos_x = cell_width * col + swatch_width + 7

        ax.text(text_pos_x, y, name, fontsize=14,
                horizontalalignment='left',
                verticalalignment='center')

        ax.add_patch(
            Rectangle(xy=(swatch_start_x, y-9), width=swatch_width,
                      height=18, facecolor=colors[name], edgecolor='0.7')
        )

    return fig

plot_colortable(mcolors.BASE_COLORS, "Base Colors",
                sort_colors=False, emptycols=1)
plot_colortable(mcolors.TABLEAU_COLORS, "Tableau Palette",
                sort_colors=False, emptycols=2)

plot_colortable(mcolors.CSS4_COLORS, "CSS Colors")

# Optionally plot the XKCD colors (Caution: will produce large figure)
#xkcd_fig = plot_colortable(mcolors.XKCD_COLORS, "XKCD Colors")
#xkcd_fig.savefig("XKCD_Colors.png")

plt.show()
List of named colors
This plots a list of the named colors supported in matplotlib. Note that xkcd colors are supported as well, but are not listed here for brevity.
For more information on colors in matplotlib see
- the Specifying Colors tutorial;
- the matplotlib.colors API;
- the Color Demo.
参考:List of named colors
参考:matplotlib
以上是关于Python使用matplotlib可视化绘图时你可用的颜色有哪些?把色彩可视化出来自己选好了的主要内容,如果未能解决你的问题,请参考以下文章