Echars简单总结
Posted 捡黄金的少年
tags:
篇首语:本文由小常识网(cha138.com)小编为大家整理,主要介绍了Echars简单总结相关的知识,希望对你有一定的参考价值。
1、title 标题
    title : {

            show:true,//显示策略,默认值true,可选为:true(显示) | false(隐藏)

            text: '主标题',//主标题文本,'\\n'指定换行

            link:'',//主标题文本超链接,默认值true

            target: null,//指定窗口打开主标题超链接,支持'self' | 'blank',不指定等同为'blank'(新窗口)

            subtext: '副标题',//副标题文本,'\\n'指定换行

            sublink: '',//副标题文本超链接

            subtarget: null,//指定窗口打开副标题超链接,支持'self' | 'blank',不指定等同为'blank'(新窗口)

            x:'center'//水平安放位置,默认为'left',可选为:'center' | 'left' | 'right' | {number}(x坐标,单位px)

            y: 'top',//垂直安放位置,默认为top,可选为:'top' | 'bottom' | 'center' | {number}(y坐标,单位px)

            textAlign: null,//水平对齐方式,默认根据x设置自动调整,可选为: left' | 'right' | 'center

            backgroundColor: 'rgba(0,0,0,0)',//标题背景颜色,默认'rgba(0,0,0,0)'透明

            borderColor: '#ccc',//标题边框颜色,默认'#ccc'

            borderWidth: 0,//标题边框线宽,单位px,默认为0(无边框)

            padding: 5,//标题内边距,单位px,默认各方向内边距为5,接受数组分别设定上右下左边距

            itemGap: 10,//主副标题纵向间隔,单位px,默认为10

            textStyle: {//主标题文本样式{"fontSize": 18,"fontWeight": "bolder","color": "#333"}

                fontFamily: 'Arial, Verdana, sans...',

                fontSize: 12,

                fontStyle: 'normal',

                fontWeight: 'normal',

            },

            subtextStyle: {//副标题文本样式{"color": "#aaa"}

                fontFamily: 'Arial, Verdana, sans...',

                fontSize: 12,

                fontStyle: 'normal',

                fontWeight: 'normal',

            },

            zlevel: 0,//一级层叠控制。默认0,每一个不同的zlevel将产生一个独立的canvas,相同zlevel的组件或图标将在同一个canvas上渲染。zlevel越高越靠顶层,canvas对象增多会消耗更多的内存和性能,并不建议设置过多的zlevel,大部分情况可以通过二级层叠控制z实现层叠控制。

            z: 6,//二级层叠控制,默认6,同一个canvas(相同zlevel)上z越高约靠顶层。

        },
2、legend 图例
  //图例,每个图表最多仅有一个图例

        legend: {
            orient: 'vertical',
            left: 'left', //位置
            data: ['第一部分','第二部分','第三部分','第四部分']
            textStyle: {   //颜色
                color: "#fff",
                fontSize: 18,//字体大
               },
              y:"15",//图例高度
            icon:"circle",//图例选择框样子
            //'circle', 'rect', 'roundRect', 'triangle', 'diamond', 'pin', 'arrow', 'none'

        },
3,grid(调整整体位置)
 grid: {
          left: "3%",
          right: "4%",
          top: "20%",
          containLabel: true,
        },
4、yAxis(Y轴)
{
type: "value",//
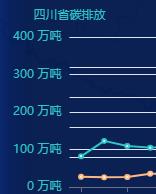
name: "四川省碳排放趋势",
min: 0,//最小值
max: 800,//最大值
position: "left",//Y轴位置左边是left,右边right
axisLine: { //线的样式
lineStyle: {
color: colors[0],
},
},
axisLabel: {//标签的样式
formatter: "{value} 万吨",
},
},上面Y轴样式如下
网上我找到详细Y轴解释
yAxis: [
  {
    show: true, // 是否显示 Y轴
    type: 'value', //('value''category''time''log')
    name: '降雨量(mm)', // 坐标轴名称
    nameLocation: 'end', // 坐标轴名称显示位置。('start''middle''center''end')
    //nameTextStyle: {...}, // 坐标轴名称的文字样式。
    //nameGap: 15, // 坐标轴名称与轴线之间的距离。
    //nameRotate: 0, // 坐标轴名字旋转,角度值。
    //inverse: false, // 是否是反向坐标轴。ECharts 3 中新加。
    //scale: false, // 只在数值轴中(type: 'value')有效。是否是脱离 0 值比例。设置成 true 后坐标刻度不会强制包含零刻度。在双数值轴的散点图中比较有用。在设置 min 和 max 之后该配置项无效。
    splitNumber: 5 , // 坐标轴的分割段数,需要注意的是这个分割段数只是个预估值,最后实际显示的段数会在这个基础上根据分割后坐标轴刻度显示的易读程度作调整。
    minInterval: 0 , // 自动计算的坐标轴最小间隔大小。
    //maxInterval
    //interval  // 强制设置坐标轴分割间隔。
    silent: false , // 坐标轴是否是静态无法交互。
    position: "left", // 默认 grid 中的第一个 y 轴在 grid 的左侧('left'),第二个 y 轴视第一个 y 轴的位置放在另一侧。
    //offset: 0, // Y 轴相对于默认位置的偏移,在相同的 position 上有多个 Y 轴的时候有用。
    //gridIndex: 0 , // y 轴所在的 grid 的索引,默认位于第一个 grid。(一般用于多个Y轴时)
    //max: 5, // 设置最大值,不设置会自动计算
    //min: 0,
    triggerEvent: false , // 坐标轴的标签是否响应和触发鼠标事件,默认不响应。
    axisLine: { // 坐标轴刻度相关设置。
      show: true ,
      alignWithLabel: false ,// 类目轴中在 boundaryGap 为 true 的时候有效,可以保证刻度线和标签对齐。
      interval: 'auto' , // 坐标轴刻度的显示间隔,在类目轴中有效。默认同 axisLabel.interval 一样。
      inside: false , // 坐标轴刻度是否朝内,默认朝外。
      length: 5 , // 坐标轴刻度的长度。
      lineStyle: { // 刻度线的样式设置。
        color: "#ccc", // 刻度线的颜色,默认取 axisTick.lineStyle.color。
        width: 1 ,
        type: 'solid' , // (实线:'solid',虚线:'dashed',星罗棋布的:'dotted')
        shadowColor: 'rgba(0, 0, 0, 0.5)',
        shadowBlur: 10,
        shadowOffsetX: 0 ,
        shadowOffsetY: 0 ,
        opacity: 1
      } ,
    } , // 坐标轴轴线相关设置。
    axisTick: {
      //...(同上)
    } ,
    //minorTick: {} , // 坐标轴次刻度线相关设置。注意:次刻度线无法在类目轴(type: 'category')中使用。
    axisLabel: { // 坐标轴刻度标签的相关设置。
      show: true ,
      interval: 'auto' ,
      inside: false ,
      rotate: 0 ,
      margin: 8 ,
      //formatter ... ,
      //showMinLabel ... ,
      //showMaxLabel ... ,
      //color ... ,
      fontStyle: 'normal' ,
      fontWeight: normal ,
      fontFamily: 'sans-serif' ,
      fontSize: 12 ,
      //align ... ,
      //verticalAlign ... , // 文字垂直对齐方式,默认自动。
      //lineHeight ... ,
      backgroundColor: 'transparent' ,
      borderColor: 'transparent' ,
      borderWidth: 0 ,
      borderRadius: 0 ,
      padding: 0 ,
      shadowColor: 'transparent' ,
      shadowBlur: 0 ,
      shadowOffsetX: 0 ,
      shadowOffsetY: 0 ,
      //width ... ,
      //height ... ,
      textBorderColor: 'transparent' ,
      textBorderWidth: 0 ,
      textShadowColor: 'transparent' ,
      textShadowBlur: 0 ,
      textShadowOffsetX: 0 ,
      textShadowOffsetY: 0 ,
      rich: {  //富文本样式
        //...
      } ,
    } ,
    splitLine: {  // 坐标轴在 grid 区域中的分隔线。
      show: true ,
      interval: 'auto' ,
      lineStyle: {
        //...
      } ,
    } ,
    //minorSplitLine: {} , // 坐标轴在 grid 区域中的次分隔线。次分割线会对齐次刻度线 minorTick
    //splitArea: {} , // 坐标轴在 grid 区域中的分隔区域,默认不显示。
    //data: [{}] , // 类目数据,在类目轴(type: 'category')中有效。 ...
    //axisPointer: {} , //
    zlevel: 0 , // Y 轴所有图形的 zlevel 值。
    z: 0 , // Y 轴组件的所有图形的z值。控制图形的前后顺序。z值小的图形会被z值大的图形覆盖。z相比zlevel优先级更低,而且不会创建新的 Canvas。
  }
]
5、xAxis(X轴)
   xAxis: {
          // type: 'category',
          type: "category",
          axisTick: {
            alignWithLabel: true,
          },
          axisLabel: {
            formatter: "{value}",
            textStyle: {
              color: "#ffffff", //X轴文字颜色
            },
          },
         axisTick: {
            show: false, //隐藏X轴刻度
          },
          axisLine: {
                // show:'true',
                lineStyle: {
                    color: '#fff',//X轴的颜色
                },
            },
          data: [X轴String类型数据,以逗号隔开],
        },
6、series(数据整合输入),type标注echars的线类型,
如果多个Y轴,则需要yAxisIndex,来标注是用的哪个Y轴
{
            name: "若尔盖县碳排放趋势",
            yAxisIndex: 1,
            data: [

            ],
            type: "line",
            itemStyle: {
              normal: {
                barBorderRadius: 2,
              },
            },
以上是关于Echars简单总结的主要内容,如果未能解决你的问题,请参考以下文章