使用open3d和matplotlib可视化三维点云
Posted 沉迷单车的追风少年
tags:
篇首语:本文由小常识网(cha138.com)小编为大家整理,主要介绍了使用open3d和matplotlib可视化三维点云相关的知识,希望对你有一定的参考价值。
目录
1、使用open3d
import numpy as np
import open3d as o3d

# filePath = './GEN_Ours_chair_1631677128/out.npy'
filePath = './GEN_Ours_airplane_1631630214/out.npy'

class VisualPointCloud:
    def __init__(self, filePath):
        self.filePath = filePath

    def array_to_point(self):
        np.set_printoptions(suppress=True)  # 取消默认科学计数法,open3d无法读取科学计数法表示
        loadData = np.load(self.filePath)[:, 0:3].reshape(-1, 3)
        pcd = o3d.geometry.PointCloud()
        pcd.points = o3d.utility.Vector3dVector(loadData)  # numpy.array转换成point cloud
        return pcd

    def draw(self):
        pcd = self.array_to_point()
        o3d.visualization.draw_geometries([pcd])


if __name__ == '__main__':
    visualpointcloud = VisualPointCloud(filePath)
    visualpointcloud.draw()
    exit()
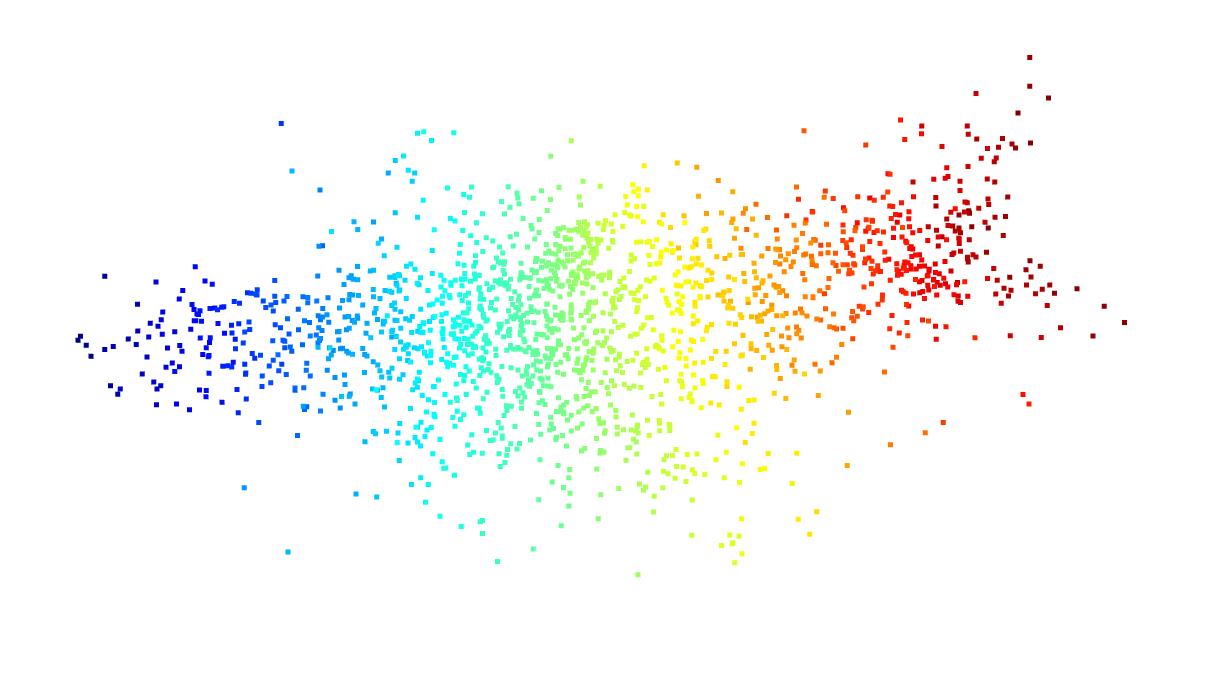
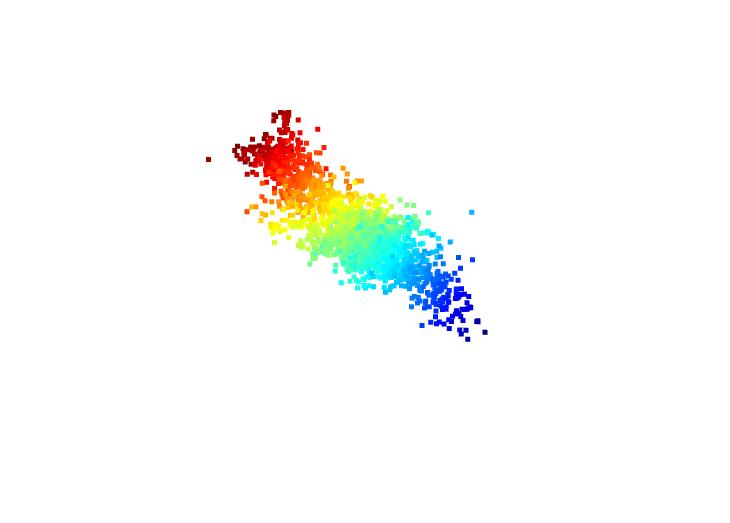
缩小,并增加采样点数量,就能感觉这是一个飞机了!
这是椅子:
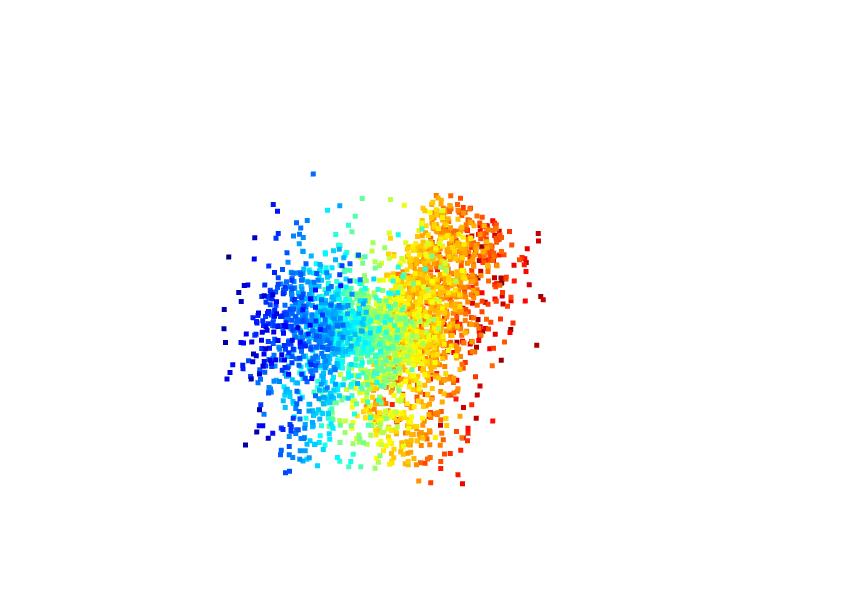
由于都是小样本生成任务,模型可视化起来并不是非常好看
2、使用matplotlib
# 使用matplotlib可视化
import numpy as np
import argparse
import matplotlib.pyplot as plt


if __name__ == '__main__':
    parser = argparse.ArgumentParser()
    # filePath = './GEN_Ours_chair_1631677128/out.npy'
    filePath = './GEN_Ours_airplane_1631630214/out.npy'
    # filePath = './data/3.xyz'
    points = np.load(filePath)  # (n, 3)
    # points = np.loadtxt(filePath)
    fig = plt.figure()
    ax = fig.gca(projection='3d')

    ax.scatter(points[:, 0], points[:, 1], points[:, 2], c='y')
    print(points.shape)
    print(points[:, 0].shape, points[:, 1].shape, points[:, 2].shape)
    print(points)
    # plt.savefig("matplotlib.png")
    plt.show()
    exit()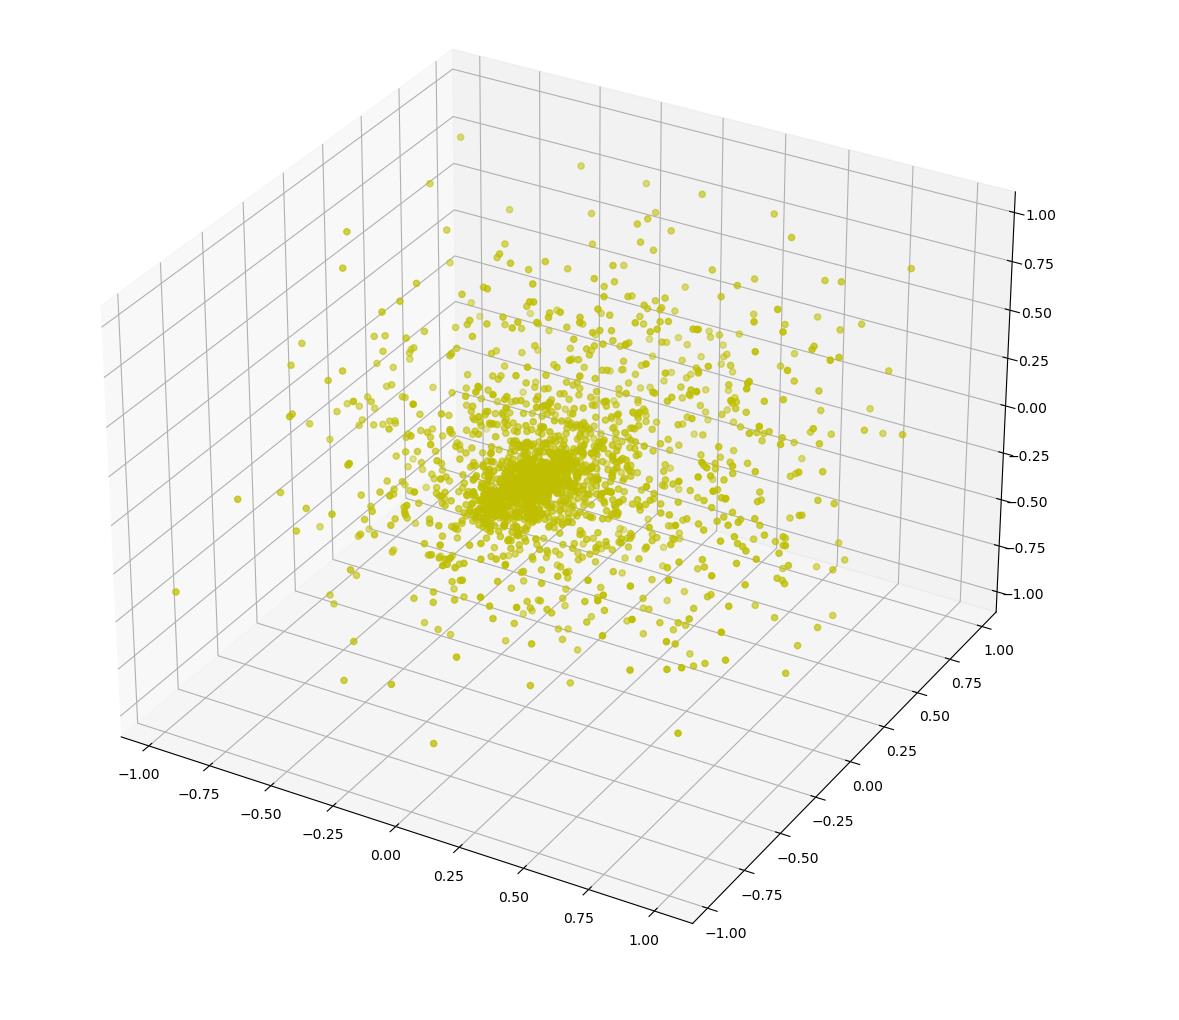
以上是关于使用open3d和matplotlib可视化三维点云的主要内容,如果未能解决你的问题,请参考以下文章