Prometheus实验部署
Posted 水木,年華
tags:
篇首语:本文由小常识网(cha138.com)小编为大家整理,主要介绍了Prometheus实验部署相关的知识,希望对你有一定的参考价值。
Prometheus部署实验服务器分配
主机名             地址                   安装包
prometheus 192.168.80.1    prometheus-2.27.1.linux-amd64.tar.gz
server1    192.168.80.2    node_exporter-1.1.2.linux-amd64.tar.gz
server2    192.168.80.3
server3    192.168.80.4
1.做时间同步
ntpdate ntp1.aliyun.com
2.解压
[root@prometheus ~]# tar zxf prometheus-2.27.1.linux-amd64.tar.gz -C /usr/local/
3.运行查看端口
[root@prometheus ~]# /usr/local/prometheus-2.27.1.linux-amd64/prometheus
[root@prometheus ~]# ss -antp | grep 9090   #在另一个终端打开查看

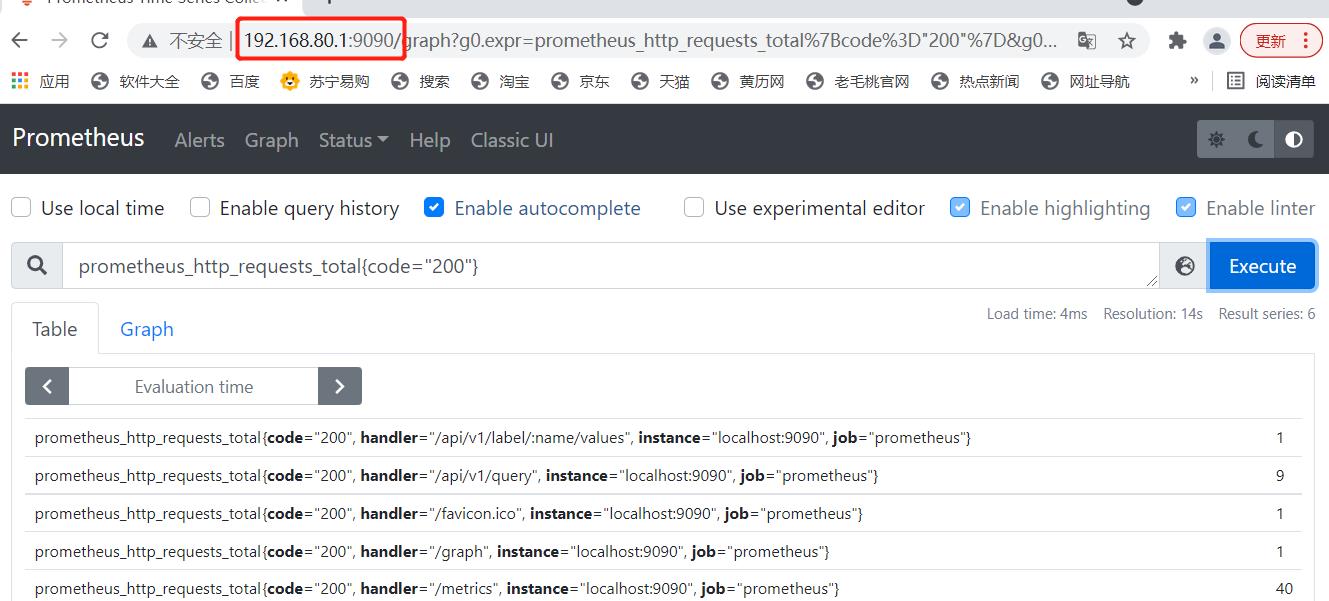
4.访问web页面(表达式浏览器)
192.168.80.1:9090
(五)部署监控其他节点
prometheus想要监控其他节点,则需要借助node_exporter,下载地址http://prometheus.io/download/
腾讯云盘prometheus安装包
[root@node1 ~]# tar zxf node_exporter-1.1.2.linux-amd64.tar.gz  -C /opt
[root@node1 ~]# cd /opt/node_exporter-1.1.2.linux-amd64/
[root@node1 node_exporter-1.1.2.linux-amd64]# ls
LICENSE  node_exporter  NOTICE
[root@node1 node_exporter-1.1.2.linux-amd64]# cp node_exporter  /usr/local/bin/
[root@node1 node_exporter-1.1.2.linux-amd64]# ./node_exporter
修改prometheus配置文件
[root@prometheus ~]# vim /usr/local/prometheus-2.27.1.linux-amd64/prometheus.yml
重启
[root@prometheus prometheus-2.27.1.linux-amd64]# ./prometheus
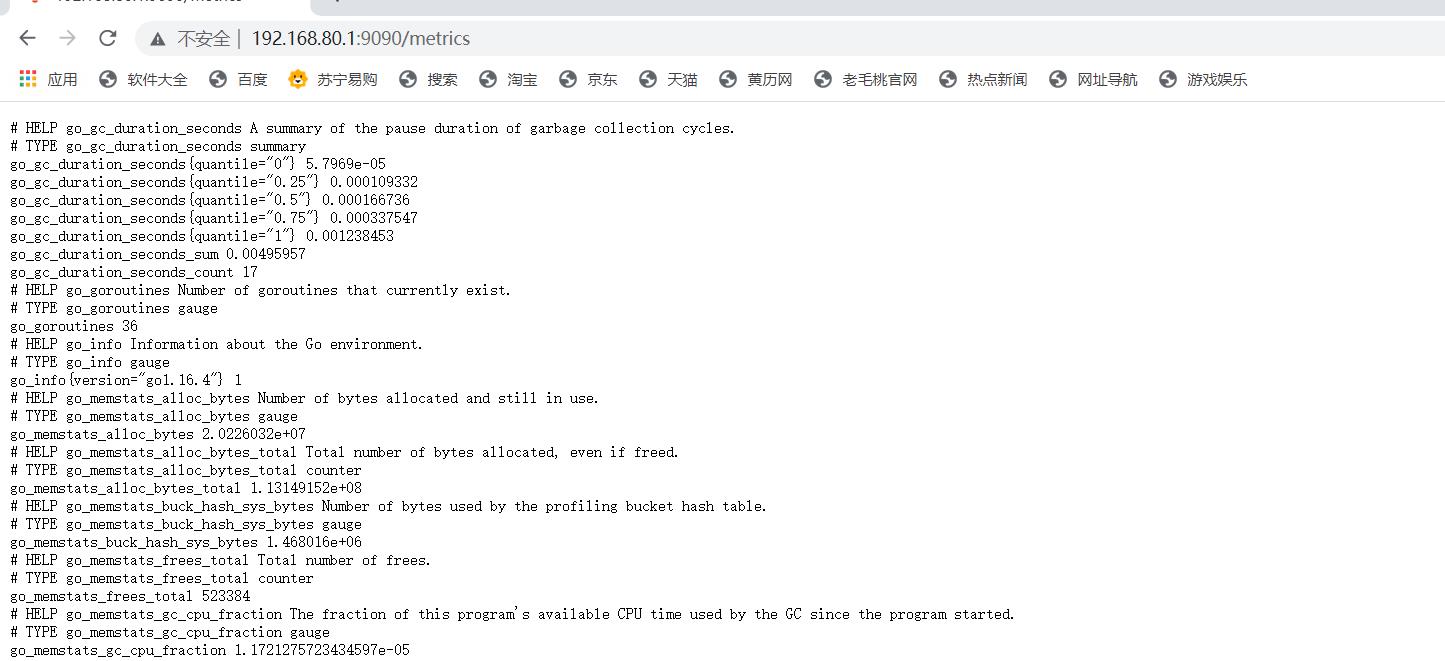
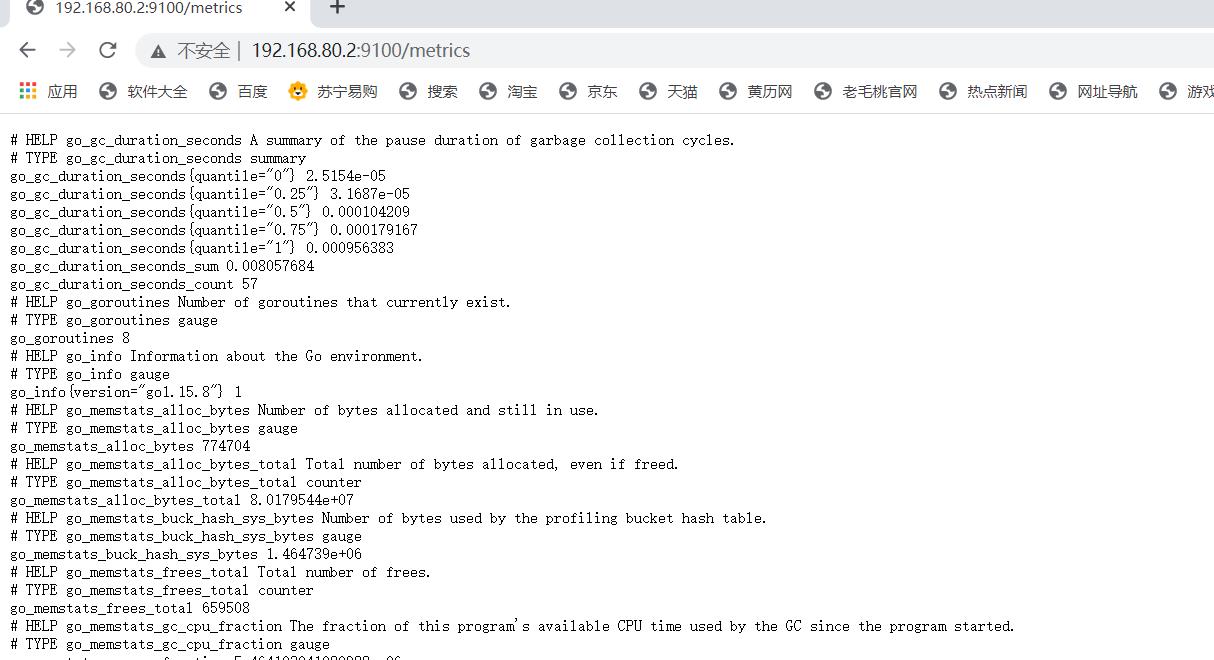
查看node1上的指标数据
(六)表达式浏览器(promQL过滤使用)
1.表达式浏览器常规使用
在prometheusUI控制台上可以进行数据过滤
简单的用法:
#CPU使用总量
node_cpu_seconds_total
计算过去5分钟内的CPU使用速率
PromQL: irate(node_cpu_seconds_total{cpu="0",mode="idle"}[5m])
解析:
irate:速率计算函数(灵敏度非常高)
node_cpu_seconds_total:node节点CPU使用总量(指标)
modd="idle"空闲指标
5m:过去的5分钟内,所有CPU空闲数的样本值,每个数值做速率运算
{ mode=“idle”}:整体称为标签过滤器
每台主机CPU在5分钟内的平均使用率
PromQI:(1-avg(irate(node_cpu_seconds_total{cpu="0",mode="idle"}[5m]))by(instance))*100
解析
avg:平均值
avg (irate (node_cpu_seconds_total{fmode=‘idle’ } [5m]):可以理解为CPU空闲量的百分比
by (instance):表示的是所有节点
(1- avg (irate(node_cpu_seconds_total{(mode='idle'[5m]) )by(instance))* 100:CPU 5分钟内的平均使用率
其他常用的指标:
1、查询1分钟平均负载
node_load1 > on (instance) 2 * count (node_cpu_seconds_total{mode='idle'})by (instance)
node_load5
node_load15
1、5、15分钟的cpu负载
一般来说以上的值不能长时间大于CPU核心数量
2、内存使用率
node_memory_MemTotal_bytes
node_memory_MemFree_bytes
node_memory_Buffers_bytes
node_memory_Cached_ bytes
计算使用率:
可用空间:以上后三个指标之和
己用空间:总空间减去可用空间
使用率:己用空间除以总空间
部署service discovery服务发现
(一)相关概念
1、Prometheus指标抓取的生命周期
                  隐藏敏感数据                    整合多个标签,来进行单个自定义指标数据的输出
发现 -> 配置 -> relabel(重打标签)-> 指标数据抓取 -> metrics relabel
Prometheus的服务发现(基于文件、DNS、consul、k8s等各种主流的服务发现总线)
①基于文件的服务发现;
(定义一组资源"子"配置文件yaml格式 里面只存方需要采集的targets 信息,此种方式可以被pro动态获取到,而不需要重启)
②基于DNS的服务发现;
③基于API的服务发现:Kubernetes、Consul、Azure、重新标记
target重新打标
metric重新打标
④基于K8s的服务发现
2、prometheus 服务发现机制
①Prometheus Server的数据抓取工作于Pull模型,因而,它必需要事先知道各Target的位置,然后才能从相应的Exporter或Instrumentation中抓取数据
②对于小型的系统环境来说,通过static_dpnfigs指定各Target便能解决问题,这也是最简单的配置方法;每个Targets用一个网络端点(ip:port)进行标识;
③对于中大型的系统环境或具有较强动态性的云计算环境来说,静态配置显然难以适用;
因此,Prometheus为此专门设计了一组服务发现机制,以便于能够基于服务注册中心(服务总线)自动发现、检测、分类可被监控的各Target,以及更新发生了变动的Target指标抓取的生命周期
④在每个scrape_interval期间,Prometheus都会检查执行的作业(Job);这些作业首先会根据
Job上指定的发现配置生成target列表,此即服务发现过程;服务发现会返回一个Target列表,其中包含一组称为元数据的标签,这些标签都以" meta_"为前缀;
⑤服务发现还会根据目标配置来设置其它标签,这些标签带有"“前缀和后缀,b包括"scheme”、 " address"和" metrics path_",分别保存有target支持使用协议(http或https,默认为http) 、 target的地址及指标的URI路径(默认为/metrics) ;
⑥若URI路径中存在任何参数,则它们的前缀会设置为" param"这些目标列表和标签会返回给Prometheus,其中的一些标签也可以配置中被覆盖;
⑦配置标签会在抓取的生命周期中被重复利用以生成其他标签,例如,指标上的instance标签的默认值就来自于address标签的值;
⑧对于发现的各目标,Prometheus提供了可以重新标记(relabel)目标的机会,它定义在job配置段的relabel_config配置中,常用于实现如下功能
将来自服务发现的元数据标签中的信息附加到指标的标签上
过滤目标:
#之后便是数据抓取,以及指标返回的过程,抓取而来的指标在保存之前,还允许用户对指标重新打标过滤的方式
#它定义在job配置段的metric_relabel_configs配置中,常用于实现如下功能#册删除不必要的指标
#从指标中册删除敏感或者不需要的标签
#添加、编辑或者修改指标的标签值或标签格式
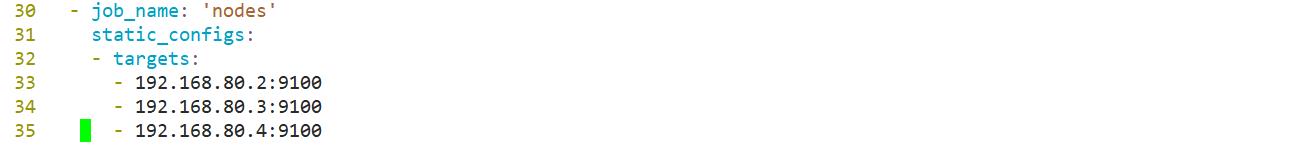
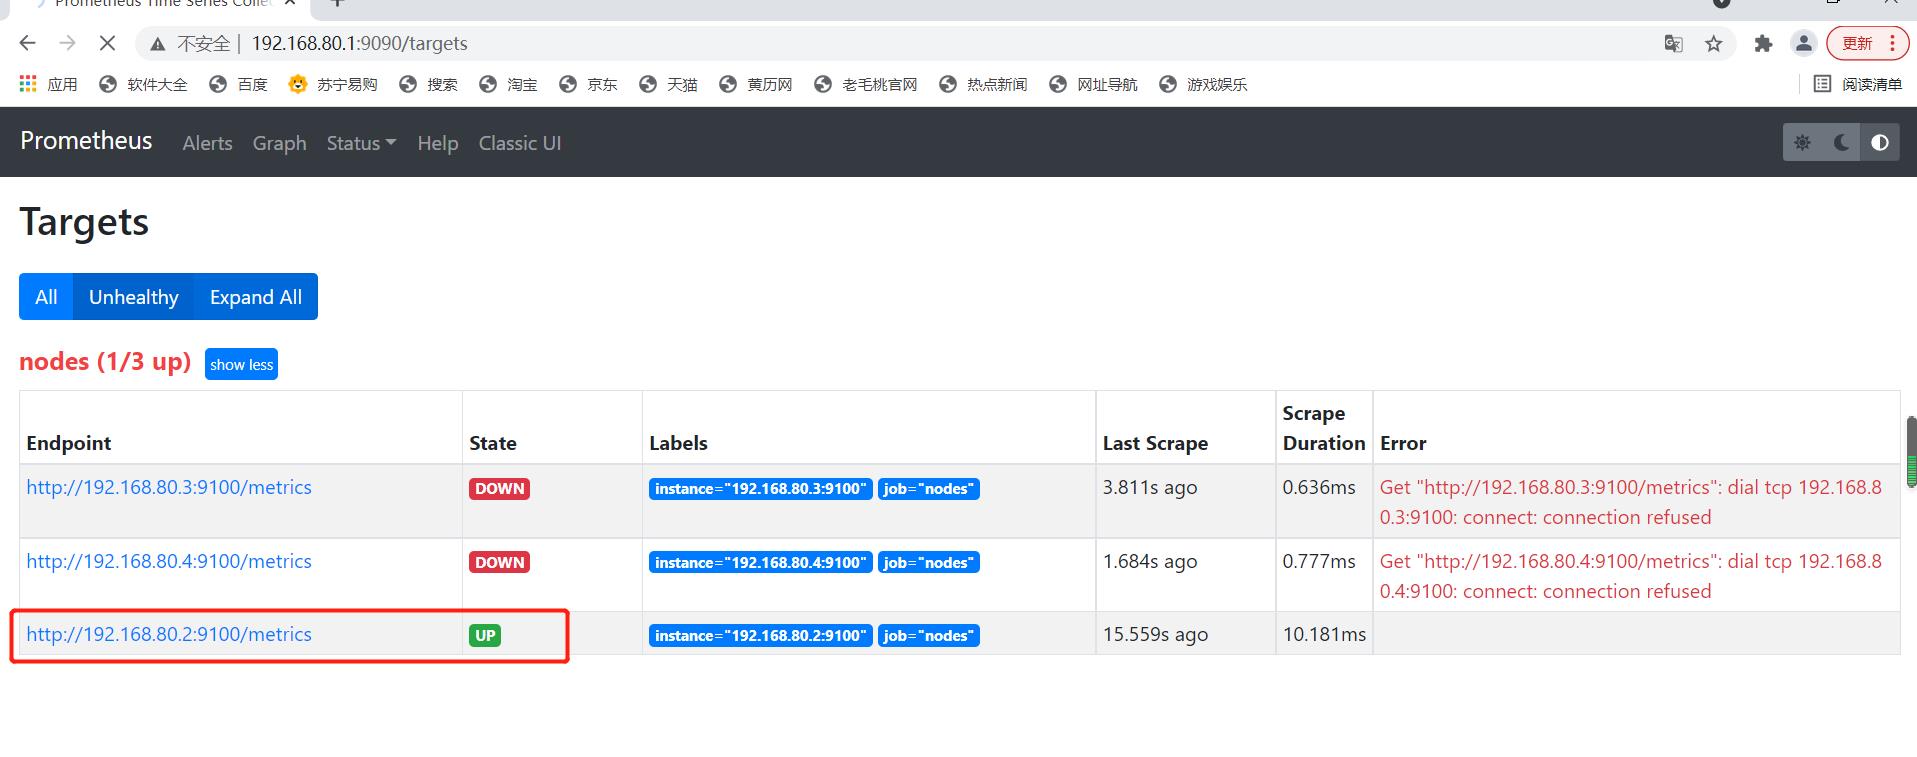
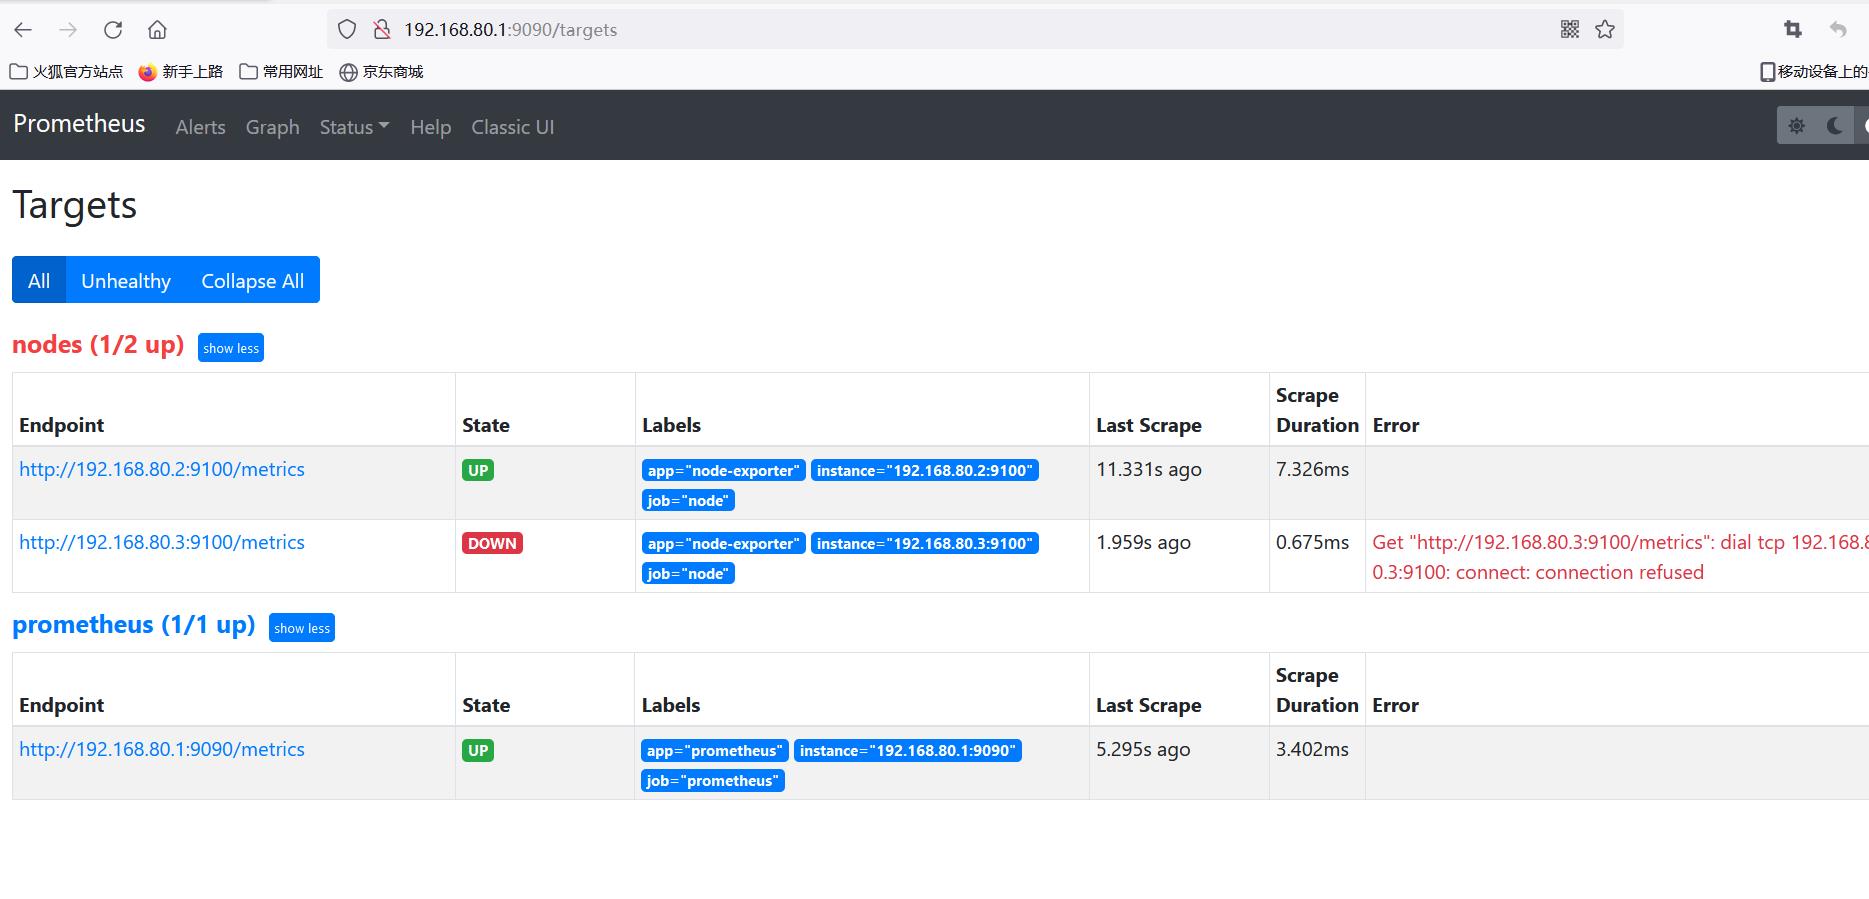
(二)静态配置发现
修改prometheus服务器上的配置为文件,指定targets的端口上面配置过
- job_name: 'nodes'
  static_config:
  - targets:
    -192.168.80.2:9100
    -192.168.80.3:9100
    -192.168.80.4:9100
(三)动态发现
1.基于文件服务发现
192.168.80.1
基于文件的服务发现仅仅略优于静态配置的服务发现方式,它不依赖于任何平台或第三方服务,因而也是最为简单和通用的实现方式。prometheus server定期从文件中加载target信息(pro-server pull指标发现机制-job_name
获取我要pul1的对象target)文件可以只用json和yaml格式,它含有定义的target列表,以及可选的标签信息,以下第一配置,能够将prometheus默认的静态配置转换为基于文件的服务发现时所需的配置;(rometheus会周期性的读取、重载此文件中的配置,从而达到动态发现、更新的操作)

[root@prometheus files_sd]# cat prometheus.yml
# my global config
# Author: MageEdu <mage@magedu.com>
# Repo: http://gitlab.magedu.com/MageEdu/prometheus-configs/
global:
  scrape_interval:     15s # Set the scrape interval to every 15 seconds. Default is every 1 minute.
  evaluation_interval: 15s # Evaluate rules every 15 seconds. The default is every 1 minute.
  # scrape_timeout is set to the global default (10s).

# Alertmanager configuration
alerting:
  alertmanagers:
  - static_configs:
    - targets:
      # - alertmanager:9093

# Load rules once and periodically evaluate them according to the global 'evaluation_interval'.
rule_files:
  # - "first_rules.yml"
  # - "second_rules.yml"

# A scrape configuration containing exactly one endpoint to scrape:
# Here it's Prometheus itself.
scrape_configs:
  # The job name is added as a label `job=<job_name>` to any timeseries scraped from this config.
  - job_name: 'prometheus'

    # metrics_path defaults to '/metrics'
    # scheme defaults to 'http'.

    file_sd_configs:
    - files:
      - targets/prometheus_*.yaml
      refresh_interval: 2m

  # All nodes
  - job_name: 'nodes'
    file_sd_configs:
    - files:
      - targets/nodes_*.yaml
      refresh_interval: 2m
[root@prometheus targets]# cat nodes_centos.yaml
- targets:
  - 192.168.80.2:9100
  - 192.168.80.3:9100
  labels:
    app: node-exporter
    job: node
[root@prometheus targets]# cat prometheus_server.yaml
- targets:
  - 192.168.80.1:9090
  labels:
    app: prometheus
    job:  prometheus
指定yml文件启动
[root@prometheus prometheus-2.27.1.linux-amd64]# ./prometheus --config.file=./files_sd/prometheus.yml
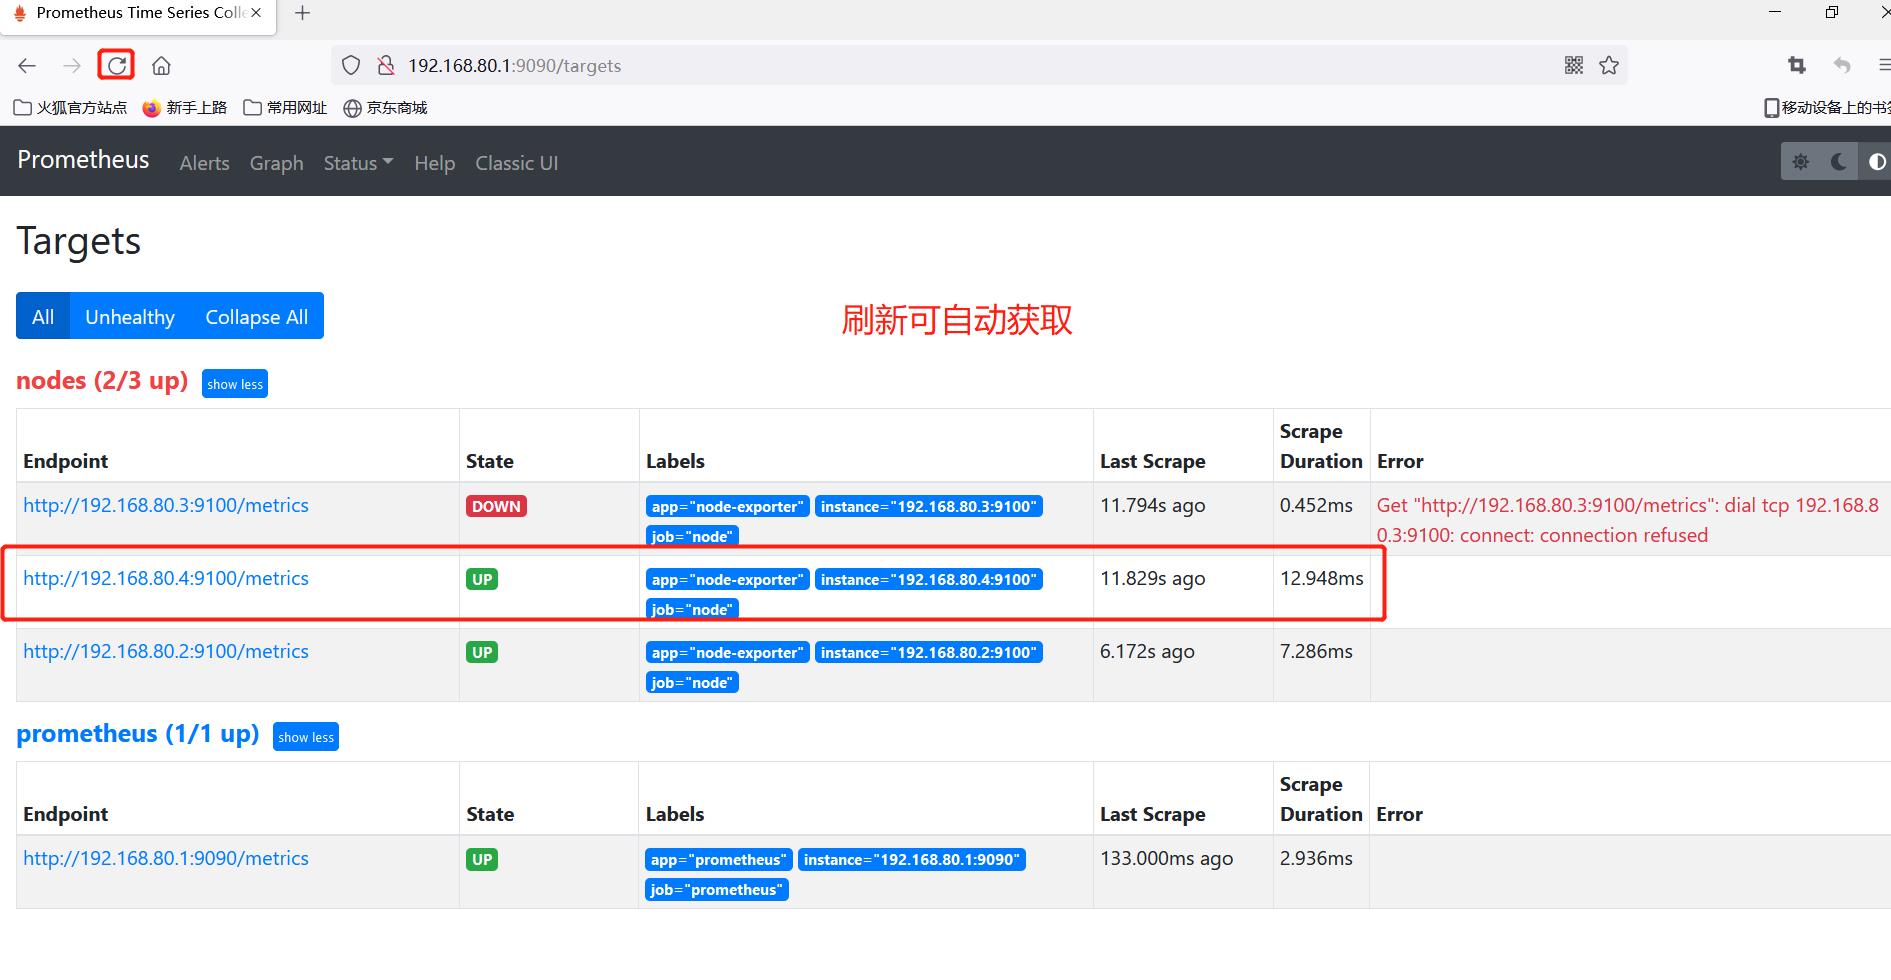
添加192.168.80.4节点
192.168.80.4 node3启动exporter
[root@node3 ~]# tar zxf node_exporter-1.1.2.linux-amd64.tar.gz  -C /opt
[root@node3 ~]# tar zxf node_exporter-1.1.2.linux-amd64.tar.gz  -C /opt
[root@node3 ~]#  cd /opt/node_exporter-1.1.2.linux-amd64/
[root@node3 node_exporter-1.1.2.linux-amd64]# cp node_exporter  /usr/local/bin/
[root@node3 node_exporter-1.1.2.linux-amd64]# ./node_exporter
nodes_centos.yaml 文件添加节点
[root@prometheus targets]# vim nodes_centos.yaml
以上是关于Prometheus实验部署的主要内容,如果未能解决你的问题,请参考以下文章