python networkx绘制图
Posted 程序媛一枚~
tags:
篇首语:本文由小常识网(cha138.com)小编为大家整理,主要介绍了python networkx绘制图相关的知识,希望对你有一定的参考价值。
这篇博客将介绍如何使用python,networkx绘制图。
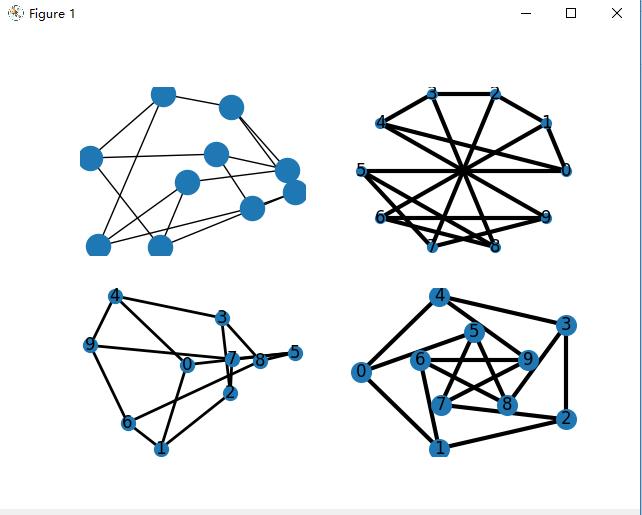
1. 效果图
可调整点的大小,点是否有label,点的颜色
无label VS 点=50 VS 点=100 VS 点=200效果图如下:

2. 安装
pip install networkx
3. 源码
# networkx绘制点图
import matplotlib.pyplot as plt
import networkx as nx

options = {
    # 'node_color': 'black', # 节点颜色
    'node_size': 50,  # 每个节点大小
    'width': 3,  # 线的宽度
}

options1 = {
    'node_size': 100,  # 每个节点大小
    'width': 2,  # 线的宽度
}

options2 = {
    'node_size': 200,
    'width': 3,
}

G = nx.petersen_graph()
subax1 = plt.subplot(221)
nx.draw_random(G)
subax2 = plt.subplot(222)
nx.draw_circular(G, with_labels=True, **options)
subax3 = plt.subplot(223)
nx.draw_spectral(G, with_labels=True, **options1)
subax4 = plt.subplot(224)
nx.draw_shell(G, with_labels=True, nlist=[range(5, 10), range(5)], **options2)
plt.show()
参考
以上是关于python networkx绘制图的主要内容,如果未能解决你的问题,请参考以下文章