Prometheus 采集rabbitmq监控数据
Posted CIAS
tags:
篇首语:本文由小常识网(cha138.com)小编为大家整理,主要介绍了Prometheus 采集rabbitmq监控数据相关的知识,希望对你有一定的参考价值。


Prometheus采集主机监控参考部署下载,图形生成
| 系统 | exporter 安装参考 | Grafana | download |
| Windows | 参考 | 图形生成参考 | win_exporter |
| Linux | 参考 | node_exporter | |
| mysql | 参考 | Mysql_exporter | |
| SQL Server | 参考 | SQL exporter | |
| Redis | 参考 | Redis_exporter | |
| cadvisor | 参考 | cadvisor | |
| rabbitmq | 参考 | 参考 | rabbitmq |
| snmp_exporter | 参考 | 图形展示在测试中 | |
| zabbix | 集成参考 | ||
download rabbitmq_exporter
rabbitmq_exporter 一键监控安装脚本
- 采集端口默认端口9419
16-41 行说明
| Environment | variable | default description |
|---|---|---|
| RABBIT_URL | http://127.0.0.1:15672 | url to rabbitMQ management plugin (must start with http(s)😕/) |
| RABBIT_USER | guest | username for rabbitMQ management plugin. User needs monitoring tag! |
| RABBIT_PASSWORD | guest | password for rabbitMQ management plugin |
| RABBIT_USER_FILE | location of file with username (useful for docker secrets) | |
| RABBIT_PASSWORD_FILE | location of file with password (useful for docker secrets) | |
| PUBLISH_PORT | 9419 | Listening port for the exporter |
| PUBLISH_ADDR | “” | Listening host/IP for the exporter |
| OUTPUT_FORMAT | TTY | Log ouput format. TTY and JSON are suported |
| LOG_LEVEL | info | log level. possible values: “debug”, “info”, “warning”, “error”, “fatal”, or “panic” |
| CAFILE | ca.pem | path to root certificate for access management plugin. Just needed if self signed certificate is used. Will be ignored if the file does not exist |
| CERTFILE | client-cert.pem | path to client certificate used to verify the exporter’s authenticity. Will be ignored if the file does not exist |
| KEYFILE | client-key.pem | path to private key used with certificate to verify the exporter’s authenticity. Will be ignored if the file does not exist |
| SKIPVERIFY | false | true/0 will ignore certificate errors of the management plugin |
| SKIP_VHOST | ^$ | regex, matching vhost names are not exported. First performs INCLUDE_VHOST, then SKIP_VHOST |
| INCLUDE_VHOST | .* | regex vhost filter. Only queues in matching vhosts are exported |
| INCLUDE_QUEUES | .* | regex queue filter. Just matching names are exported |
| SKIP_QUEUES | ^$ | regex, matching queue names are not exported (useful for short-lived rpc queues). First performed INCLUDE, after SKIP |
| RABBIT_CAPABILITIES | bert,no_sort | comma-separated list of extended scraping capabilities supported by the target RabbitMQ server |
| RABBIT_EXPORTERS | exchange,node,queue | List of enabled modules. Possible modules: connections,shovel,federation,exchange,node,queue,memory |
| RABBIT_TIMEOUT | 30 | timeout in seconds for retrieving data from management plugin. |
| MAX_QUEUES | 0 | max number of queues before we drop metrics (disabled if set to 0) |
| EXCLUDE_METRICS |
|
vim /rabbitmq_exporter.sh#!/bin/sh
# -*- coding: utf-8 -*-
# Date: 2022/11/29
echo "download rabbitmq_exporter"
sleep 2
wget -N -P /root/ https://github.com/kbudde/rabbitmq_exporter/releases/download/v1.0.0-RC19/rabbitmq_exporter_1.0.0-RC19_linux_amd64.tar.gz
echo "Unzip rabbitmq_exporter"
sleep 2
mkdir -p /usr/local/rabbitmq_exporter
tar -zxf /root/rabbitmq_exporter_1.0.0-RC19_linux_amd64.tar.gz -C /usr/local/rabbitmq_exporter
echo "add config.json"
sleep 2
cat >>/usr/local/rabbitmq_exporter/config.json << EOF
"rabbit_url": "http://127.0.0.1:15672",
"rabbit_user": "admin",
"rabbit_pass": "admin@123",
"publish_port": "9419",
"publish_addr": "",
"output_format": "TTY",
"ca_file": "ca.pem",
"cert_file": "client-cert.pem",
"key_file": "client-key.pem",
"insecure_skip_verify": false,
"exlude_metrics": [],
"include_queues": ".*",
"skip_queues": "^$",
"skip_vhost": "^$",
"include_vhost": ".*",
"rabbit_capabilities": "no_sort,bert",
"enabled_exporters": [
"exchange",
"node",
"overview",
"queue"
],
"timeout": 30,
"max_queues": 0
EOF
echo "rabbitmq_exporter Creating a Service Script"
sleep 2
cat >>/usr/lib/systemd/system/rabbitmq_exporter.service<< EOF
[Unit]
Description=rabbitmq_exporter
Documentation=https://github.com/kbudde/rabbitmq_exporter/releases
After=network.target
[Service]
Type=simple
User=root
Group=root
ExecStart=/usr/local/rabbitmq_exporter/rabbitmq_exporter \\
-config-file=/usr/local/rabbitmq_exporter/config.json
ExecReload=/bin/kill -s HUP $MAINPID
ExecStop=/bin/kill -s QUIT $MAINPID
Restart=on-failure
[Install]
WantedBy=multi-user.target
EOF
echo "rabbitmq_exporter Example Set the automatic startup service"
sleep 2
systemctl daemon-reload && systemctl enable --now rabbitmq_exporter
rm -rf /root/rabbitmq_exporter_1.0.0-RC19_linux_amd64.tar.gz执行安装
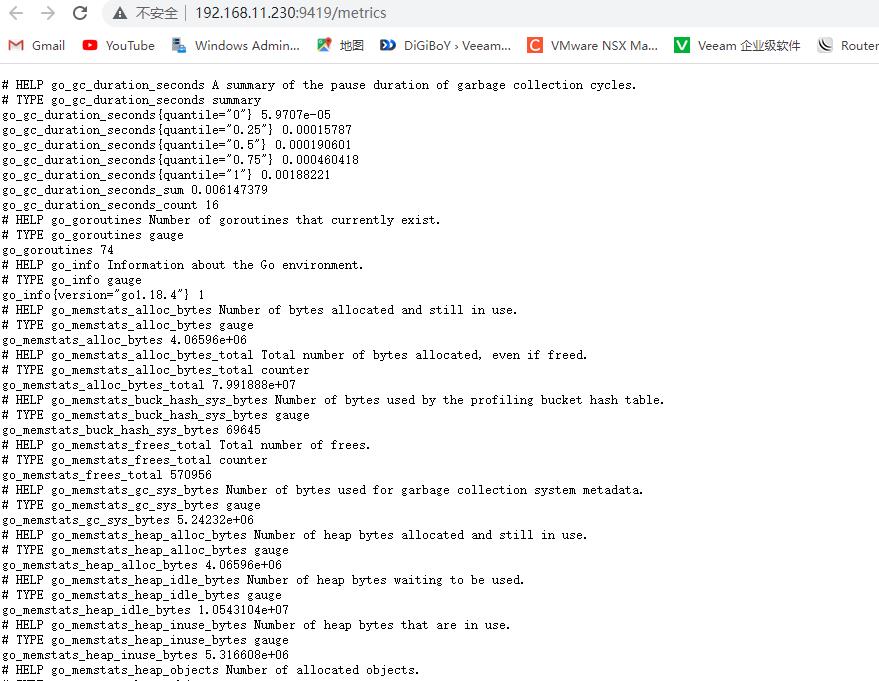
sh /rabbitmq_exporter.sh数据采集结果

Prometheus代码设置
  - job_name: 'Rabbitmq'
    scrape_interval: 5s
    static_configs:
      - targets:
        - 192.168.11.230:9419
        labels:
          instance: RabbitMQ-192.168.11.230
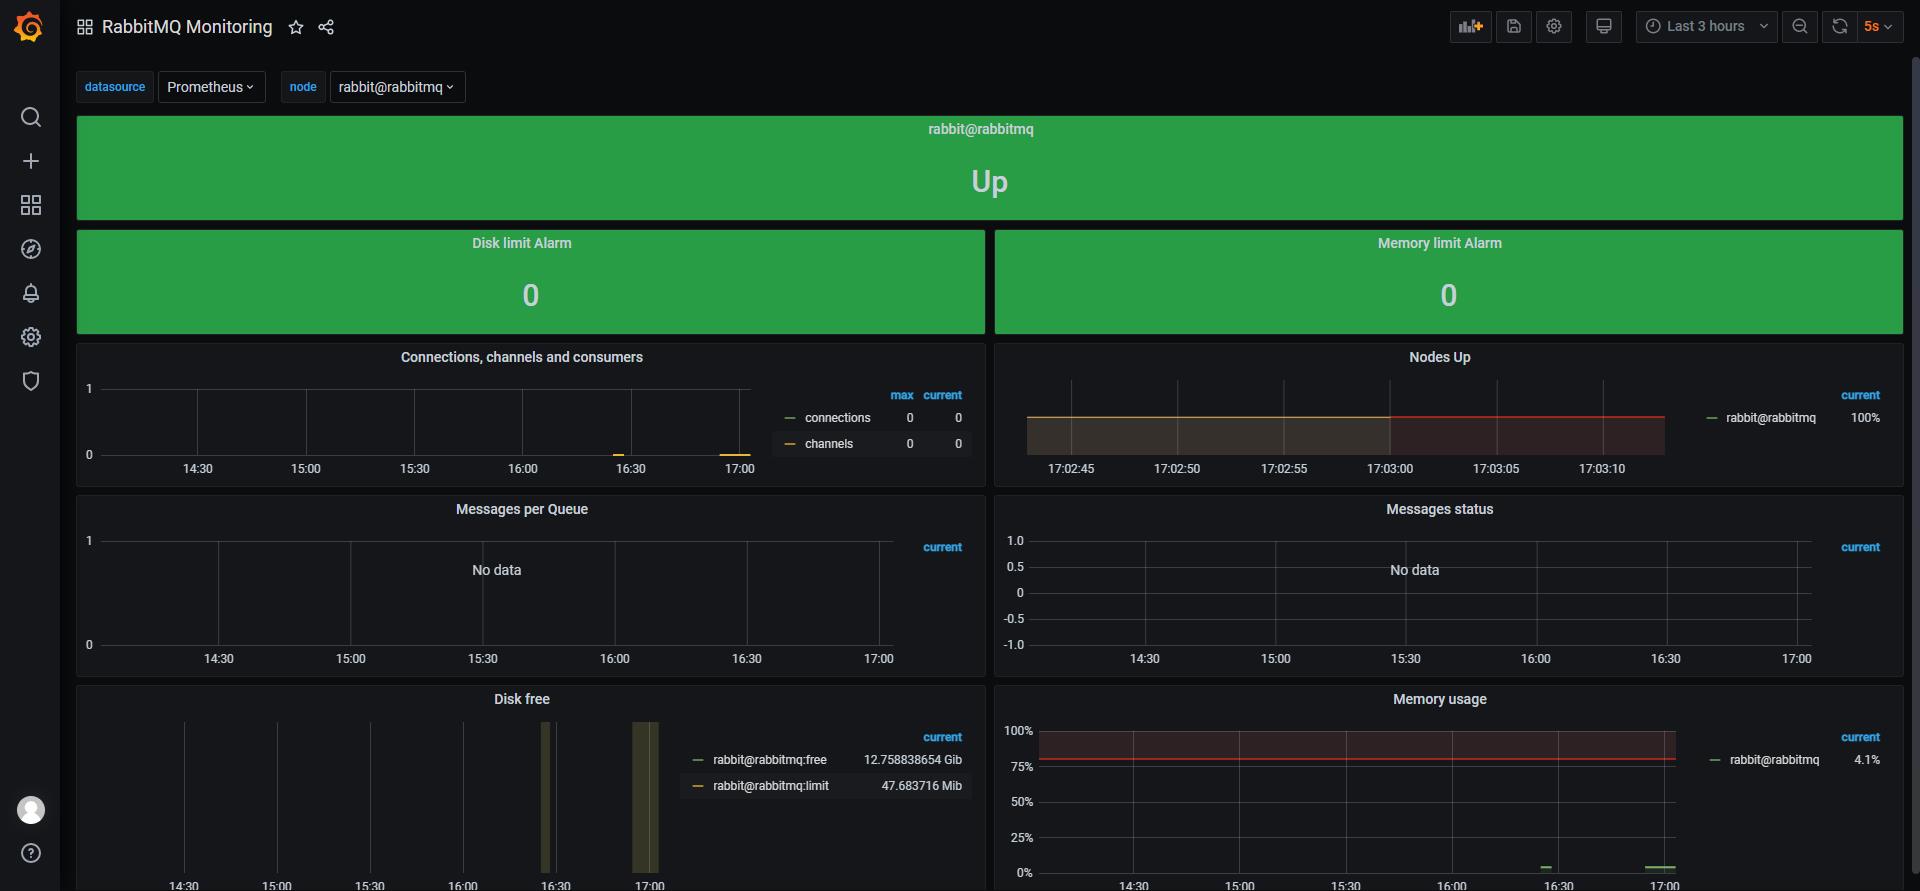
Grafana 图形展示
- 模板号集群10991,14798,11340(以下三项都是用于集群)
- RabbitMQ-Overview
- RabbitMQ-Quorum-Queues-Raft
- RabbitMQ-Stream
单机图形展示
- 4279 模板号单机 RabbitMQ Monitoring

以上是关于Prometheus 采集rabbitmq监控数据的主要内容,如果未能解决你的问题,请参考以下文章