Prometheus Install
Posted CIAS
tags:
篇首语:本文由小常识网(cha138.com)小编为大家整理,主要介绍了Prometheus Install相关的知识,希望对你有一定的参考价值。

前言
Prometheus是一个开源的系统监控和报警系统,现在已经加入到CNCF基金会,成为继k8s之后第二个在CNCF托管的项目,在kubernetes容器管理系统中,通常会搭配prometheus进行监控,同时也支持多种exporter采集数据,还支持pushgateway进行数据上报,Prometheus性能足够支撑上万台规模的集群。
Prometheus采集主机监控参考部署下载,图形生成
- 模板打包下载
| 系统 | exporter 安装参考 | Grafana | download |
| Windows | 参考 | 图形生成参考 | win_exporter |
| Linux | 参考 | node_exporter | |
| mysql | 参考 | Mysql_exporter | |
| SQL Server | 参考 | SQL exporter | |
| Redis | 参考 | Redis_exporter | |
| cadvisor | 参考 | cadvisor | |
| rabbitmq | 参考 | 参考 | rabbitmq |
| snmp_exporter | 参考 | 图形展示在测试中 | |
| zabbix | 集成参考 | ||
Prometheus 一键安装Linux平台
- 配置文件位置/usr/local/prometheus-2.37.2.linux-amd64/prometheus.yml
- Prometheus版本定义建议选择LTS长期支持版本
vim /Prometheus.sh#!/bin/sh
# -*- coding: utf-8 -*-
# Date: 2022/11/17
echo "download prometheus"
sleep 2
wget -N -P /root/ https://github.com/prometheus/prometheus/releases/download/v2.37.2/prometheus-2.37.2.linux-amd64.tar.gz
echo "decompression prometheus"
sleep 2
tar -zxf /root/prometheus-2.37.2.linux-amd64.tar.gz -C /usr/local/
echo "prometheus Start Service"
sleep 2
cat >>/usr/lib/systemd/system/prometheus.service<<EOF
[Unit]
Description=prometheus
After=network.target
[Service]
Type=simple
User=root
ExecStart=/usr/local/prometheus-2.37.2.linux-amd64/prometheus \\
--config.file=/usr/local/prometheus-2.37.2.linux-amd64/prometheus.yml \\
--storage.tsdb.path=/var/lib/prometheus/ \\
ExecReload=/bin/kill -HUP $MAINPID
Restart=on-failure
[Install]
WantedBy=multi-user.target
EOF
echo "prometheus Example Set the automatic startup service"
sleep 2
systemctl daemon-reload && systemctl enable --now prometheus执行一键安装
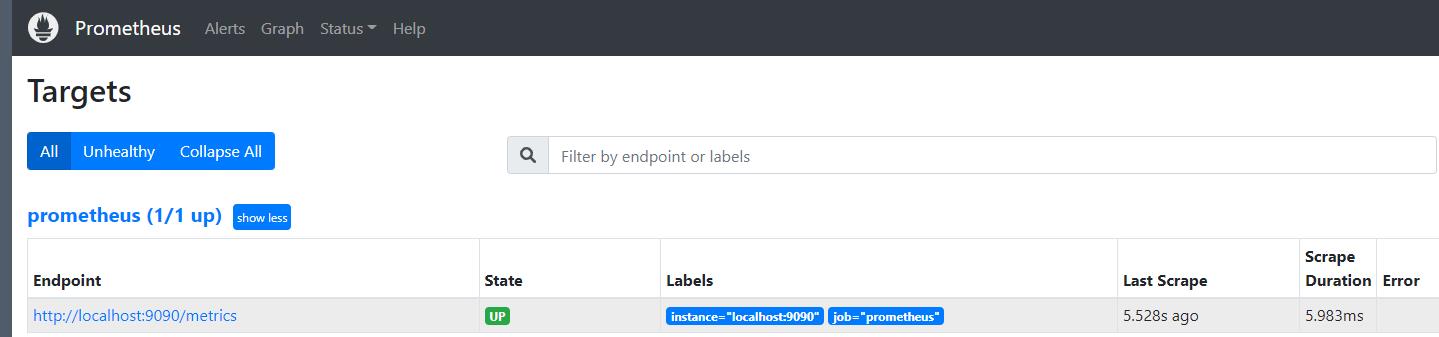
sh /Prometheus.sh进入prometheus http://192.168.11.230:9090/
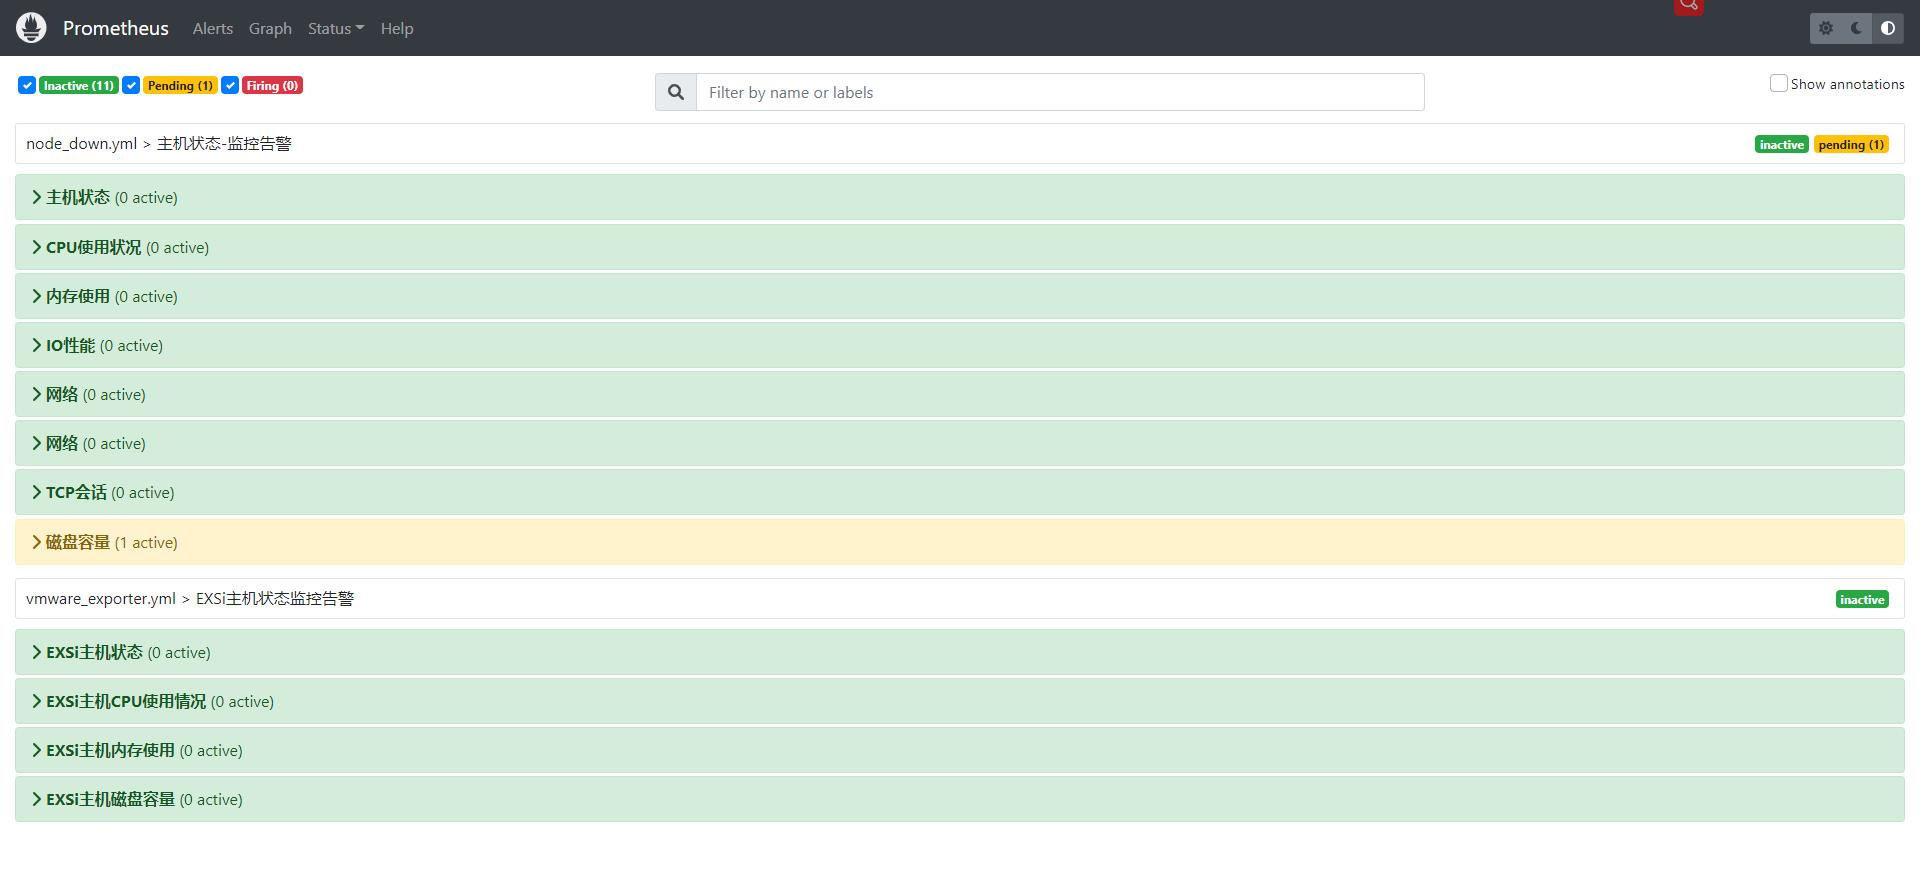
添加主机报警规则
vim /usr/local/prometheus-2.37.2.linux-amd64/node_down.ymlgroups:
- name: 主机状态-监控告警
rules:
- alert: 主机状态
expr: up == 0
for: 1m
labels:
status: 很是严重
annotations:
summary: "$labels.instance:服务器宕机"
description: "$labels.instance:服务器延时超过5分钟"
- alert: CPU使用状况
expr: 100-(avg(irate(node_cpu_seconds_totalmode="idle"[5m])) by(instance)* 100) > 60
for: 1m
labels:
status: 通常告警
annotations:
summary: "$labels.mountpoint CPU使用率太高!"
description: "$labels.mountpoint CPU使用大于60%(目前使用:$value%)"
- alert: 内存使用
expr: 100 -(node_memory_MemTotal_bytes -node_memory_MemFree_bytes+node_memory_Buffers_bytes+node_memory_Cached_bytes ) / node_memory_MemTotal_bytes * 100> 80
for: 1m
labels:
status: 严重告警
annotations:
summary: "$labels.mountpoint 内存使用率太高!"
description: "$labels.mountpoint 内存使用大于80%(目前使用:$value%)"
- alert: IO性能
expr: 100-(avg(irate(node_disk_io_time_seconds_total[1m])) by(instance)* 100) < 60
for: 1m
labels:
status: 严重告警
annotations:
summary: "$labels.mountpoint 流入磁盘IO使用率太高!"
description: "$labels.mountpoint 流入磁盘IO大于60%(目前使用:$value)"
- alert: 网络
expr: ((sum(rate (node_network_receive_bytes_totaldevice!~'tap.*|veth.*|br.*|docker.*|virbr*|lo*'[5m])) by (instance)) / 100) > 102400
for: 1m
labels:
status: 严重告警
annotations:
summary: "$labels.mountpoint 流入网络带宽太高!"
description: "$labels.mountpoint 流入网络带宽持续2分钟高于100M. RX带宽使用率$value"
- alert: 网络
expr: ((sum(rate (node_network_transmit_bytes_totaldevice!~'tap.*|veth.*|br.*|docker.*|virbr*|lo*'[5m])) by (instance)) / 100) > 102400
for: 1m
labels:
status: 严重告警
annotations:
summary: "$labels.mountpoint 流出网络带宽太高!"
description: "$labels.mountpoint 流出网络带宽持续2分钟高于100M. RX带宽使用率$value"
- alert: TCP会话
expr: node_netstat_Tcp_CurrEstab > 1000
for: 1m
labels:
status: 严重告警
annotations:
summary: "$labels.mountpoint TCP_ESTABLISHED太高!"
description: "$labels.mountpoint TCP_ESTABLISHED大于1000%(目前使用:$value%)"
- alert: 磁盘容量
expr: 100-(node_filesystem_free_bytesfstype=~"ext4|xfs"/node_filesystem_size_bytes fstype=~"ext4|xfs"*100) > 80
for: 1m
labels:
status: 严重告警
annotations:
summary: "$labels.mountpoint 磁盘分区使用率太高!"
description: "$labels.mountpoint 磁盘分区使用大于80%(目前使用:$value%)"配置文件配置
- /usr/local/prometheus-2.37.2.linux-amd64/prometheus.yml
global:
scrape_interval: 60s
evaluation_interval: 20s
scrape_timeout: 15s
rule_files:
- "node_down.yml"
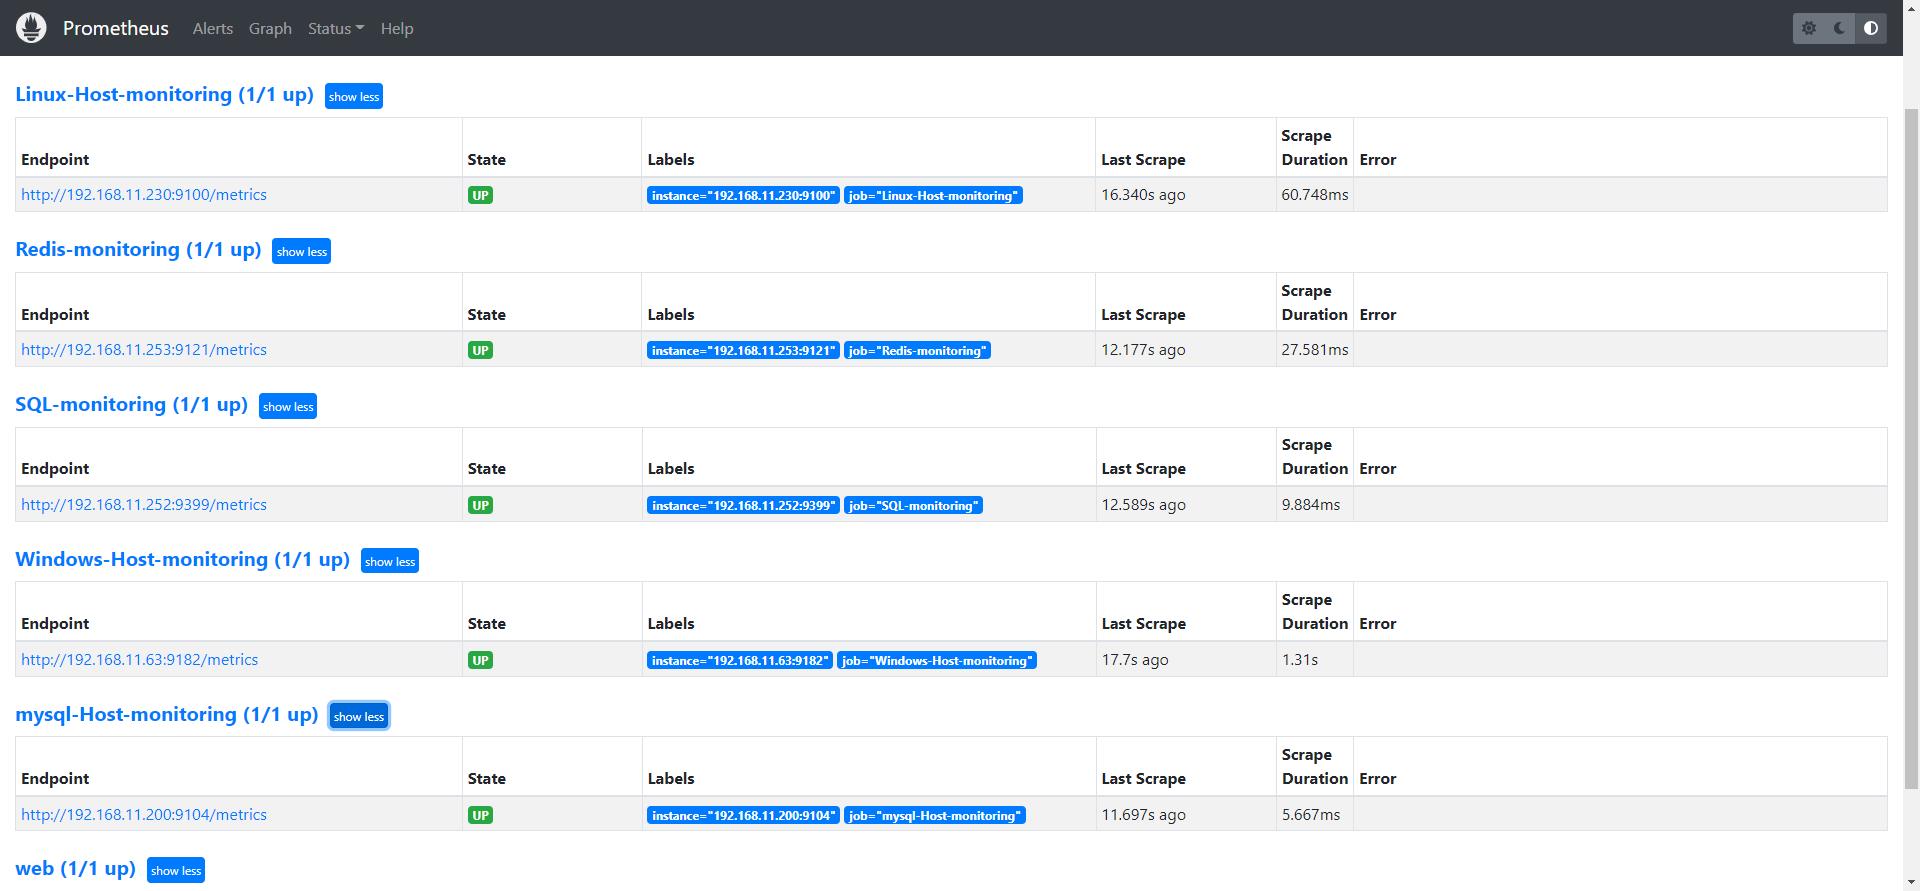
scrape_configs:
- job_name: 'web'
scrape_interval: 5s
static_configs:
- targets:
- localhost:9090
- job_name: 'mysql-Host-monitoring'
scrape_interval: 5s
static_configs:
- targets:
- 192.168.11.200:9104
- job_name: 'Windows-Host-monitoring'
scrape_interval: 5s
static_configs:
- targets:
- 192.168.11.63:9182
- job_name: 'Linux-Host-monitoring'
scrape_interval: 5s
static_configs:
- targets:
- 192.168.11.230:9100
- job_name: 'Redis-monitoring'
scrape_interval: 5s
static_configs:
- targets:
- 192.168.11.253:9121
- job_name: 'SQL-monitoring'
scrape_interval: 5s
static_configs:
- targets:
- 192.168.11.252:9399
重启服务生效
systemctl restart prometheusprometheus采集主机情况
以上是关于Prometheus Install的主要内容,如果未能解决你的问题,请参考以下文章