dataZoom 详细参数渐变柱状图可移动
Posted ThinkerWing
tags:
篇首语:本文由小常识网(cha138.com)小编为大家整理,主要介绍了dataZoom 详细参数渐变柱状图可移动相关的知识,希望对你有一定的参考价值。
渐变柱状图可移动https://www.makeapie.com/editor.html?c=xG3rZAFEqu
配置参考https://www.cnblogs.com/wangweizhang/p/echartsdatazoom.html
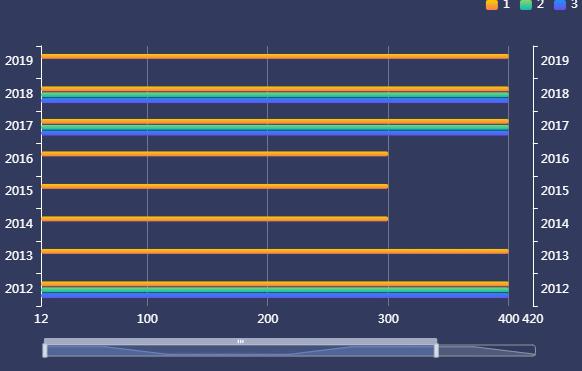
实现功能:滚动进度条,移动显示的数据
通过设置第二个y轴显示在最右侧实现具体数据的显示,yAxisIndex:[0,2], //设置 dataZoom-inside 组件控制的 y轴,可以用数组表示多个轴。
配置项
dataZoom:[ //区域缩放
{
  id: 'dataZoomX',
  show:true, //是否显示 组件。如果设置为 false,不会显示,但是数据过滤的功能还存在。
  backgroundColor:"rgba(47,69,84,0)", //组件的背景颜色
  type: 'slider', //slider表示有滑动块的,inside表示内置的
  dataBackground:{ //数据阴影的样式。
    lineStyle:mylineStyle, //阴影的线条样式
    areaStyle:myareaStyle, //阴影的填充样式
  },
  fillerColor:"rgba(167,183,204,0.4)", //选中范围的填充颜色。
  borderColor:"#ddd", //边框颜色。
  filterMode: 'filter', //'filter':当前数据窗口外的数据,被 过滤掉。即 会 影响其他轴的数据范围。每个数据项,只要有一个维度在数据窗口外,整个数据项就会被过滤掉。
          //'weakFilter':当前数据窗口外的数据,被 过滤掉。即 会 影响其他轴的数据范围。每个数据项,只有当全部维度都在数据窗口同侧外部,整个数据项才会被过滤掉。
          //'empty':当前数据窗口外的数据,被 设置为空。即 不会 影响其他轴的数据范围。
          //'none': 不过滤数据,只改变数轴范围。
  xAxisIndex:0, //设置 dataZoom-inside 组件控制的 x轴,可以用数组表示多个轴
  yAxisIndex:[0,2], //设置 dataZoom-inside 组件控制的 y轴,可以用数组表示多个轴
  radiusAxisIndex:3, //设置 dataZoom-inside 组件控制的 radius 轴,可以用数组表示多个轴
  angleAxisIndex:[0,2], //设置 dataZoom-inside 组件控制的 angle 轴,可以用数组表示多个轴
  start: 30, //数据窗口范围的起始百分比,表示30%
  end: 70, //数据窗口范围的结束百分比,表示70%
  startValue:10, //数据窗口范围的起始数值
  endValue:100, //数据窗口范围的结束数值。
  orient:"horizontal", //布局方式是横还是竖。不仅是布局方式,对于直角坐标系而言,也决定了,缺省情况控制横向数轴还是纵向数轴。'horizontal':水平。'vertical':竖直。
  zoomLock:false, //是否锁定选择区域(或叫做数据窗口)的大小。如果设置为 true
  则锁定选择区域的大小,也就是说,只能平移,不能缩放。
  throttle:100, //设置触发视图刷新的频率。单位为毫秒(ms)。
  zoomOnMouseWheel:true, //如何触发缩放。可选值为:true:表示不按任何功能键,鼠标滚轮能触发缩放。false:表示鼠标滚轮不能触发缩放。'shift':表示按住 shift 和鼠标滚轮能触发缩放。'ctrl':表示按住 ctrl 和鼠标滚轮能触发缩放。'alt':表示按住 alt 和鼠标滚轮能触发缩放。
  moveOnMouseMove:true, //如何触发数据窗口平移。true:表示不按任何功能键,鼠标移动能触发数据窗口平移。false:表示鼠标滚轮不能触发缩放。'shift':表示按住 shift 和鼠标移动能触发数据窗口平移。'ctrl':表示按住 ctrl 和鼠标移动能触发数据窗口平移。'alt':表示按住 alt 和鼠标移动能触发数据窗口平移。
  left:"center", //组件离容器左侧的距离,'left', 'center', 'right','20%'
  top:"top", //组件离容器上侧的距离,'top', 'middle', 'bottom','20%'
  right:"auto", //组件离容器右侧的距离,'20%'
  bottom:"auto", //组件离容器下侧的距离,'20%'

},
{
  id: 'dataZoomY',
  type: 'inside',
  filterMode: 'empty',
  disabled:false, //是否停止组件的功能。
  xAxisIndex:0, //设置 dataZoom-inside 组件控制的 x轴,可以用数组表示多个轴
  yAxisIndex:[0,2], //设置 dataZoom-inside 组件控制的 y轴,可以用数组表示多个轴
  radiusAxisIndex:3, //设置 dataZoom-inside 组件控制的 radius 轴,可以用数组表示多个轴
  angleAxisIndex:[0,2], //设置 dataZoom-inside 组件控制的 angle 轴,可以用数组表示多个轴
  start: 30, //数据窗口范围的起始百分比,表示30%
  end: 70, //数据窗口范围的结束百分比,表示70%
  startValue:10, //数据窗口范围的起始数值
  endValue:100, //数据窗口范围的结束数值。
  orient:"horizontal", //布局方式是横还是竖。不仅是布局方式,对于直角坐标系而言,也决定了,缺省情况控制横向数轴还是纵向数轴。'horizontal':水平。'vertical':竖直。
  zoomLock:false, //是否锁定选择区域(或叫做数据窗口)的大小。如果设置为 true 则锁定选择区域的大小,也就是说,只能平移,不能缩放。
  throttle:100, //设置触发视图刷新的频率。单位为毫秒(ms)。
  zoomOnMouseWheel:true, //如何触发缩放。可选值为:true:表示不按任何功能键,鼠标滚轮能触发缩放。false:表示鼠标滚轮不能触发缩放。'shift':表示按住 shift 和鼠标滚轮能触发缩放。'ctrl':表示按住 ctrl 和鼠标滚轮能触发缩放。'alt':表示按住 alt 和鼠标滚轮能触发缩放。
  moveOnMouseMove:true, //如何触发数据窗口平移。true:表示不按任何功能键,鼠标移动能触发数据窗口平移。false:表示鼠标滚轮不能触发缩放。'shift':表示按住 shift 和鼠标移动能触发数据窗口平移。'ctrl':表示按住 ctrl 和鼠标移动能触发数据窗口平移。'alt':表示按住 alt 和鼠标移动能触发数据窗口平移。
}
]
代码
<!DOCTYPE html>
<html lang="en">

<head>
  <meta charset="UTF-8">
  <meta name="viewport" content="width=device-width, initial-scale=1.0">
  <meta http-equiv="X-UA-Compatible" content="ie=edge">
  <title>Document</title>
  <script src="https://cdn.bootcdn.net/ajax/libs/echarts/5.2.0/echarts.min.js"></script>
</head>

<body>
  <div style="width: 600px;height:400px;background: #05265C; "></div>
  <script>
    var mCharts = echarts.init(document.querySelector("div"))
    var option = {
      backgroundColor: '#323a5e',
      tooltip: {
        trigger: 'axis',
        axisPointer: { // 坐标轴指示器,坐标轴触发有效
          type: 'shadow' // 默认为直线,可选为:'line' | 'shadow'
        }
      },
      grid: {
        left: '2%',
        right: '4%',
        bottom: '14%',
        top: '16%',
        containLabel: true
      },
      legend: {
        data: ['1', '2', '3'],
        right: 10,
        top: 12,
        textStyle: {
          color: "#fff"
        },
        itemWidth: 12,
        itemHeight: 10,
        // itemGap: 35
      },
      yAxis: [{
          type: 'category',
          data: ['2012', '2013', '2014', '2015', '2016', '2017', '2018', '2019', '2020', '2021'],
          axisLine: {
            lineStyle: {
              color: 'white'

            }
          },
          axisLabel: {
            // interval: 0,
            // rotate: 40,
            textStyle: {
              fontFamily: 'Microsoft YaHei'
            }
          },
        },
        {
          type: 'category',
          data: ['2012', '2013', '2014', '2015', '2016', '2017', '2018', '2019', '2020', '2021'],
          axisLine: {
            lineStyle: {
              color: 'white'
            }
          },
          axisLabel: {
            // interval: 0,
            // rotate: 40,
            textStyle: {
              fontFamily: 'Microsoft YaHei'
            }
          },
        }
      ],
      xAxis: {
        type: 'value',
        max: '1200',
        axisLine: {
          show: false,
          lineStyle: {
            color: 'white'
          }
        },
        splitLine: {
          show: true,
          lineStyle: {
            color: 'rgba(255,255,255,0.3)'
          }
        },
        axisLabel: {}
      },
      "dataZoom": [{
        "show": true,
        "height": 12,
        "orient": 'horizontal',
        "yAxisIndex": [0, 1],
        bottom: '8%',
        "start": 10,
        "end": 90,
        handleIcon: 'path://M306.1,413c0,2.2-1.8,4-4,4h-59.8c-2.2,0-4-1.8-4-4V200.8c0-2.2,1.8-4,4-4h59.8c2.2,0,4,1.8,4,4V413z',
        handleSize: '110%',
        handleStyle: {
          color: "#d3dee5",

        },
        textStyle: {
          color: "#fff"
        },
        borderColor: "#90979c"
      }, {
        "type": "inside",
        "show": true,
        "height": 15,
        "start": 1,
        "end": 35
      }],
      series: [{
          name: '1',
          type: 'bar',
          barWidth: '15%',
          label: {
            show: true,
            position: "inside",
            normal: {
              show: false
            }
          },
          itemStyle: {
            normal: {
              color: new echarts.graphic.LinearGradient(0, 0, 0, 1, [{
                offset: 0,
                color: '#fccb05'
              }, {
                offset: 1,
                color: '#f5804d'
              }]),
              barBorderRadius: 12,
            },
          },
          data: [400, 400, 300, 300, 300, 400, 400, 400, 300]
        },
        {
          name: '2',
          type: 'bar',
          barWidth: '15%',
          itemStyle: {
            normal: {
              color: new echarts.graphic.LinearGradient(0, 0, 0, 1, [{
                offset: 0,
                color: '#8bd46e'
              }, {
                offset: 1,
                color: '#09bcb7'
              }]),
              barBorderRadius: 11,
            }

          },
          data: [400, 500, 500, 500, 500, 400, 400, 500, 500]
        },
        {
          name: '3',
          type: 'bar',
          barWidth: '15%',
          itemStyle: {
            normal: {
              color: new echarts.graphic.LinearGradient(0, 0, 0, 1, [{
                offset: 0,
                color: '#248ff7'
              }, {
                offset: 1,
                color: '#6851f1'
              }]),
              barBorderRadius: 11,
            }
          },
          data: [400, 600, 700, 700, 1000, 400, 400, 600, 700]
        }
      ]
    };

    var app = {
      currentIndex: -1,
    };
    setInterval(function () {
      var dataLen = option.series[0].data.length;

      // 取消之前高亮的图形
      myChart.dispatchAction({
        type: 'downplay',
        seriesIndex: 0,
        dataIndex: app.currentIndex
      });
      app.currentIndex = (app.currentIndex + 1) % dataLen;
      //console.log(app.currentIndex);
      // 高亮当前图形
      myChart.dispatchAction({
        type: 'highlight',
        seriesIndex: 0,
        dataIndex: app.currentIndex,
      });
      // 显示 tooltip
      myChart.dispatchAction({
        type: 'showTip',
        seriesIndex: 0,
        dataIndex: app.currentIndex
      });


    }, 1000);
    mCharts.setOption(option)
  </script>
</body>

</html>
以上是关于dataZoom 详细参数渐变柱状图可移动的主要内容,如果未能解决你的问题,请参考以下文章