科研必备,破解大数据散点overlap的6种姿势
Posted qq_21478261
tags:
篇首语:本文由小常识网(cha138.com)小编为大家整理,主要介绍了科研必备,破解大数据散点overlap的6种姿势相关的知识,希望对你有一定的参考价值。
当有大量数据点在一张图中散点图展示时,会出现如下状况,
library(ggplot2)
x <- rnorm(n = 10000)
y <- rnorm(n = 10000, sd=2) + x
df <- data.frame(x, y)
ggplot(df, aes(x, y)) +
geom_point(colour="blue")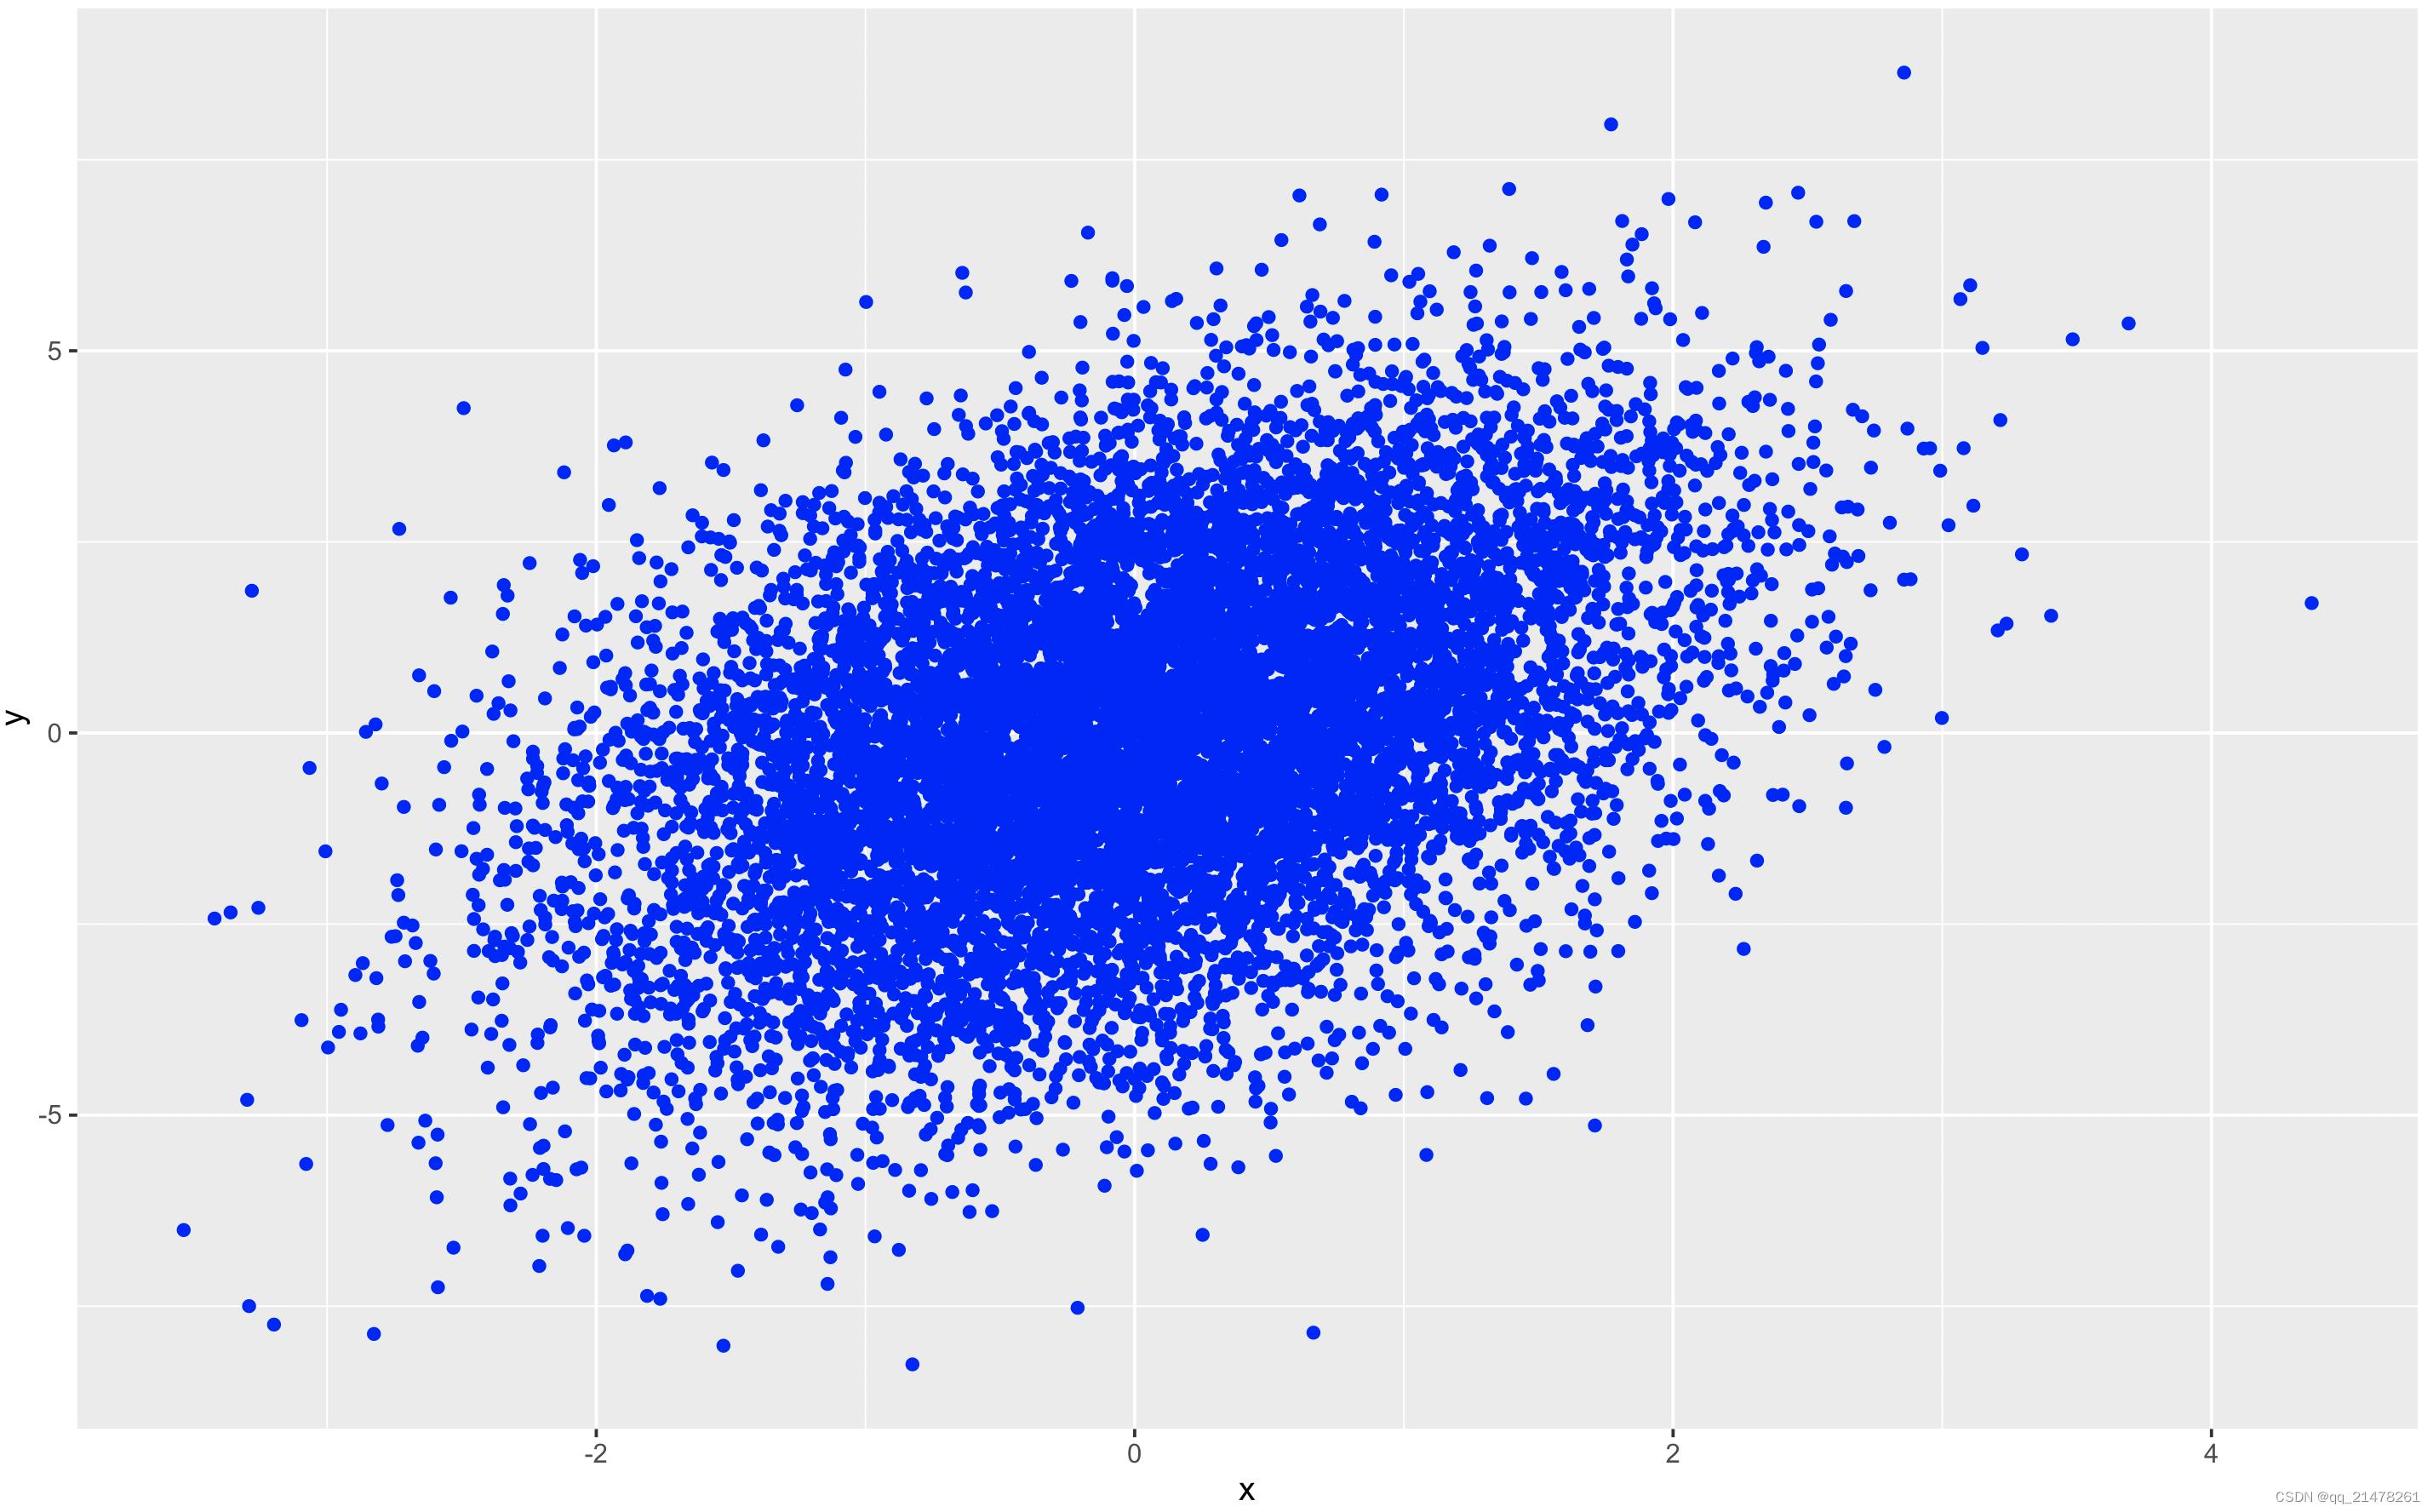 大量点重叠在一起,有的区域直接融在一起。
以下介绍多种解决方法,欢迎三连。
方法1、控制散点透明度
ggplot(df, aes(x, y)) +
  geom_point(colour="blue",
             alpha = 0.2 #设置点的透明度
            )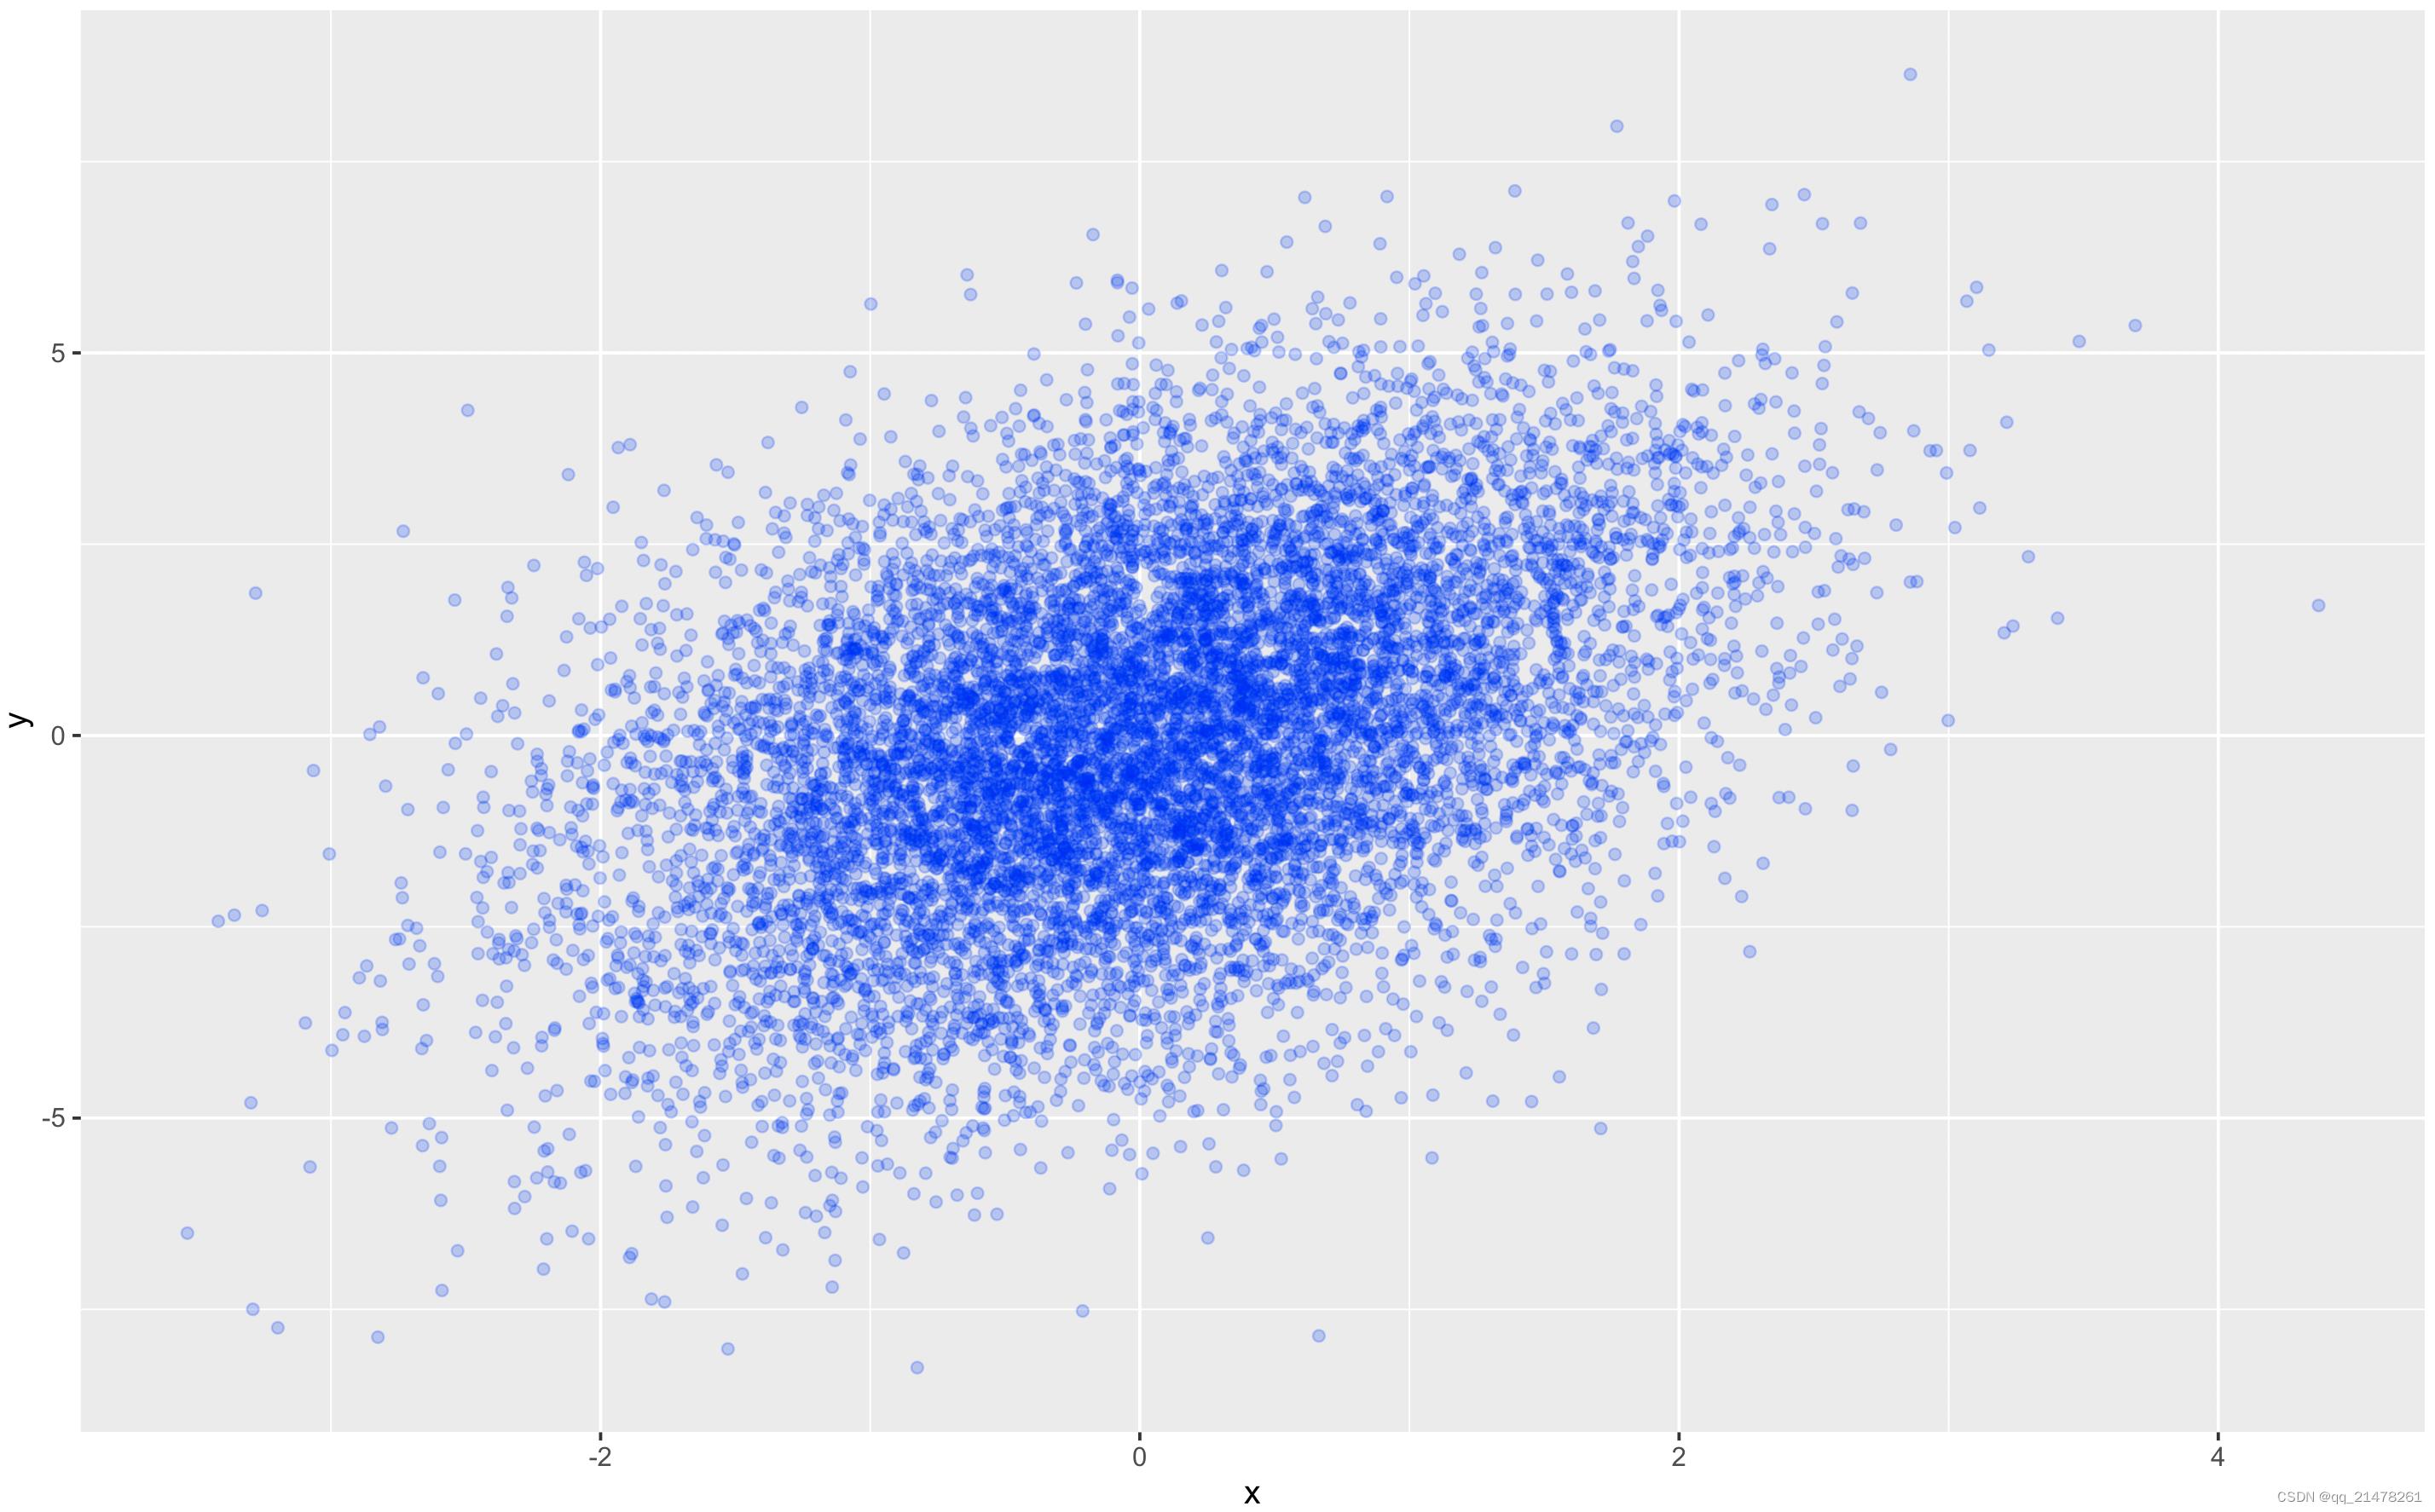
效果会好很多。
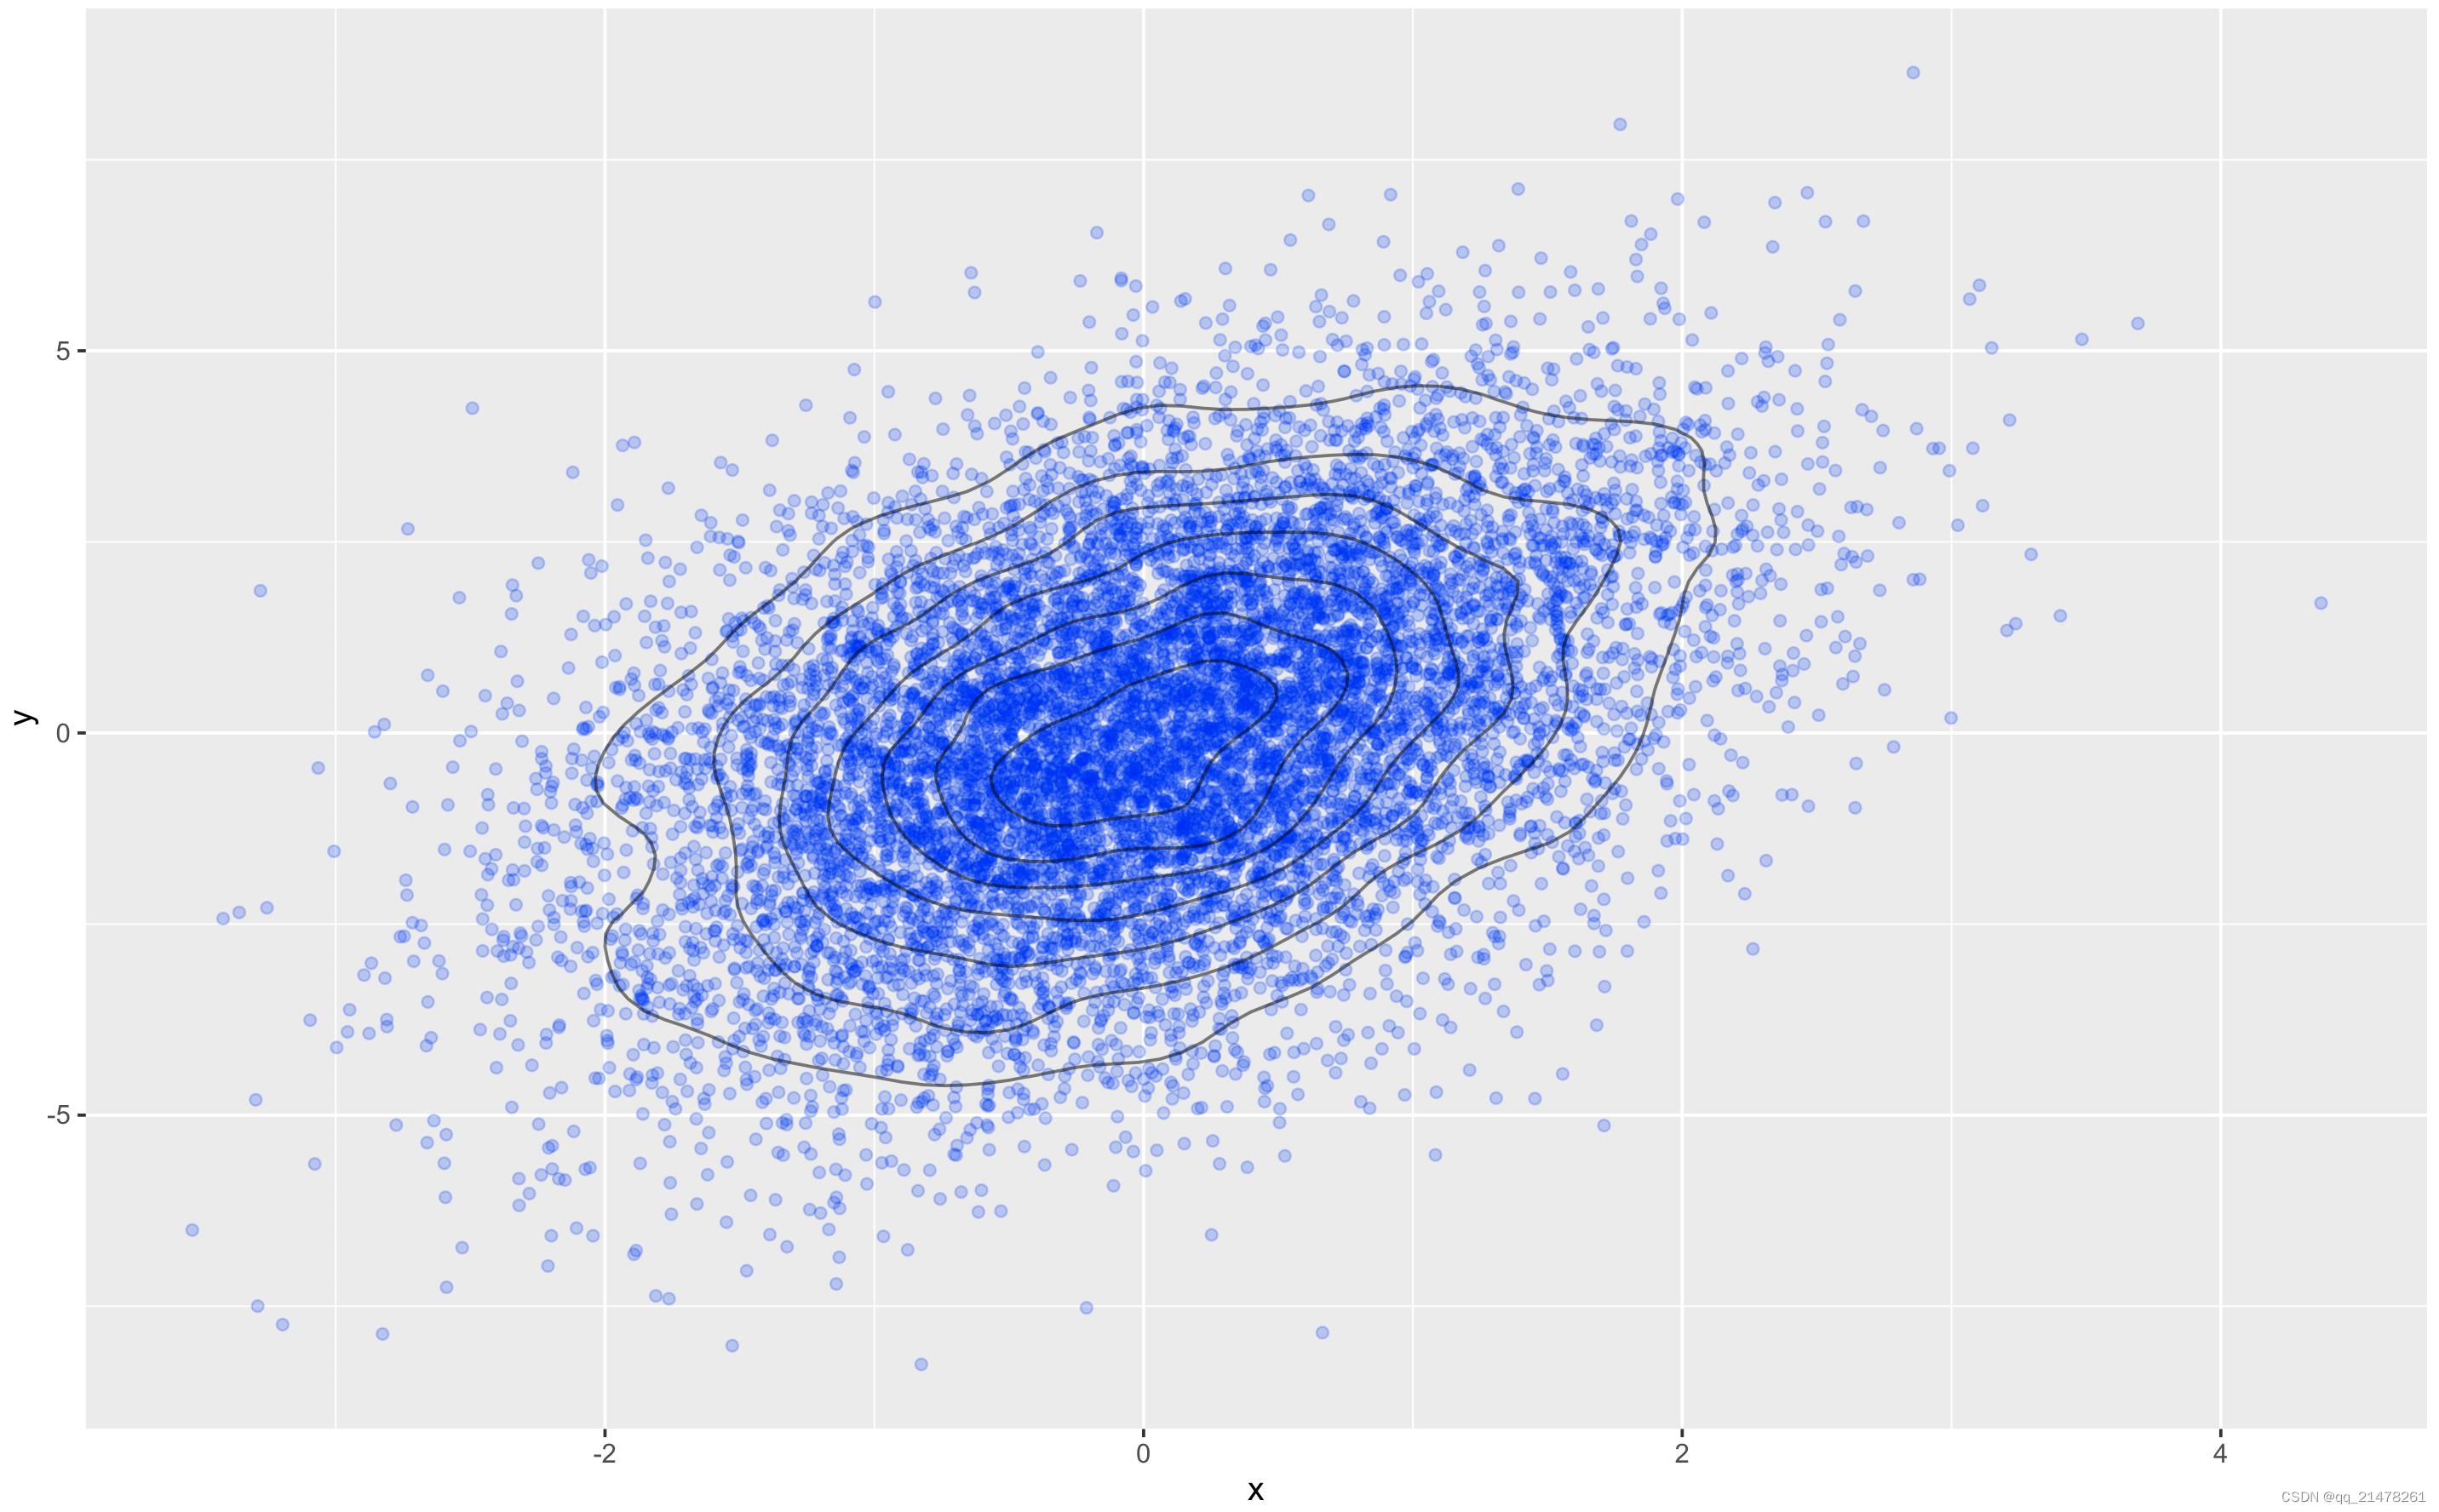
方法2、添加等高线
ggplot(df, aes(x, y)) +
  geom_point(colour="blue",alpha = 0.2) +
  geom_density_2d(colour="black",alpha = 0.5) #geom_density_2d添加等高线
方法3、填充等高线
ggplot(df, aes(x, y)) +
  stat_density_2d(aes(fill = stat(level)), geom = 'polygon') +
  scale_fill_viridis_c(name = "density") +
  geom_point(colour="blue",alpha = 0.5,shape = '.')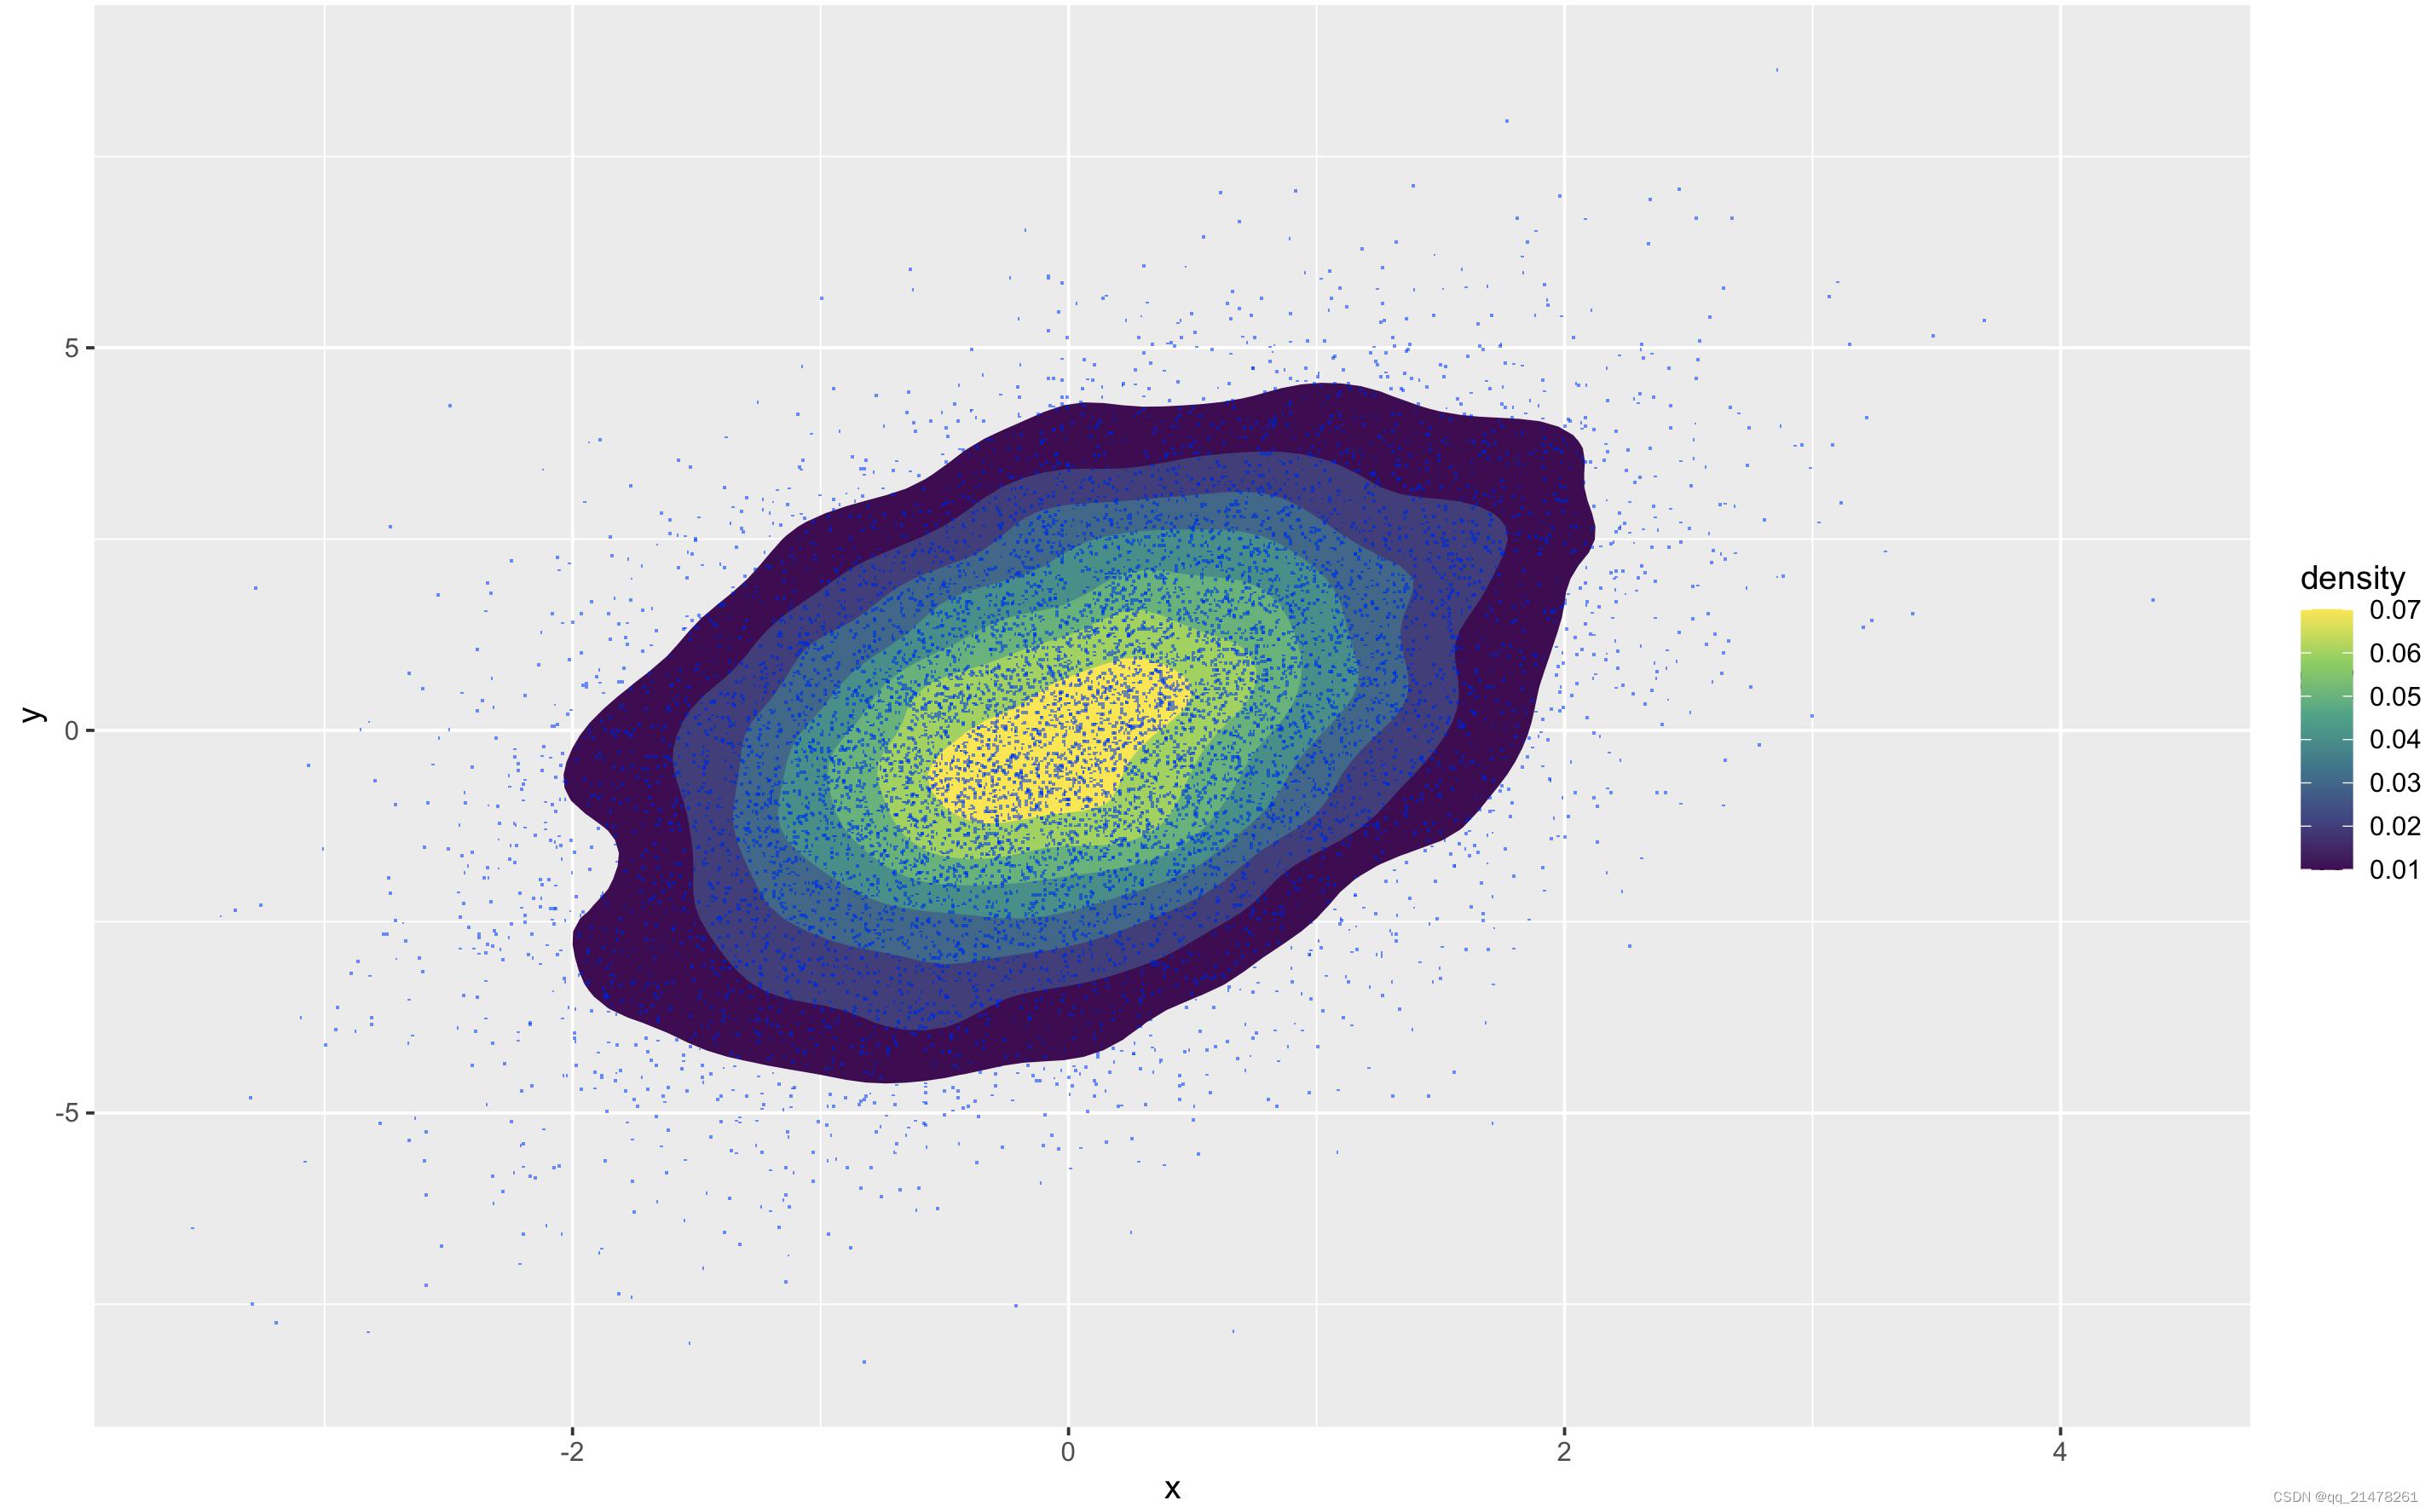
方法4、density heatmap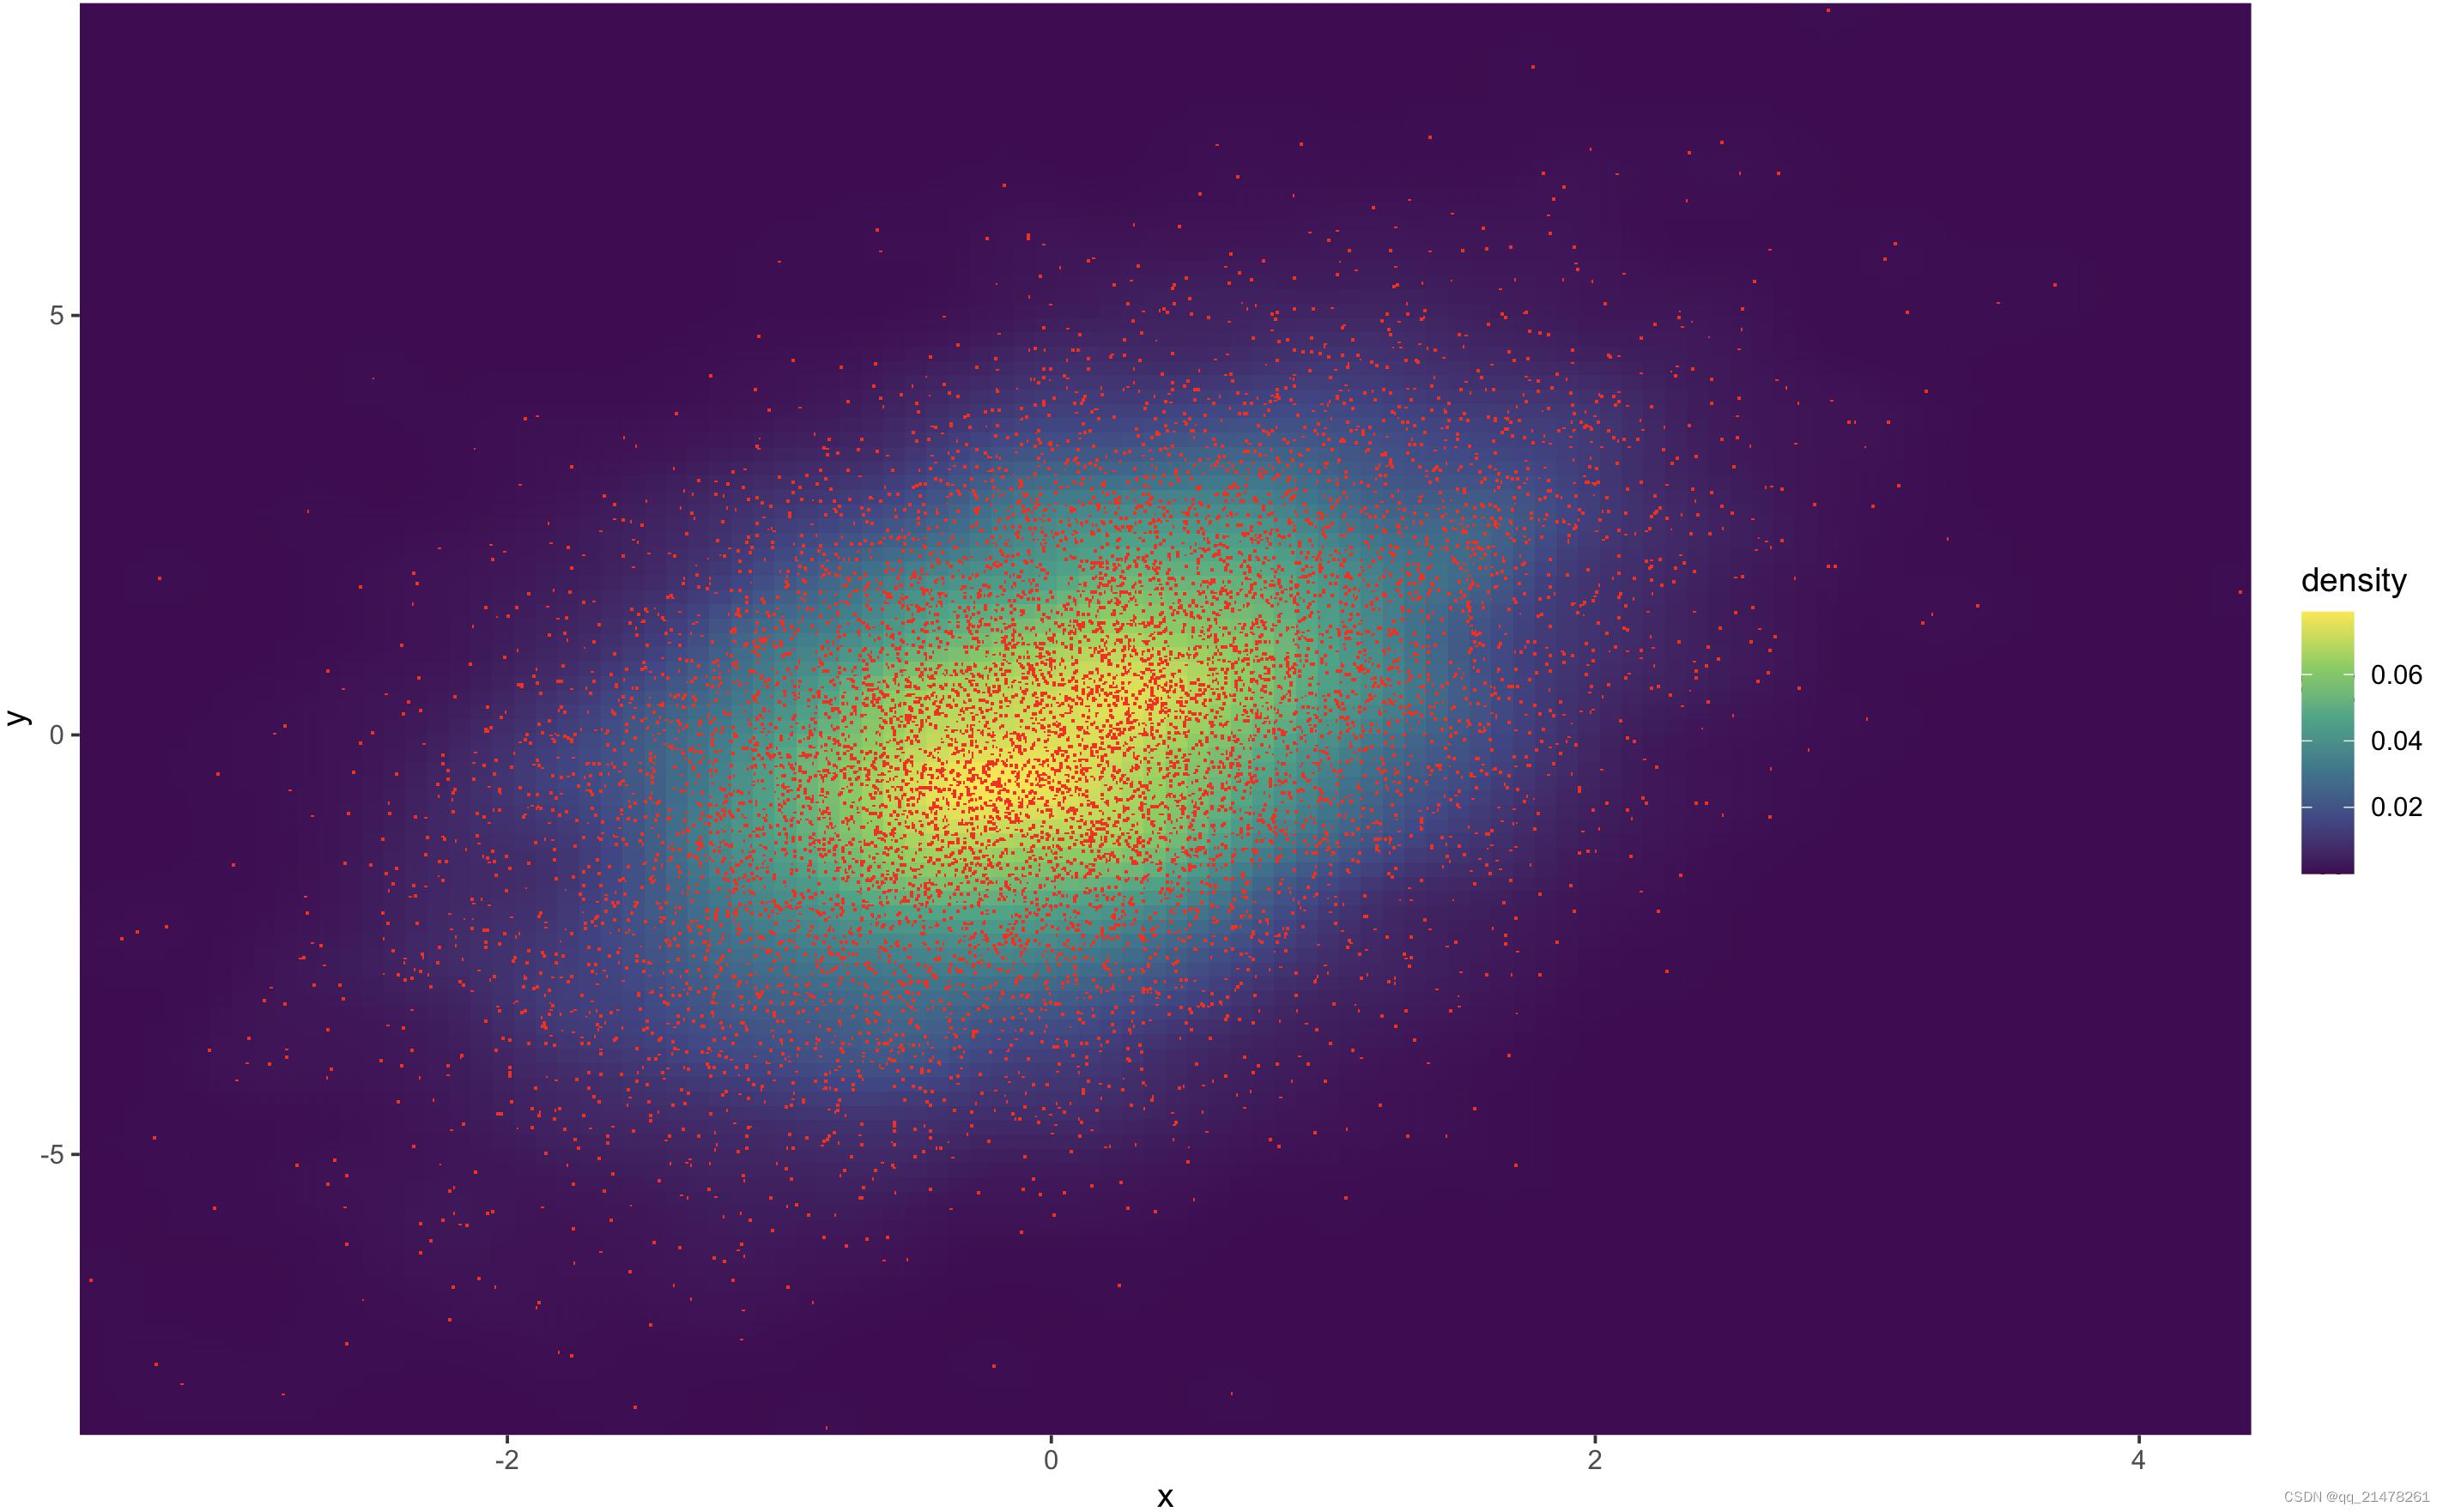
ggplot(df, aes(x, y)) +
  stat_density_2d(aes(fill = stat(density)), geom = 'raster', contour = FALSE) +
  scale_fill_viridis_c() +
  coord_cartesian(expand = FALSE) +
  geom_point(shape = '.', col = 'red')
方法5、hexbin图
ggplot(df, aes(x, y)) +
  geom_hex() + #geom_hex
  scale_fill_viridis_c() +
  geom_point(shape = '.', col = 'red')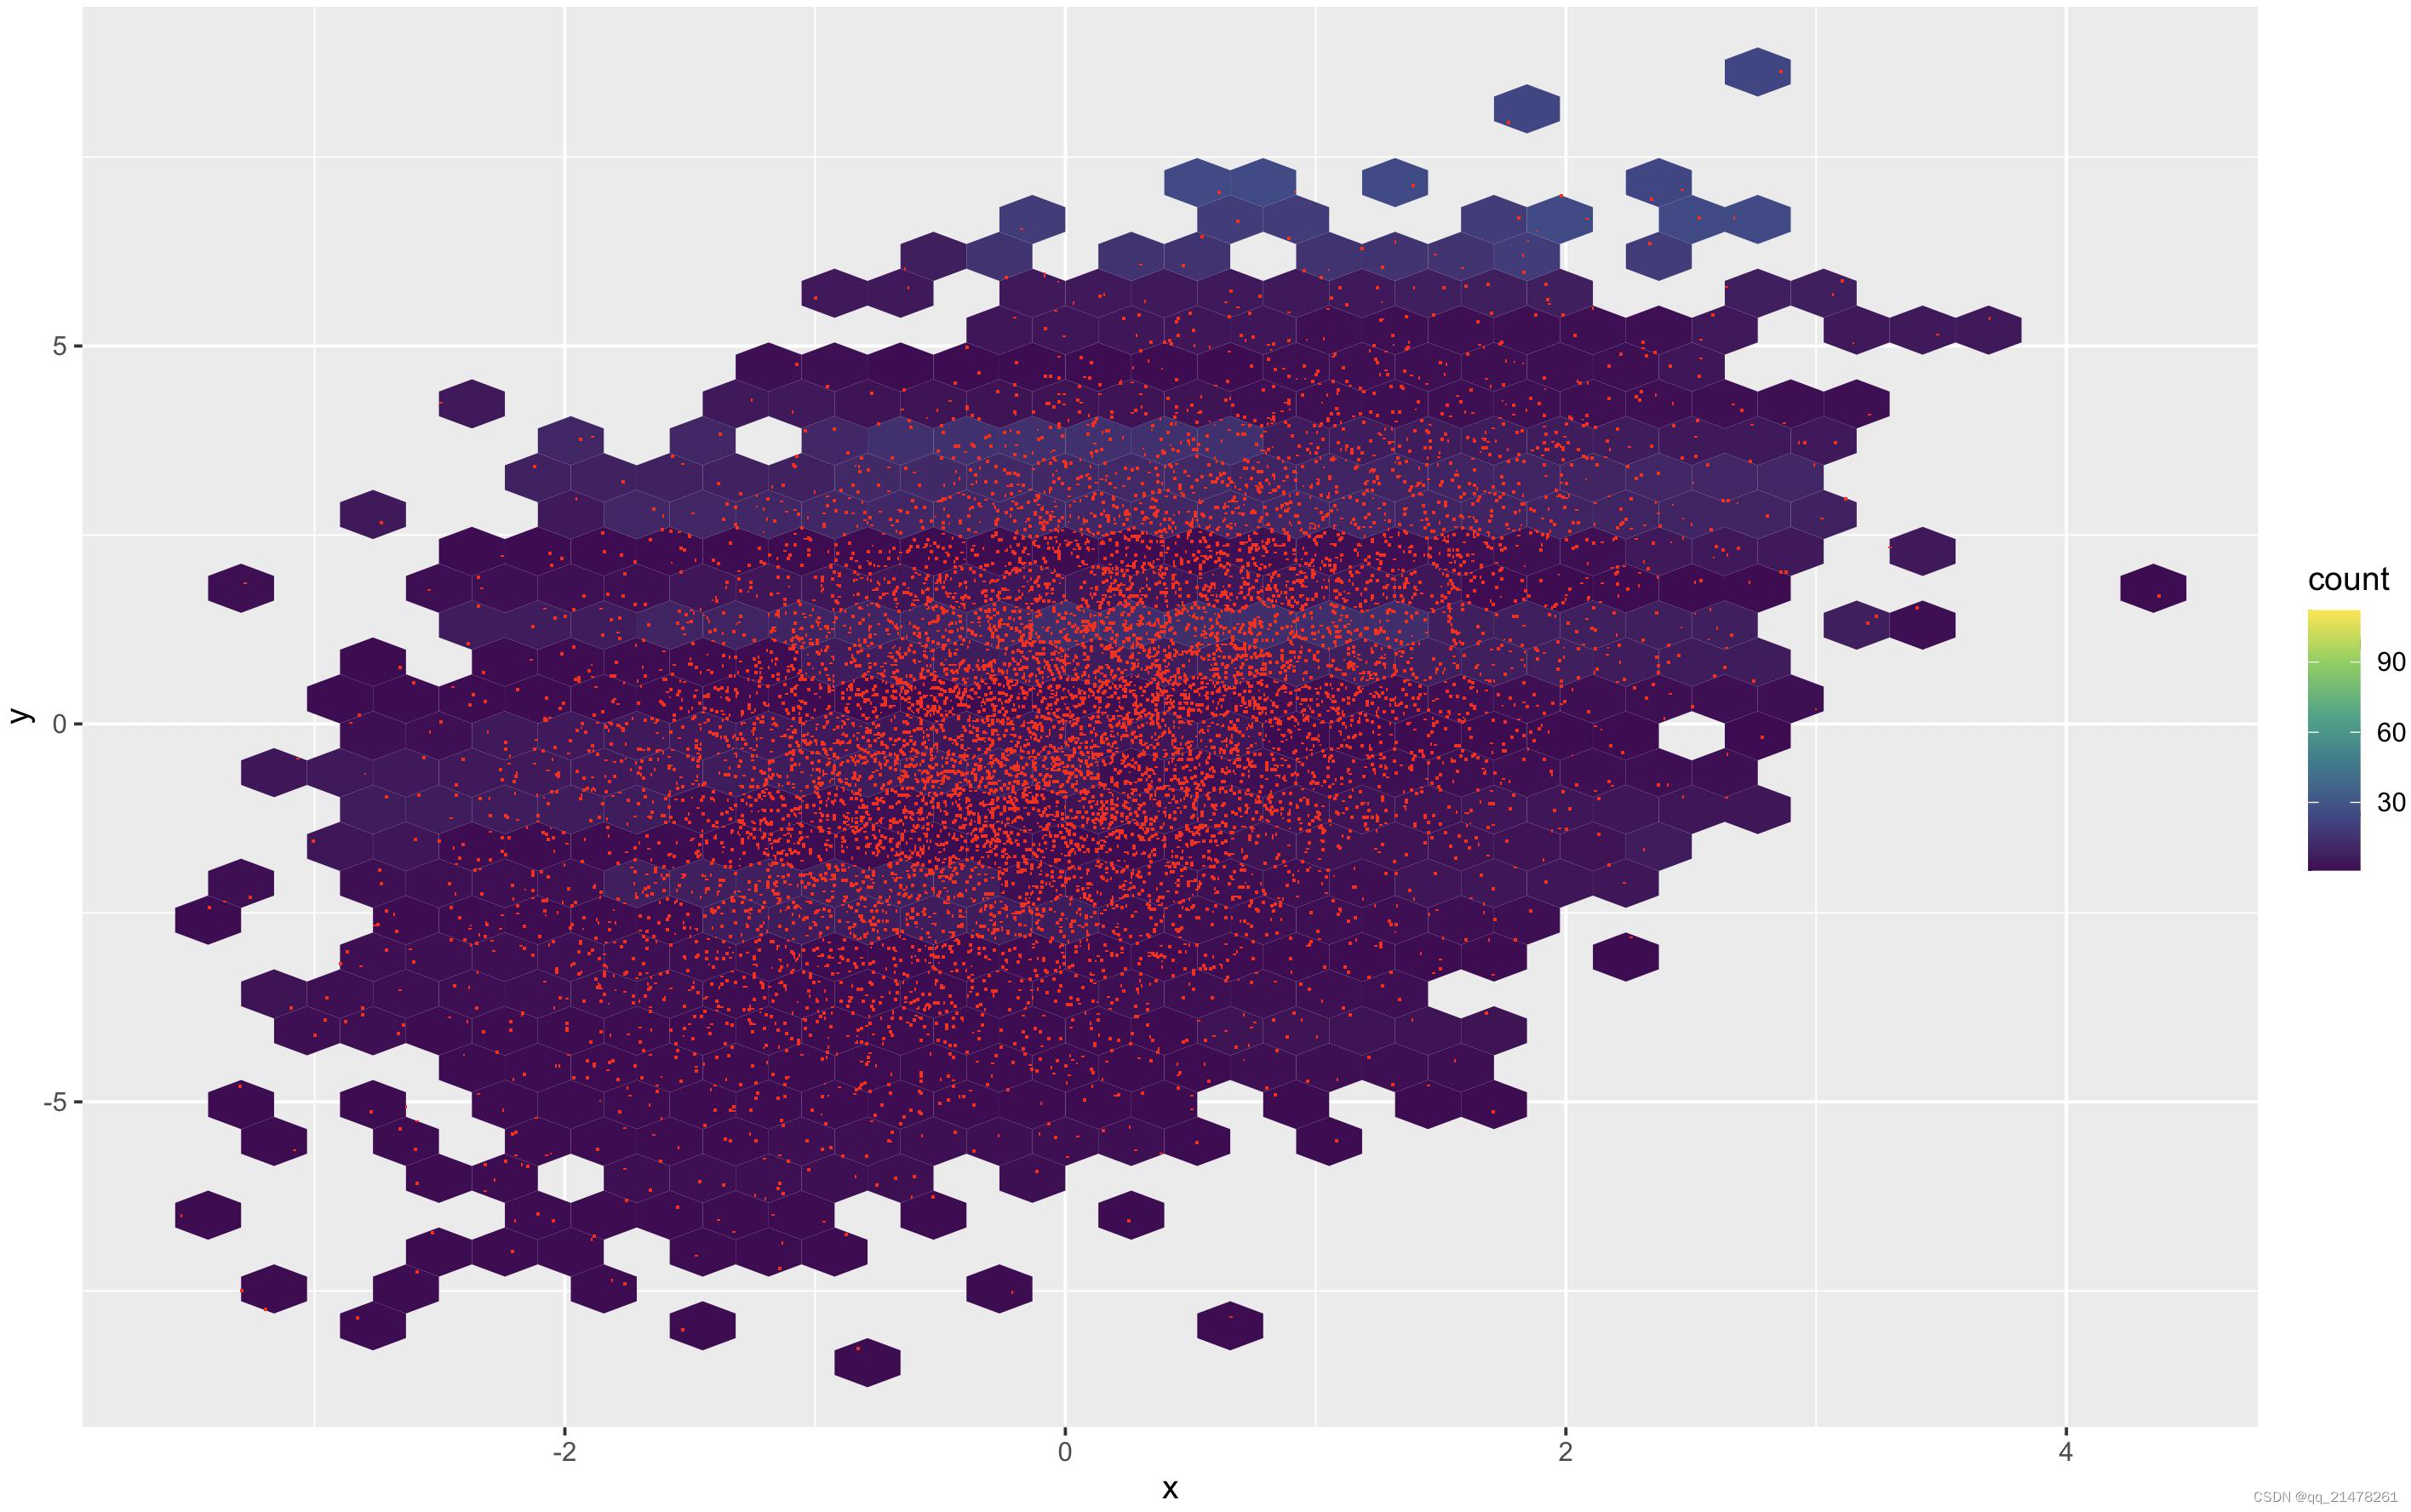
方法6、rug图
ggplot(df, aes(x, y)) +
geom_point(colour="blue",alpha = 0.2) +
geom_rug(colour="blue",alpha = 0.2) #geom_rug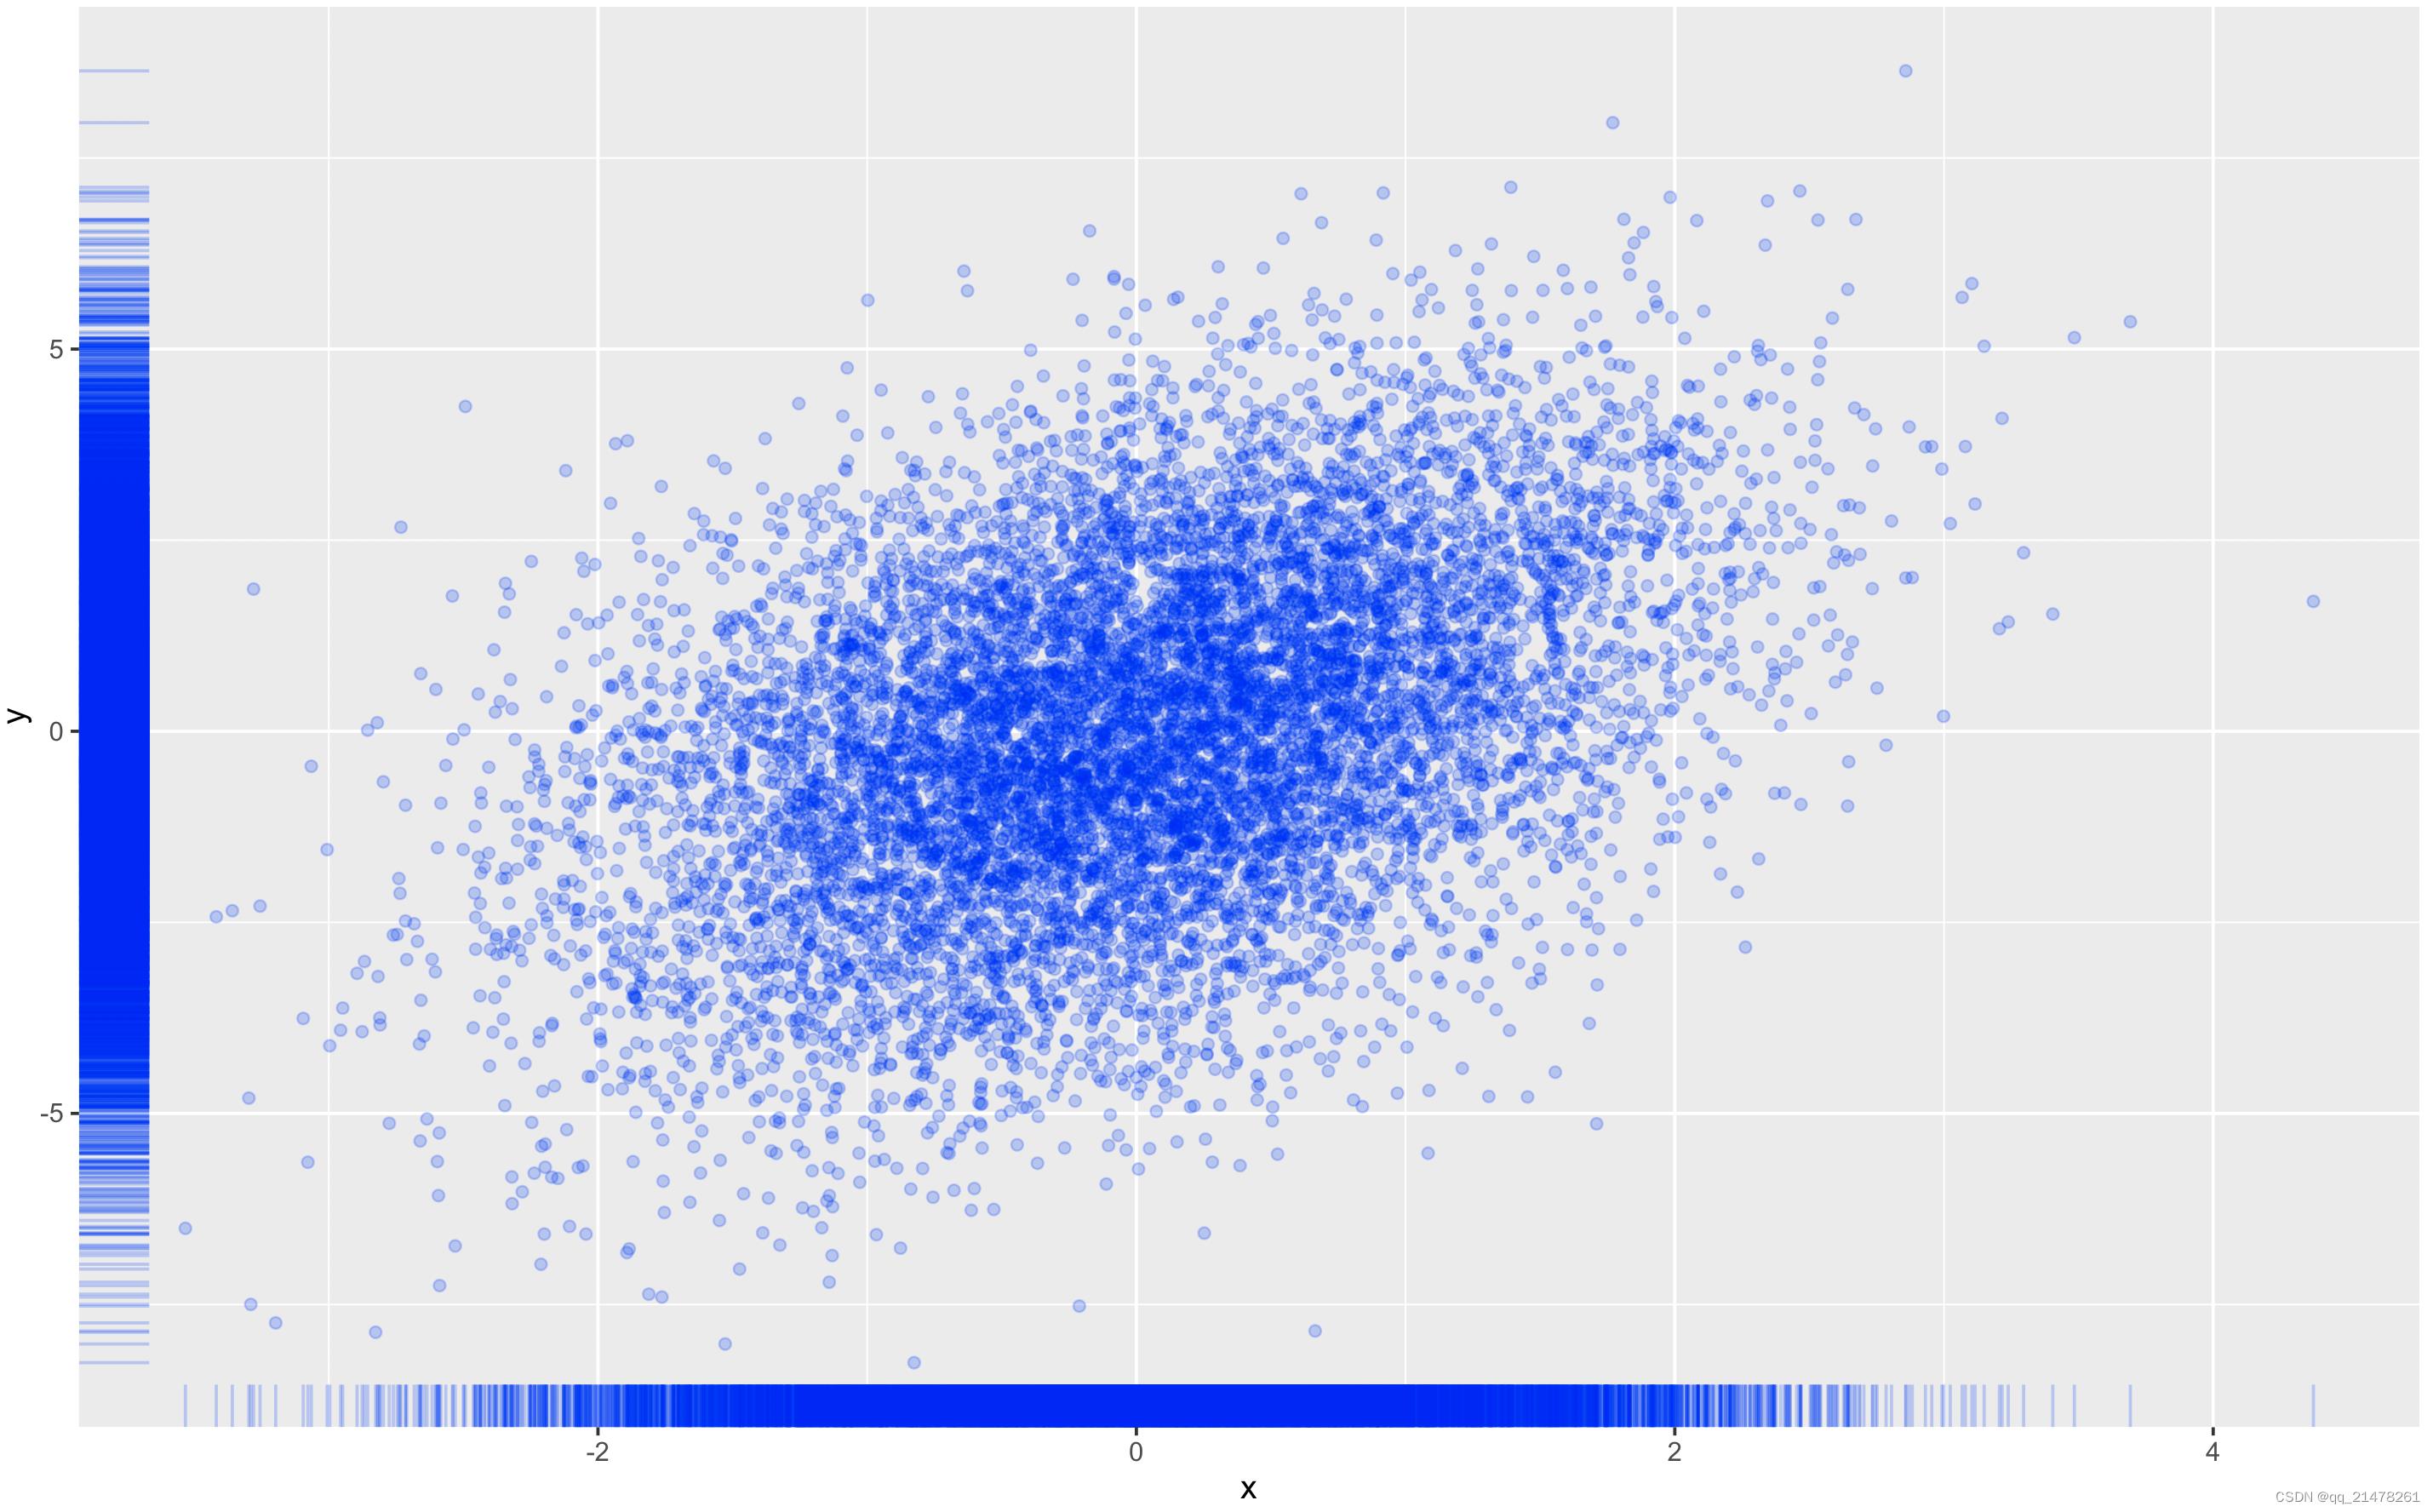 方法7、ggsubplot
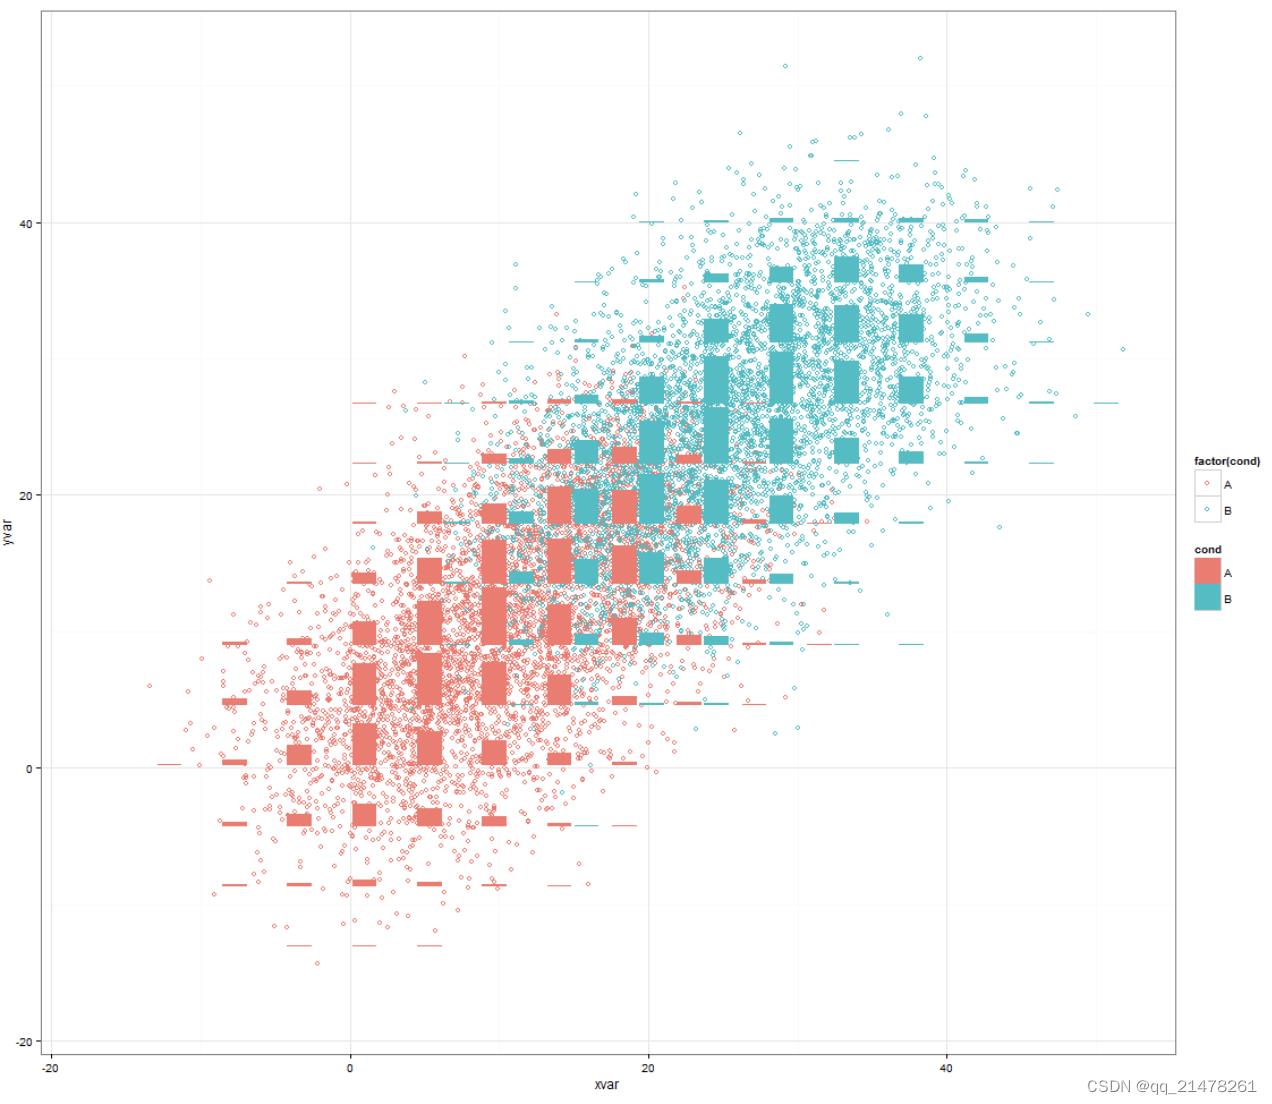
library(ggplot2)
library(ggsubplot)

# data
set.seed(955)
dat <- data.frame(cond = rep(c("A", "B"), each=5000),
                  xvar = c(rep(1:20,250) + rnorm(5000,sd=5),rep(16:35,250) + rnorm(5000,sd=5)),
                  yvar = c(rep(1:20,250) + rnorm(5000,sd=5),rep(16:35,250) + rnorm(5000,sd=5)))

ggplot(dat, aes(x=xvar, y=yvar)) +
  geom_point(shape=1, aes(color = factor(cond))) +
  geom_subplot2d(aes(xvar, yvar, #geom_subplot2d
                     subplot = geom_bar(aes(cond, ..count.., fill = cond))),
                 bins = c(15,15), ref = NULL, width = rel(0.8), ply.aes = FALSE)
更多干货👇👇👇👇
以上是关于科研必备,破解大数据散点overlap的6种姿势的主要内容,如果未能解决你的问题,请参考以下文章