MNE学习笔记:Evoked data的可视化
Posted Dodo·D·Caster
tags:
篇首语:本文由小常识网(cha138.com)小编为大家整理,主要介绍了MNE学习笔记:Evoked data的可视化相关的知识,希望对你有一定的参考价值。
MNE学习笔记(七):Evoked data的可视化
参考文章:https://mne.tools/stable/auto_tutorials/evoked/20_visualize_evoked.html
准备工作
这里就不再解释了,具体可以查看MNE学习笔记(四):Evoked数据结构。
代码:
import os
import numpy as np
import mne
from matplotlib import pyplot as plt

# 如果没有数据则用这个自动下载
# sample_data_folder = mne.datasets.sample.data_path()
# 已有数据,则直接加载即可
sample_data_folder = "D:\\Data\\MNE-sample-data"
sample_data_evk_file = os.path.join(sample_data_folder, 'MEG', 'sample',
                                    'sample_audvis-ave.fif')
evokeds_list = mne.read_evokeds(sample_data_evk_file, baseline=(None, 0),
                                proj=True, verbose=False)

# Show the condition names, and reassure ourselves that baseline correction has been applied.
for e in evokeds_list:
    print(f'Condition: {e.comment}, baseline: {e.baseline}')

# convert that list of Evoked objects into a dictionary
conds = ('aud/left', 'aud/right', 'vis/left', 'vis/right')
evks = dict(zip(conds, evokeds_list))
#      ‾‾‾‾‾‾‾‾‾‾‾‾‾‾‾‾‾‾‾‾‾‾‾‾‾‾‾‾‾‾ this is equivalent to:
# {'aud/left': evokeds_list[0], 'aud/right': evokeds_list[1],
#  'vis/left': evokeds_list[2], 'vis/right': evokeds_list[3]}
结果:

绘制信号追踪图(signal traces)
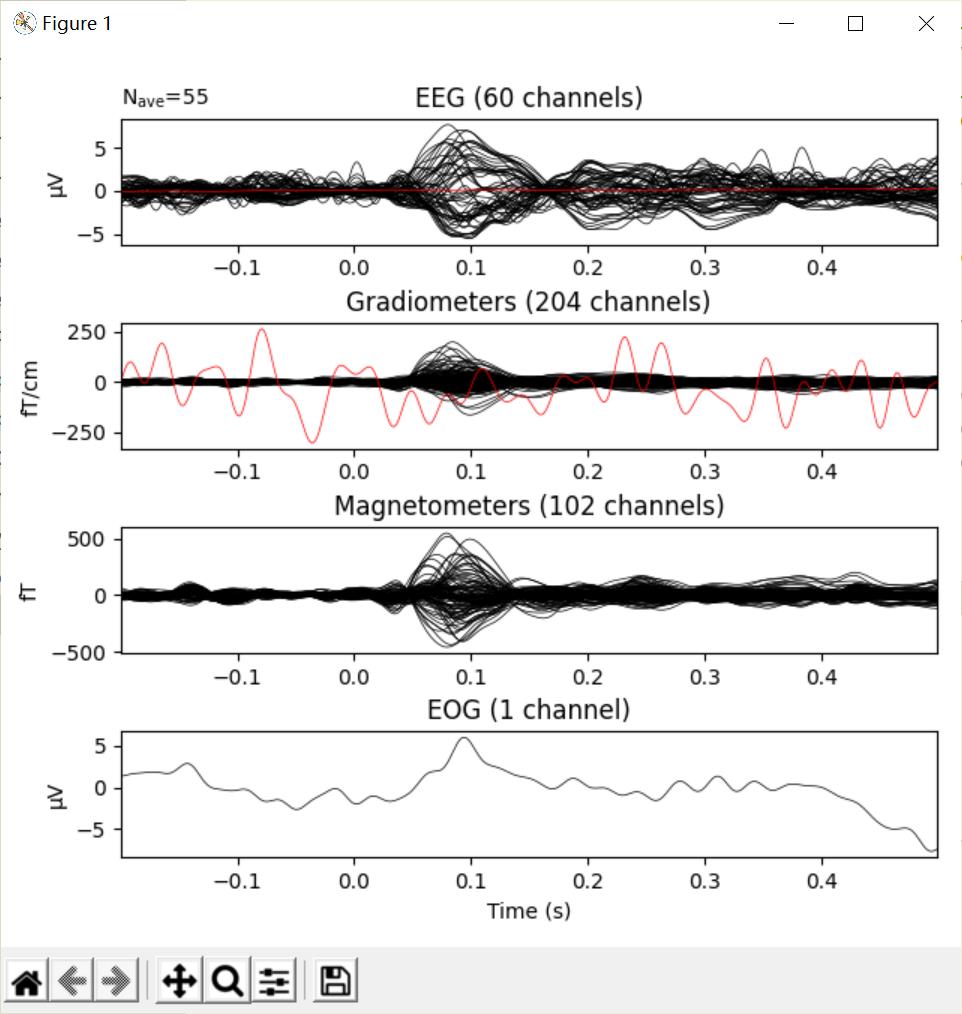
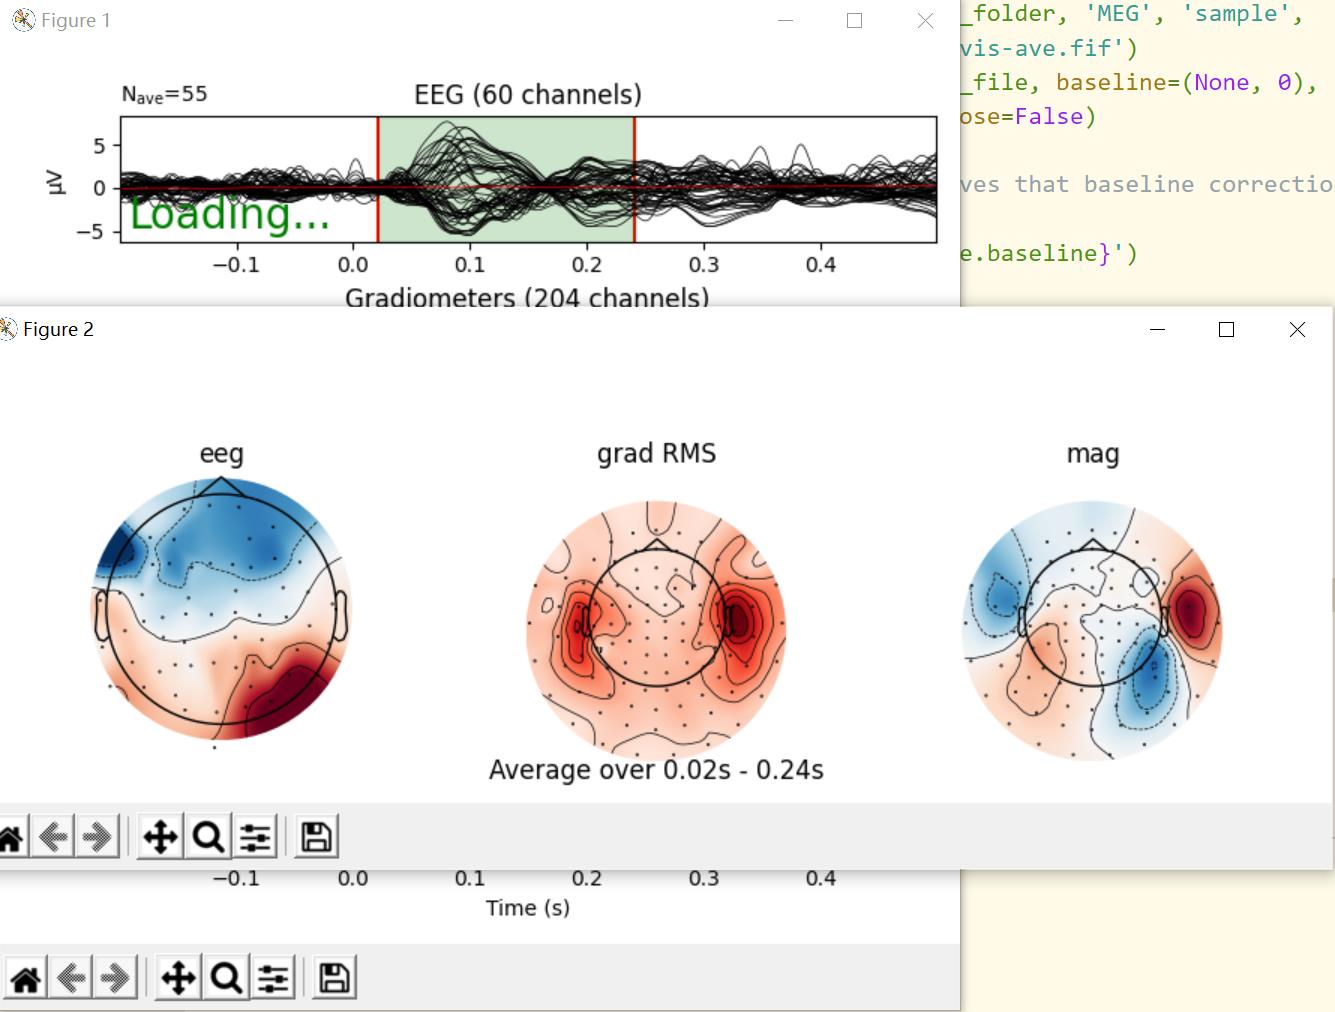
Evoked对象最基本的图是每一个channel类型的蝴蝶图(butterfly plot),这是由evoked.plot()方法生成的。默认情况下,‘bad’ channel会被排除,但是可以通过将一个空的list传递给exclude参数(默认为exclude='bads')对它进行控制:
代码:
# signal trace
evks['aud/left'].plot(exclude=[])
plt.show()
结果:
evoked.plot()参数含义
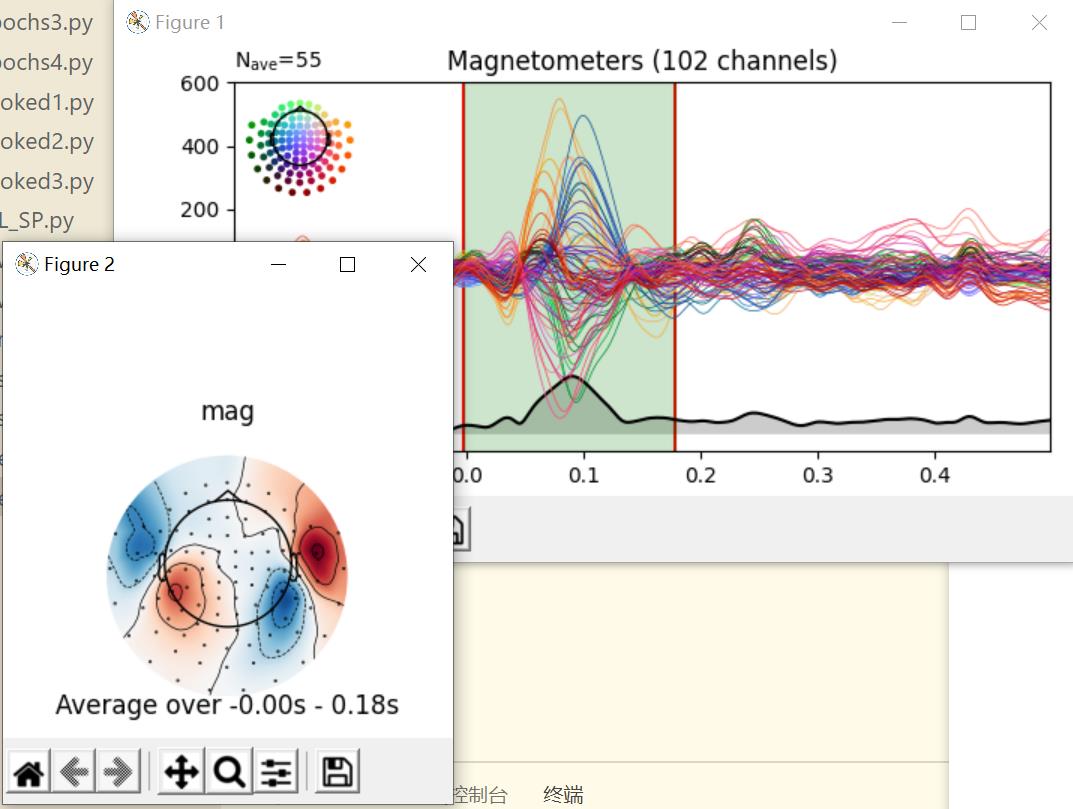
picks参数:可以让我们通过name、index或者type来选择channel。这里展示一下只选择magnetometer channel的图。spatial_colors=True:根据它们的位置用颜色编码通道轨迹。gfp=True:叠加/添加对信号的均方根(RMS - Root Mean Square)的追踪(trace)。
代码:
# pick spatial_color gfp
evks['aud/left'].plot(picks='mag', spatial_colors=True, gfp=True)
plt.show()
结果:

选择一段之后:
绘制头皮地形图(scalp topographies)
通过plot_topmap方法可以生成特定时间的头皮地形图。
代码:
# 头皮地形图
times = np.linspace(0.05, 0.13, 5)
evks['aud/left'].plot_topomap(ch_type='mag', times=times, colorbar=True)
plt.show()
结果:


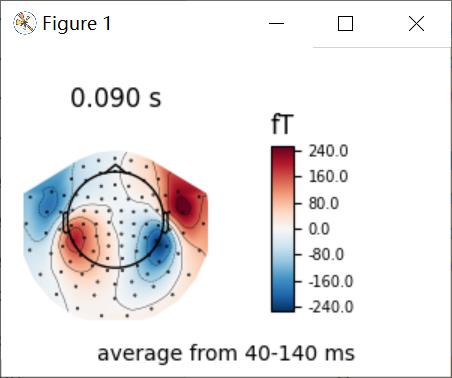
也可以对时间进行指定
代码:
# 指定time = 0.09
fig = evks['aud/left'].plot_topomap(ch_type='mag', times=0.09, average=0.1)
fig.text(0.5, 0.05, 'average from 40-140 ms', ha='center')
plt.show()
结果

绘制箭头地图(Arrow maps)
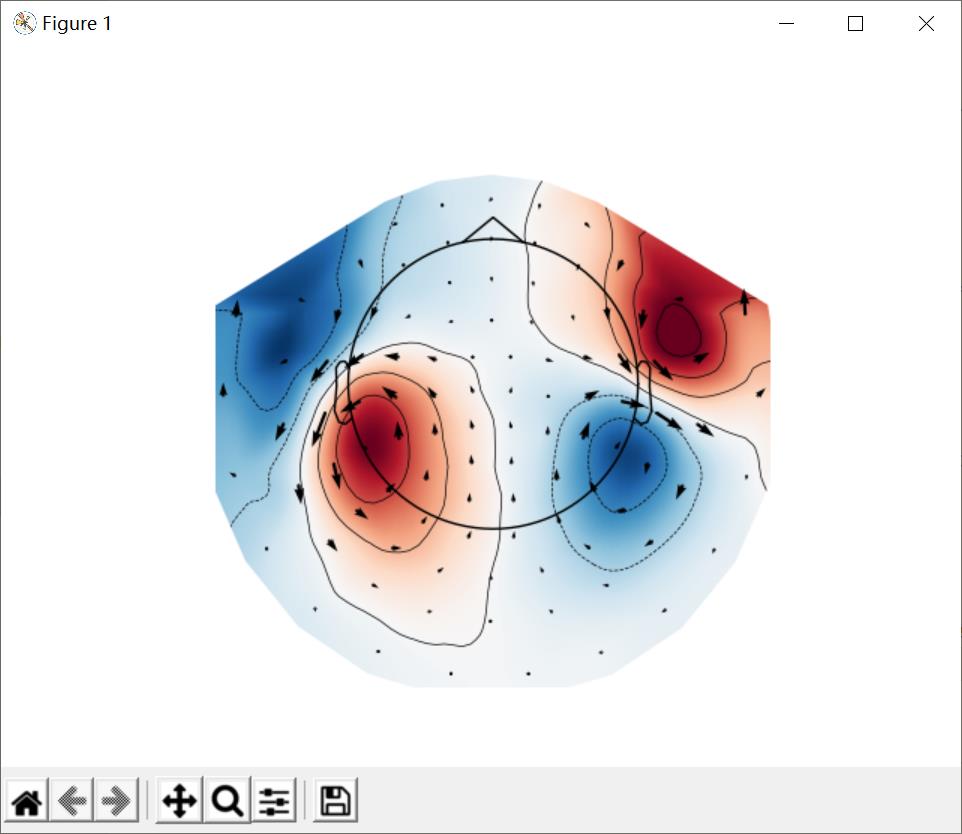
上面的头皮地形图通过mne.viz.plot_arrowmap来生成显示估计磁场的大小和方向的箭头。
代码:
# 箭头地图
mags = evks['aud/left'].copy().pick_types(meg='mag')
mne.viz.plot_arrowmap(mags.data[:, 175], mags.info, extrapolate='local')
plt.show()
结果:
绘制联合图(Joint plots)
联合图结合了butterfly plots和scalp topographies,并提供了evoked data的一种美观的展示方式。默认中地形图会被自动基于peak finding放置。联合图也可以选取特定时间来进行绘制。
代码:
# 联合图
evks['vis/right'].plot_joint()
plt.show()
结果


选取一段后:
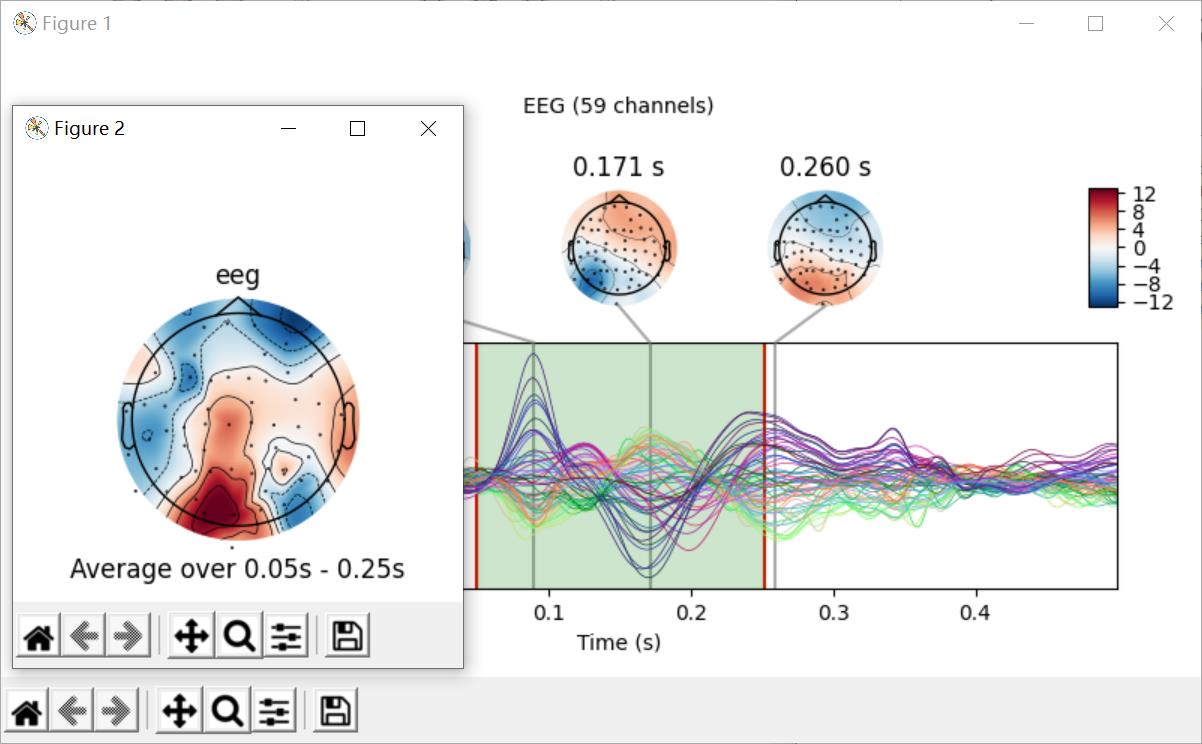
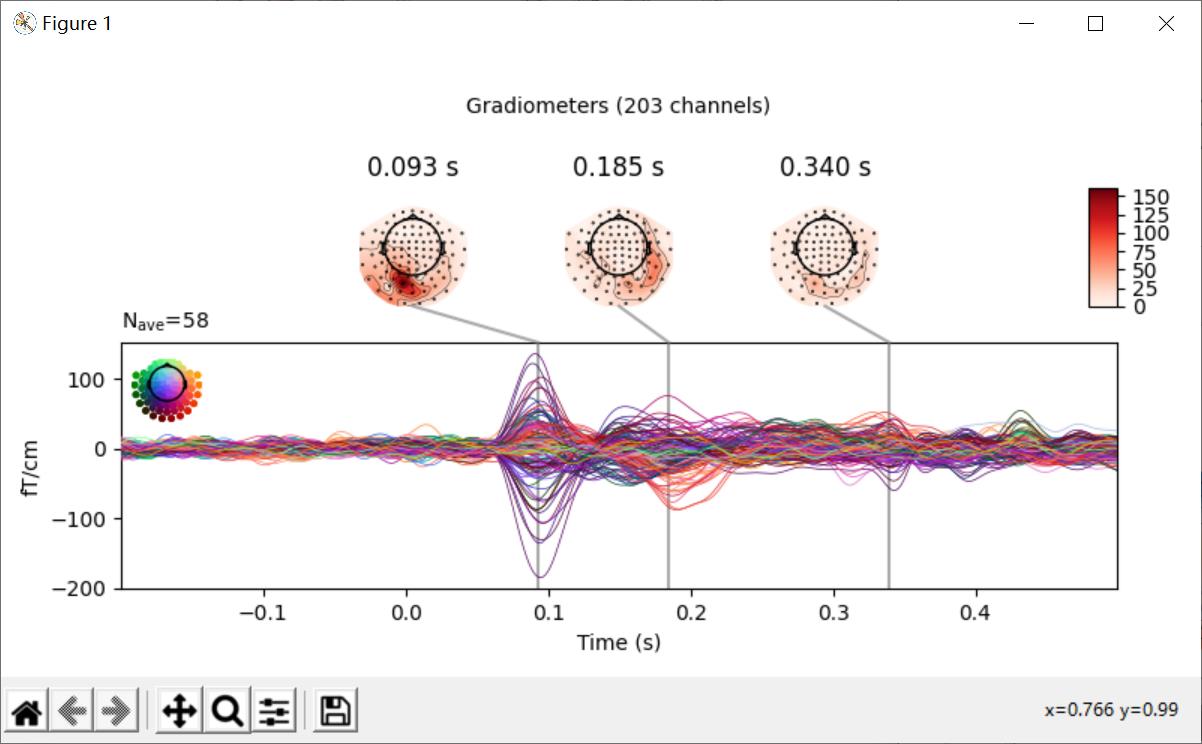
选取一段后:


选取一段后:

对比Evoked对象
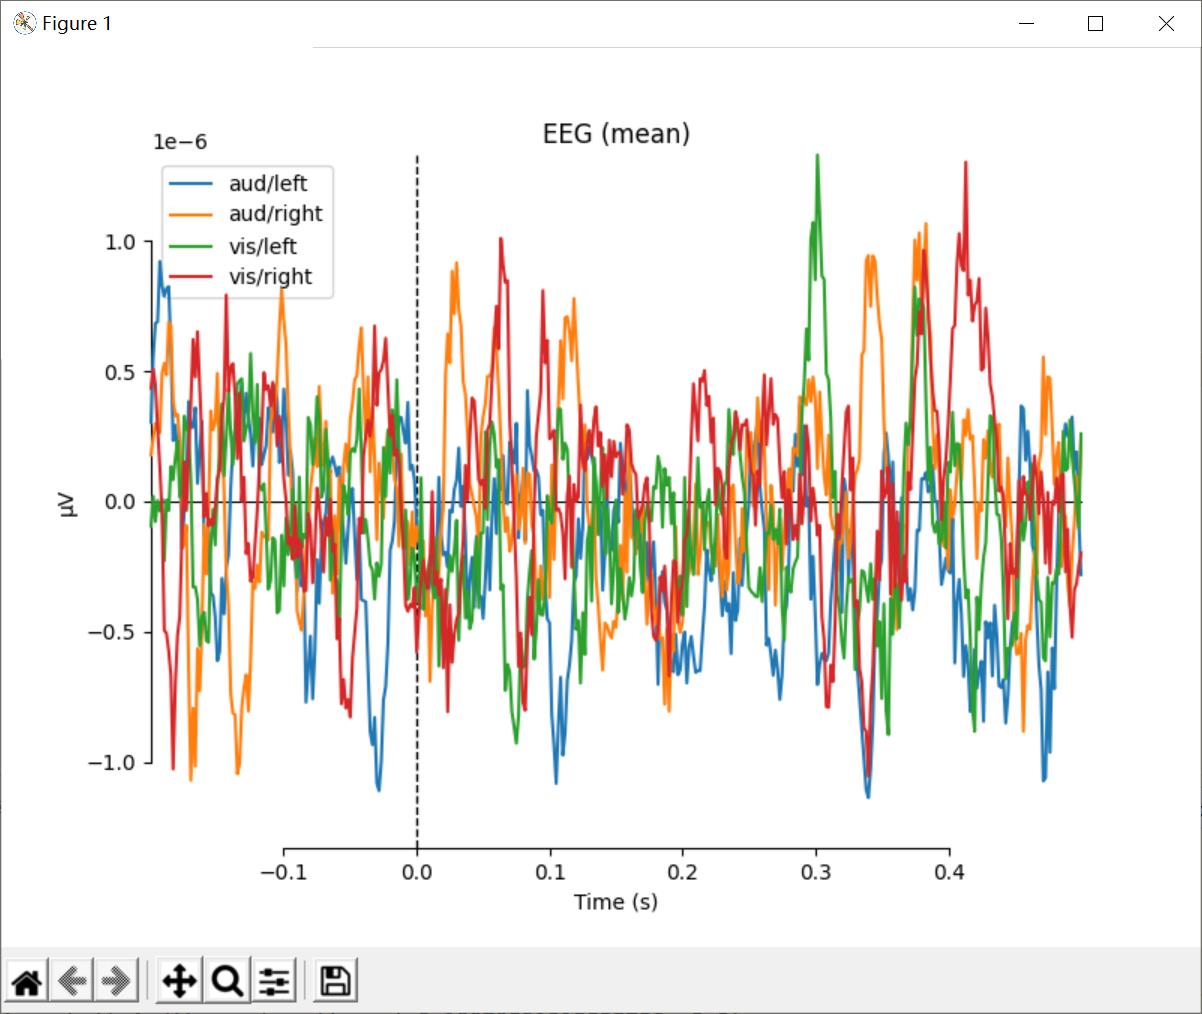
可以采用mne.viz.plot_compare_evokeds来对比不同实验环境下的Evoked对象。它有可以用来选取channnel的pick参数,默认下为每一个channel类型生成一个图。
代码:
# 对比图
def custom_func(x):
    return x.max(axis=1)
for combine in ('mean', 'median', 'gfp', custom_func):
    mne.viz.plot_compare_evokeds(evks, picks='eeg', combine=combine)
plt.show()
结果:


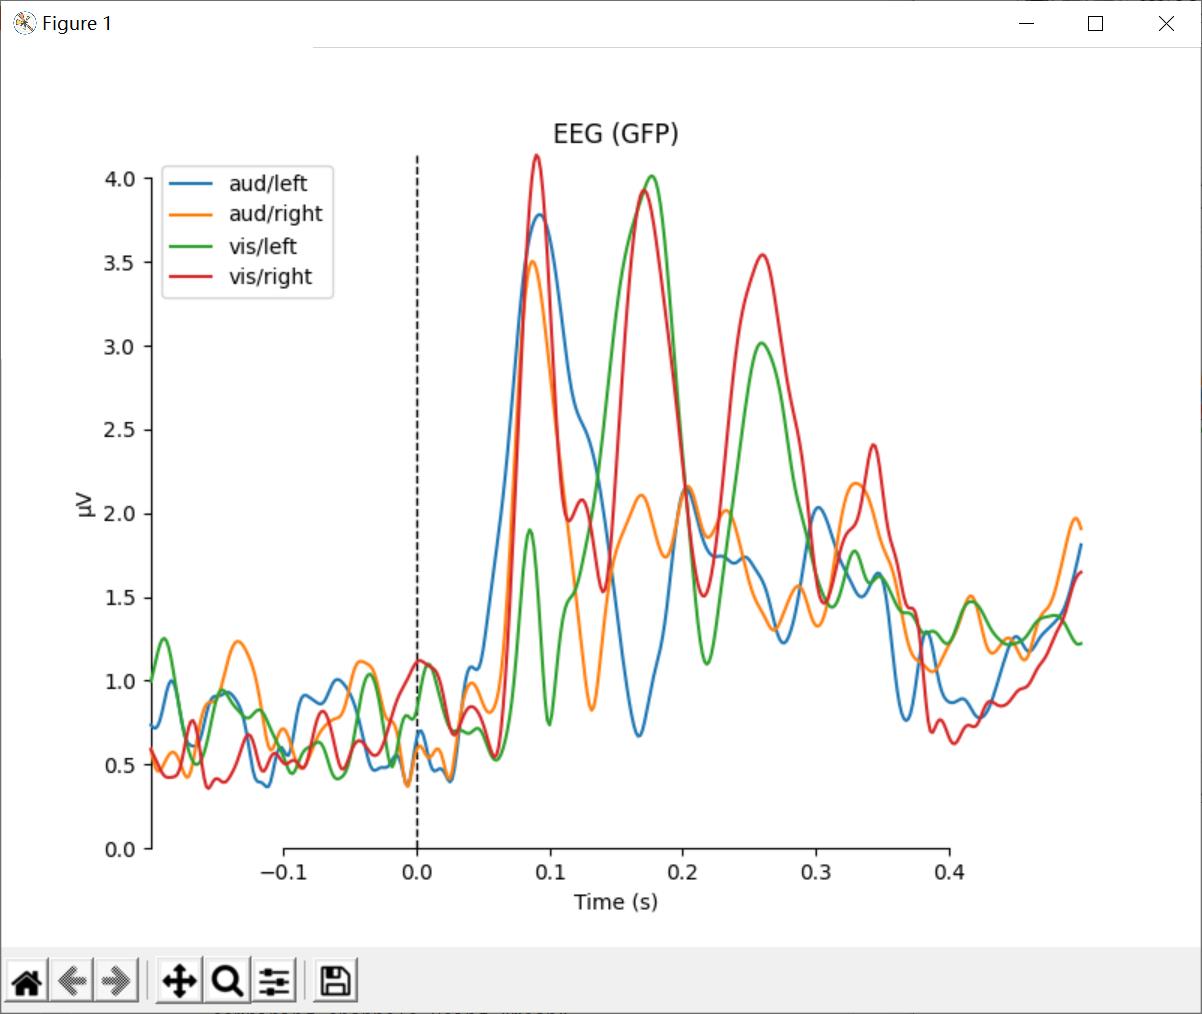

可以对图进行定制,这里我们对aud和vis情况下进行颜色的选择,对left和right情况进行线条的选择。
代码:
# 定制对比图
mne.viz.plot_compare_evokeds(evks, picks='MEG 1811', colors=dict(aud=0, vis=1),
                             linestyles=dict(left='solid', right='dashed'))
plt.show()
结果:

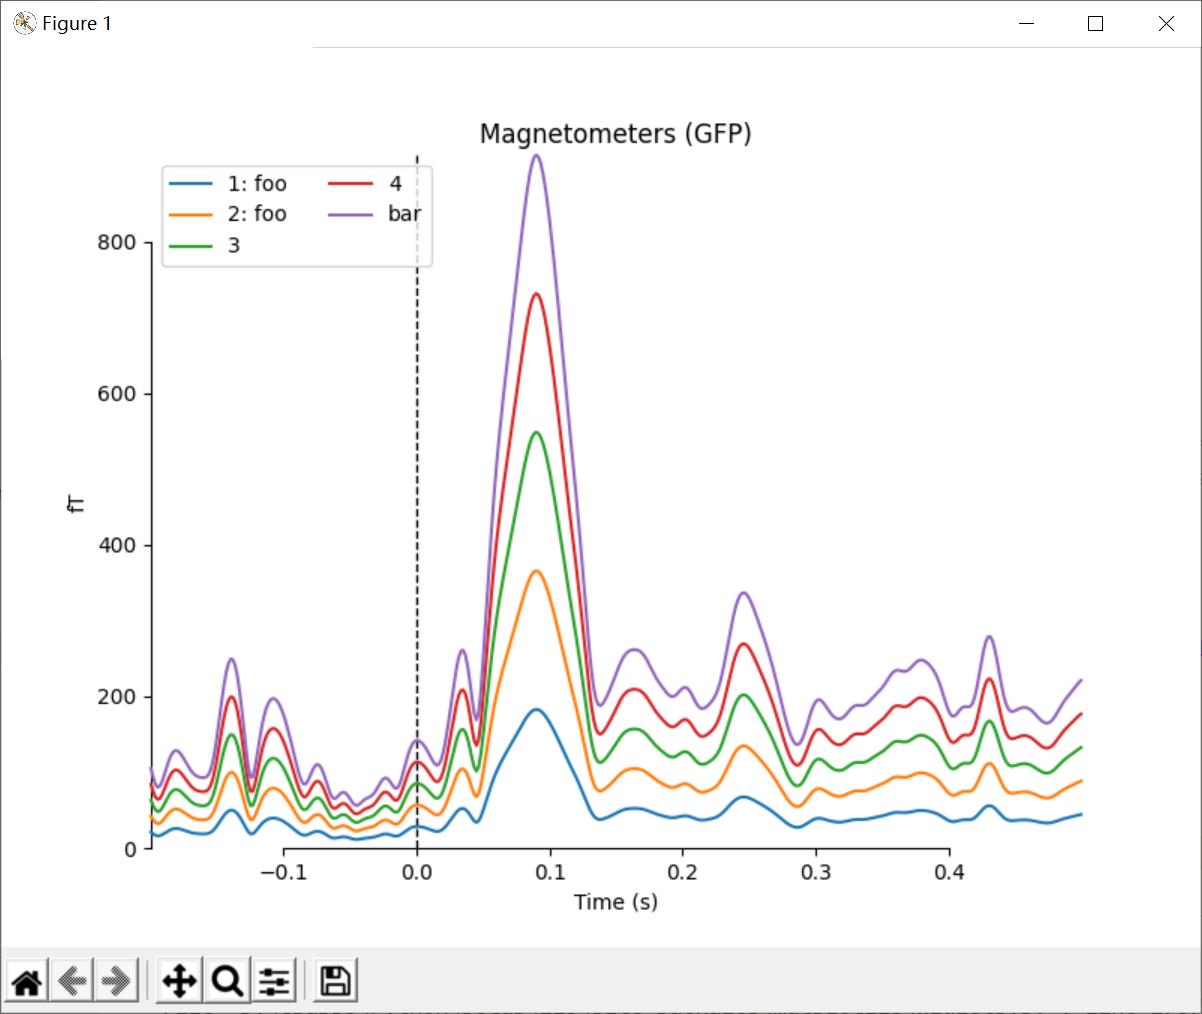
如果传递的是一个Evoked对象的列表或元组,则legend键将被Evoked对象的comment属性自动生成。
代码:
# 传入元组或列表
temp_list = list()
for idx, _comment in enumerate(('foo', 'foo', '', None, 'bar'), start=1):
    _evk = evokeds_list[0].copy()
    _evk.comment = _comment
    _evk.data *= idx  # so we can tell the traces apart
    temp_list.append(_evk)
mne.viz.plot_compare_evokeds(temp_list, picks='mag')
plt.show()
结果:

图像映射(Image plots)
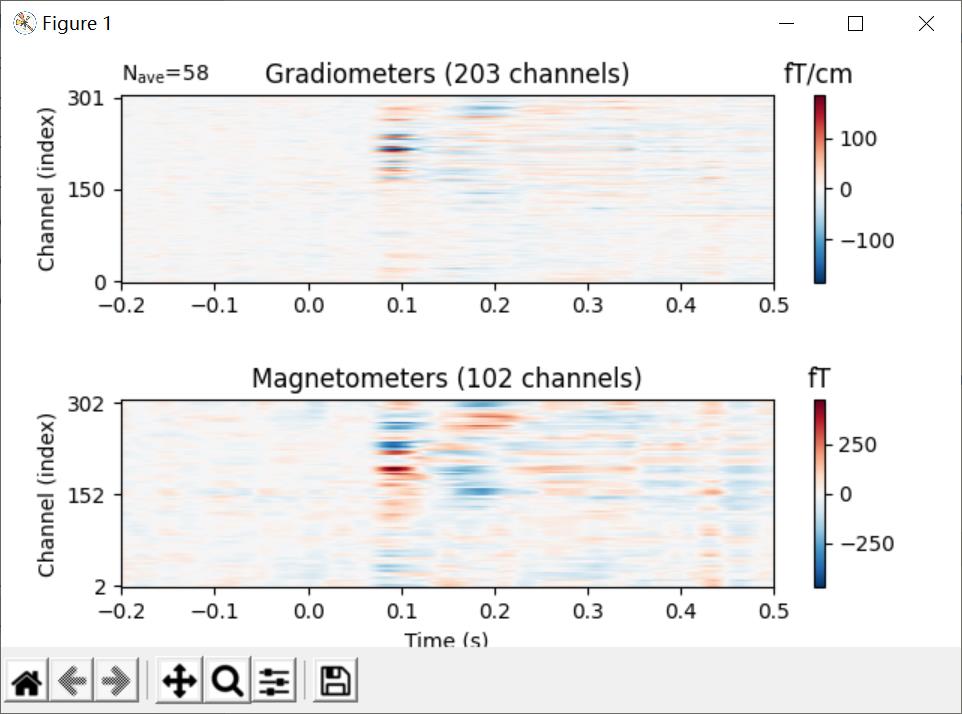
evoked_image()显示每个row的channel
代码:
# image plot
evks['vis/right'].plot_image(picks='meg')
plt.show()
结果:
绘制次地形图(Topographical subplots)
对于sensor级的分析,在地形布局中绘制每个sensor的响应是有用的。 如果传递axes='topo',plot_compare_evakes函数可以进行这样的绘制,但如果传感器的数量太大,它可能会非常慢,所以这里我们只绘制脑电图通道:
代码:
# 次地形图
mne.viz.plot_compare_evokeds(evks, picks='eeg', colors=dict(aud=0, vis=1),
                             linestyles=dict(left='solid', right='dashed'),
                             axes='topo', styles=dict(aud=dict(linewidth=1),
                                                      vis=dict(linewidth=1)))
plt.show()
结果:

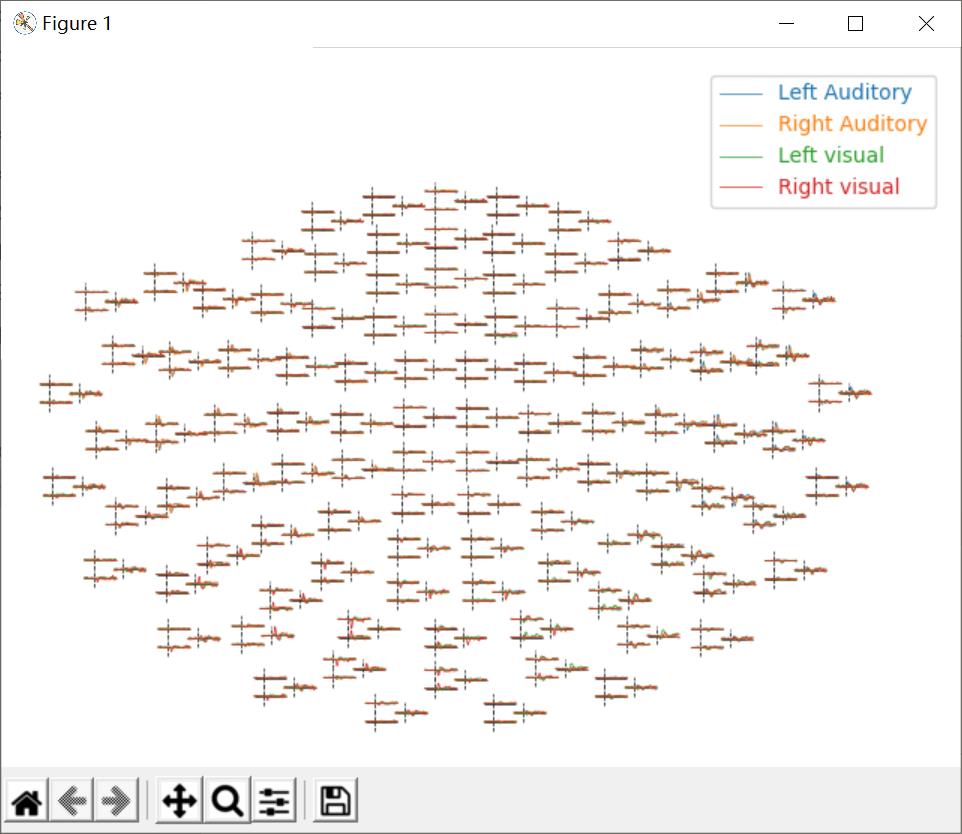
对于大量的sensors,可以使用ecoked.plot_topo()和mne.viz.plot_evoked_topo方法。
ecoked.plot_topo()仅绘制一个情况的。
mne.viz.plot_evoked_topo可以在相同坐标下绘制多个情况的,默认下绘制所有MEG sensors。
代码:
# 大量sensors
mne.viz.plot_evoked_topo(evokeds_list)
plt.show()
结果:

3D区域图(3D Field Maps)
为了能实现3D的效果,需要一个trans文件来对MEG设备和头表面(基于MRI)之间的坐标系进行位置转变。当然,也可以不用trans文件,但是这只能计算MEG头盔上的sensor。
代码:
# 读取trans文件
subjects_dir = os.path.join(sample_data_folder, 'subjects')
sample_data_trans_file = os.path.join(sample_data_folder, 'MEG', 'sample',
                                      'sample_audvis_raw-trans.fif')
默认下,MEG传感器(sensor)用于估计头盔表面的磁场,EEG传感器(sensor)用于估计头皮上的磁场。 一旦计算出映射,就可以使用invoke .plot_field()来绘制它们:
如果报错
RuntimeError: Could not load any valid 3D backend: pyvista, mayavi, notebook,则安装这三个backend。pip install pyvista pip install notebook // 还有mayavi的安装,这个比较复杂关于mayavi的安装,请查看https://blog.csdn.net/qq_45347768/article/details/120082562
如果又报错:
ValueError: numpy.ndarray size changed, may indicate binary incompatibility. Expected 88 from C header, got 80 from PyObject,这是因为numpy版本问题,重装numpy即可pip uninstall numpy pip install numpy
之后要进行UI工具的安装,在mayavi的安装里面我也已经说明了,建议安装PyQt4。
最后是显示的问题,如果图片一闪而过,则需要在代码的最后加一个input()。
代码:
# 绘制3D图
maps = mne.make_field_map(evks['aud/left'], trans=sample_data_trans_file,
                          subject='sample', subjects_dir=subjects_dir)
evks['aud/left'].plot_field(maps, time=0.1)
plt.show()
input()
结果:


同时也可以通过传入meg_surf='head'使用MEG sensors来估计头皮区域。
代码:
for ch_type in ('mag', 'grad', 'eeg'):
    evk = evks['aud/right'].copy().pick(ch_type)
    _map = mne.make_field_map(evk, trans=sample_data_trans_file,
                              subject='sample', subjects_dir=subjects_dir,
                              meg_surf='head')
    fig = evk.plot_field(_map, time=0.1)
    mne.viz.set_3d_title(fig, ch_type, size=20)
plt.show()
input()
结果:


完整代码
import os
import numpy as np
import mne
from matplotlib import pyplot as plt

# 如果没有数据则用这个自动下载
# sample_data_folder = mne.datasets.sample.data_path()
# 已有数据,则直接加载即可
sample_data_folder = "D:\\Data\\MNE-sample-data"
sample_data_evk_file = os.path.join(sample_data_folder, 'MEG', 'sample',
                                    'sample_audvis-ave.fif')
evokeds_list = mne.read_evokeds(sample_data_evk_file, baseline=(None, 0),
                                proj=True, verbose=False)

# Show the condition names, and reassure ourselves that baseline correction has been applied.
for e in evokeds_list:
    print(f'Condition: {e.comment}, baseline: {e.baseline}')

# convert that list of Evoked objects into a dictionary
conds = ('aud/left', 'aud/right', 'vis/left', 'vis/right')
evks = dict(zip(conds, evokeds_list))
#      ‾‾‾‾‾‾‾‾‾‾‾‾‾‾‾‾‾‾‾‾‾‾‾‾‾‾‾‾‾‾ this is equivalent to:
# {'aud/left': evokeds_list[0], 'aud/right': evokeds_list[1],
#  'vis/left': evokeds_list[2], 'vis/right': evokeds_list[3]}

# signal trace
evks['aud/left'].plot(exclude=[])
plt.show()

# pick spatial_color gfp
evks['aud/left'].plot(picks='mag', spatial_colors=True, gfp=True)
plt.show()

# 头皮地形图
times = np.linspace(0.05, 0.13, 5)
evks['aud/left'].plot_topomap(ch_type='mag', times=times, colorbar=True)
plt.show()

# 指定time = 0.09
fig = evks['aud/left'].plot_topomap(ch_type='mag', times=0.09, average=0.1)
fig.text(0.5, 0.05, 'average from 40-140 ms', ha='center')
plt.show()

# 箭头地图
mags = evks['aud/left'].copy().pick_types(meg='mag')
mne.viz.plot_arrowmap(mags.data[:, 175], mags.info, extrapolate='local')
plt.show()

# 联合图
evks['vis/right'].plot_joint()
plt.show()

# 对比图
def custom_func(x):
    return x.max(axis=1)
for combine in ('mean', 'median', 'gfp', custom_func):
    mne.viz.plot_compare_evokeds(evks, picks='eeg', combine=combine)
plt.show()

# 定制对比图
mne.viz.plot_compare_evokeds(evks, picks='MEG 1811', colors=dict(aud=0, vis=1),
                             linestyles=dict(left='solid', right='dashed'))
plt.show()

# 传入元组或列表
temp_list = list()
for idx, _comment in enumerate(('foo', 'foo', '', None, 'bar'), start=1):
    _evk = evokeds_list[0].copy()
    _evk.comment = _comment
    _evk.data *= idx  # so we can tell the traces apart
    temp_list.append(_evk)
mne.viz.plot_compare_evokeds(temp_list, picks='mag')
plt.show()

# image plot
evks['vis/right'].plot_image(picks='meg')
plt.show()

# 次地形图
mne.viz.plot_compare_evokeds(evks, picks='eeg', colors=dict(aud=0, vis=1),
                             linestyles=dict(left='solid', right='dashed'),
                             axes='topo', styles=dict(aud=dict(linewidth=1),
                                                      vis=dict(linewidth=1)))
plt.show()

# 大量sensors
mne.viz.plot_evoked_topo(evokeds_list)
plt.show()

# 3D
# 读取trans文件
subjects_dir = os.path.join(sample_data_folder, 'subjects')
sample_data_trans_file = os.path.join(sample_data_folder, 'MEG', 'sample',
                                      'sample_audvis_raw-trans.fif')

# 绘制3D图
maps = mne.make_field_map(evks['aud/left'], trans=sample_data_trans_file,
                          subject='sample', subjects_dir=subjects_dir)
evks['aud/left'].plot_field(maps, time=0.1)
plt.show()
input()

for ch_type in ('mag', 'grad', 'eeg'):
    evk = evks['aud/right'].copy().pick(ch_type)
    _map = mne.make_field_map(evk, trans=sample_data_trans_file,
                              subject='sample', subjects_dir=subjects_dir,
                              meg_surf='head')
    fig = evk.plot_field(_map, time=0.1)
    mne.viz.set_3d_title(fig, ch_type, size=20)
plt.show()
input()
以上是关于MNE学习笔记:Evoked data的可视化的主要内容,如果未能解决你的问题,请参考以下文章